Zip Codes with the Highest Percentage of Population Employed in Computer & Mathematics in El Paso, TX
RELATED REPORTS & OPTIONS
Computer & Mathematics
El Paso
Compare Zip Codes
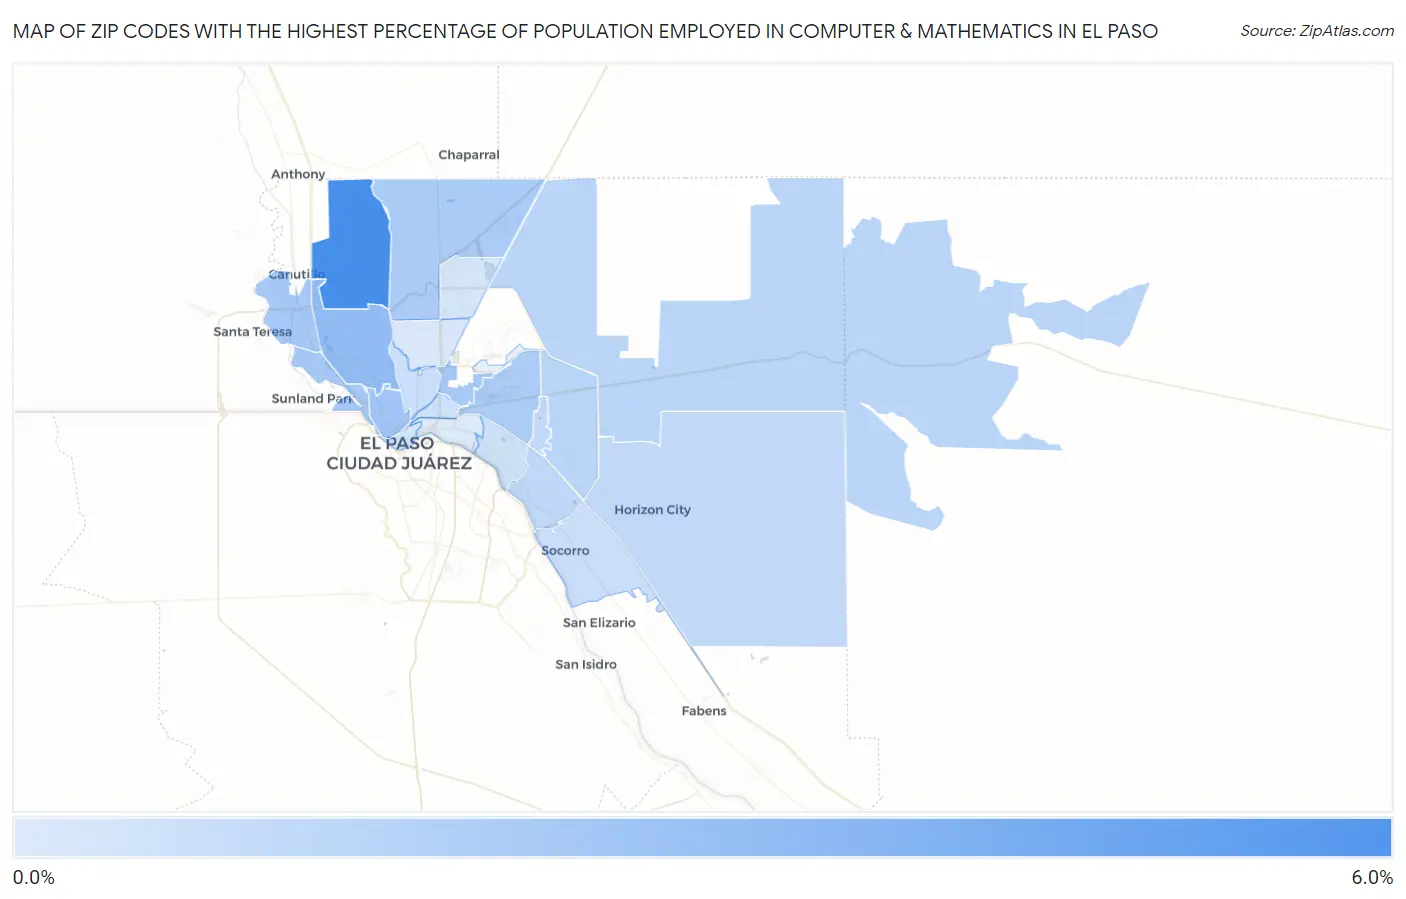
Map of Zip Codes with the Highest Percentage of Population Employed in Computer & Mathematics in El Paso
0.0%
6.0%
Zip Codes with the Highest Percentage of Population Employed in Computer & Mathematics in El Paso, TX
| Zip Code | % Employed | vs State | vs National | |
| 1. | 79911 | 5.9% | 3.4%(+2.43)#145 | 3.5%(+2.34)#2,436 |
| 2. | 79912 | 3.2% | 3.4%(-0.269)#397 | 3.5%(-0.358)#7,202 |
| 3. | 79902 | 2.6% | 3.4%(-0.835)#492 | 3.5%(-0.924)#9,209 |
| 4. | 79906 | 2.5% | 3.4%(-0.983)#523 | 3.5%(-1.07)#9,827 |
| 5. | 79932 | 2.4% | 3.4%(-0.990)#525 | 3.5%(-1.08)#9,856 |
| 6. | 79922 | 2.4% | 3.4%(-1.03)#537 | 3.5%(-1.12)#10,021 |
| 7. | 79934 | 2.3% | 3.4%(-1.14)#568 | 3.5%(-1.23)#10,455 |
| 8. | 79925 | 2.2% | 3.4%(-1.20)#580 | 3.5%(-1.29)#10,731 |
| 9. | 79936 | 1.7% | 3.4%(-1.71)#700 | 3.5%(-1.80)#13,121 |
| 10. | 79938 | 1.7% | 3.4%(-1.74)#712 | 3.5%(-1.83)#13,284 |
| 11. | 79907 | 1.5% | 3.4%(-1.92)#764 | 3.5%(-2.01)#14,260 |
| 12. | 79928 | 1.4% | 3.4%(-2.01)#799 | 3.5%(-2.10)#14,823 |
| 13. | 79935 | 1.4% | 3.4%(-2.02)#801 | 3.5%(-2.11)#14,837 |
| 14. | 79927 | 1.1% | 3.4%(-2.29)#905 | 3.5%(-2.38)#16,450 |
| 15. | 79930 | 1.1% | 3.4%(-2.31)#915 | 3.5%(-2.40)#16,562 |
| 16. | 79915 | 1.00% | 3.4%(-2.44)#970 | 3.5%(-2.53)#17,414 |
| 17. | 79903 | 0.95% | 3.4%(-2.49)#992 | 3.5%(-2.57)#17,697 |
| 18. | 79901 | 0.79% | 3.4%(-2.64)#1,053 | 3.5%(-2.73)#18,665 |
| 19. | 79924 | 0.76% | 3.4%(-2.68)#1,068 | 3.5%(-2.77)#18,889 |
| 20. | 79904 | 0.65% | 3.4%(-2.79)#1,121 | 3.5%(-2.88)#19,582 |
| 21. | 79905 | 0.49% | 3.4%(-2.95)#1,182 | 3.5%(-3.04)#20,556 |
1
Common Questions
What are the Top 10 Zip Codes with the Highest Percentage of Population Employed in Computer & Mathematics in El Paso, TX?
Top 10 Zip Codes with the Highest Percentage of Population Employed in Computer & Mathematics in El Paso, TX are:
What zip code has the Highest Percentage of Population Employed in Computer & Mathematics in El Paso, TX?
79911 has the Highest Percentage of Population Employed in Computer & Mathematics in El Paso, TX with 5.9%.
What is the Percentage of Population Employed in Computer & Mathematics in El Paso, TX?
Percentage of Population Employed in Computer & Mathematics in El Paso is 1.9%.
What is the Percentage of Population Employed in Computer & Mathematics in Texas?
Percentage of Population Employed in Computer & Mathematics in Texas is 3.4%.
What is the Percentage of Population Employed in Computer & Mathematics in the United States?
Percentage of Population Employed in Computer & Mathematics in the United States is 3.5%.