Zip Codes with the Highest Percentage of Population Employed in Computer & Mathematics in Rowlett, TX
RELATED REPORTS & OPTIONS
Computer & Mathematics
Rowlett
Compare Zip Codes
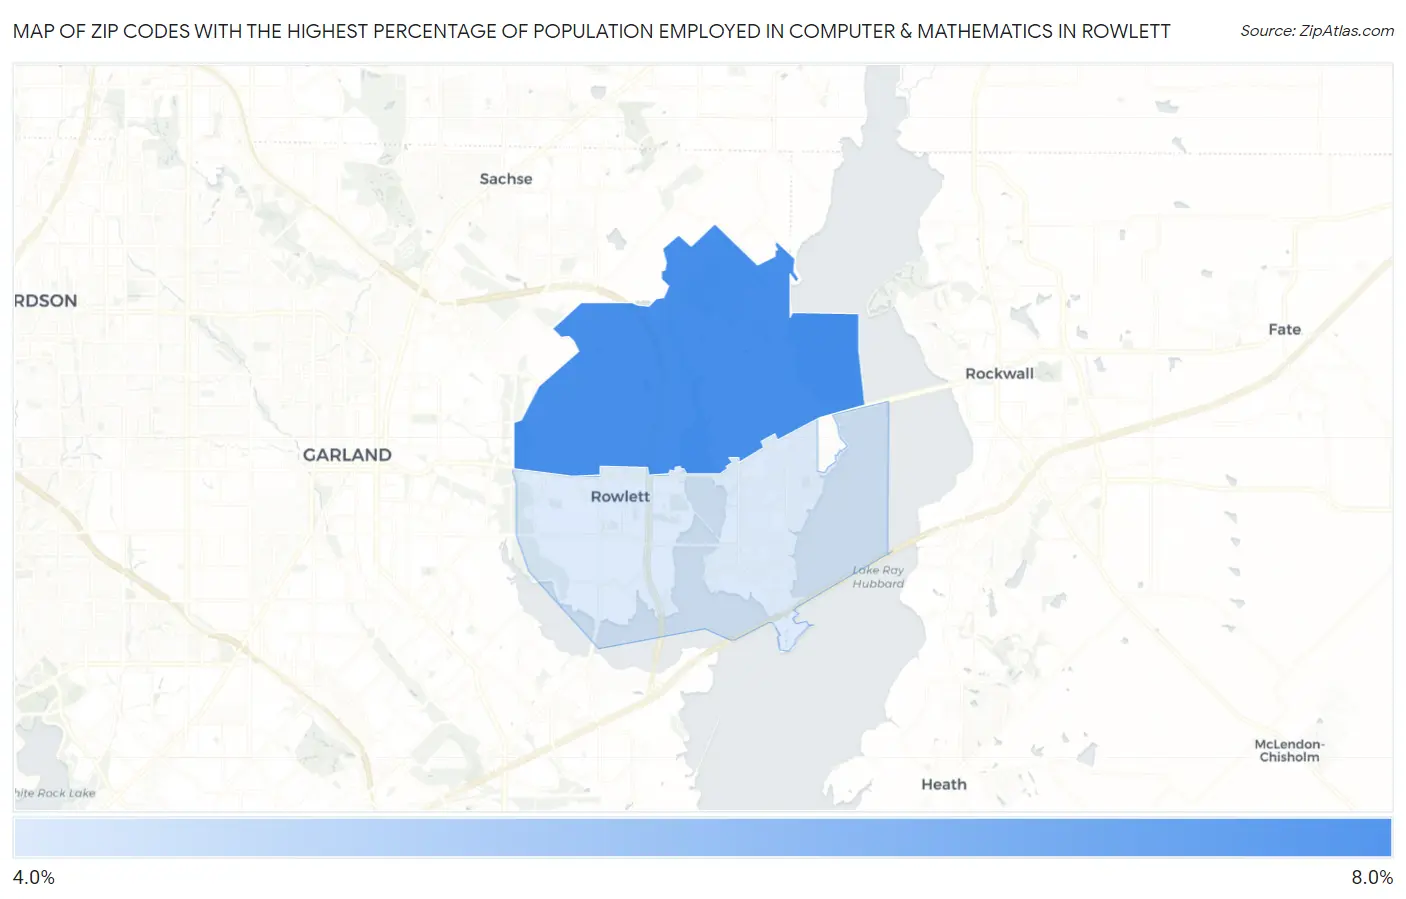
Map of Zip Codes with the Highest Percentage of Population Employed in Computer & Mathematics in Rowlett
0.0%
8.0%
Zip Codes with the Highest Percentage of Population Employed in Computer & Mathematics in Rowlett, TX
| Zip Code | % Employed | vs State | vs National | |
| 1. | 75089 | 7.2% | 3.4%(+3.81)#104 | 3.5%(+3.72)#1,491 |
| 2. | 75088 | 4.2% | 3.4%(+0.723)#272 | 3.5%(+0.634)#4,688 |
1
Common Questions
What are the Top Zip Codes with the Highest Percentage of Population Employed in Computer & Mathematics in Rowlett, TX?
Top Zip Codes with the Highest Percentage of Population Employed in Computer & Mathematics in Rowlett, TX are:
What zip code has the Highest Percentage of Population Employed in Computer & Mathematics in Rowlett, TX?
75089 has the Highest Percentage of Population Employed in Computer & Mathematics in Rowlett, TX with 7.2%.
What is the Percentage of Population Employed in Computer & Mathematics in Rowlett, TX?
Percentage of Population Employed in Computer & Mathematics in Rowlett is 5.8%.
What is the Percentage of Population Employed in Computer & Mathematics in Texas?
Percentage of Population Employed in Computer & Mathematics in Texas is 3.4%.
What is the Percentage of Population Employed in Computer & Mathematics in the United States?
Percentage of Population Employed in Computer & Mathematics in the United States is 3.5%.