Zip Codes with the Highest Percentage of Population Employed in Computer & Mathematics in Duncanville, TX
RELATED REPORTS & OPTIONS
Computer & Mathematics
Duncanville
Compare Zip Codes
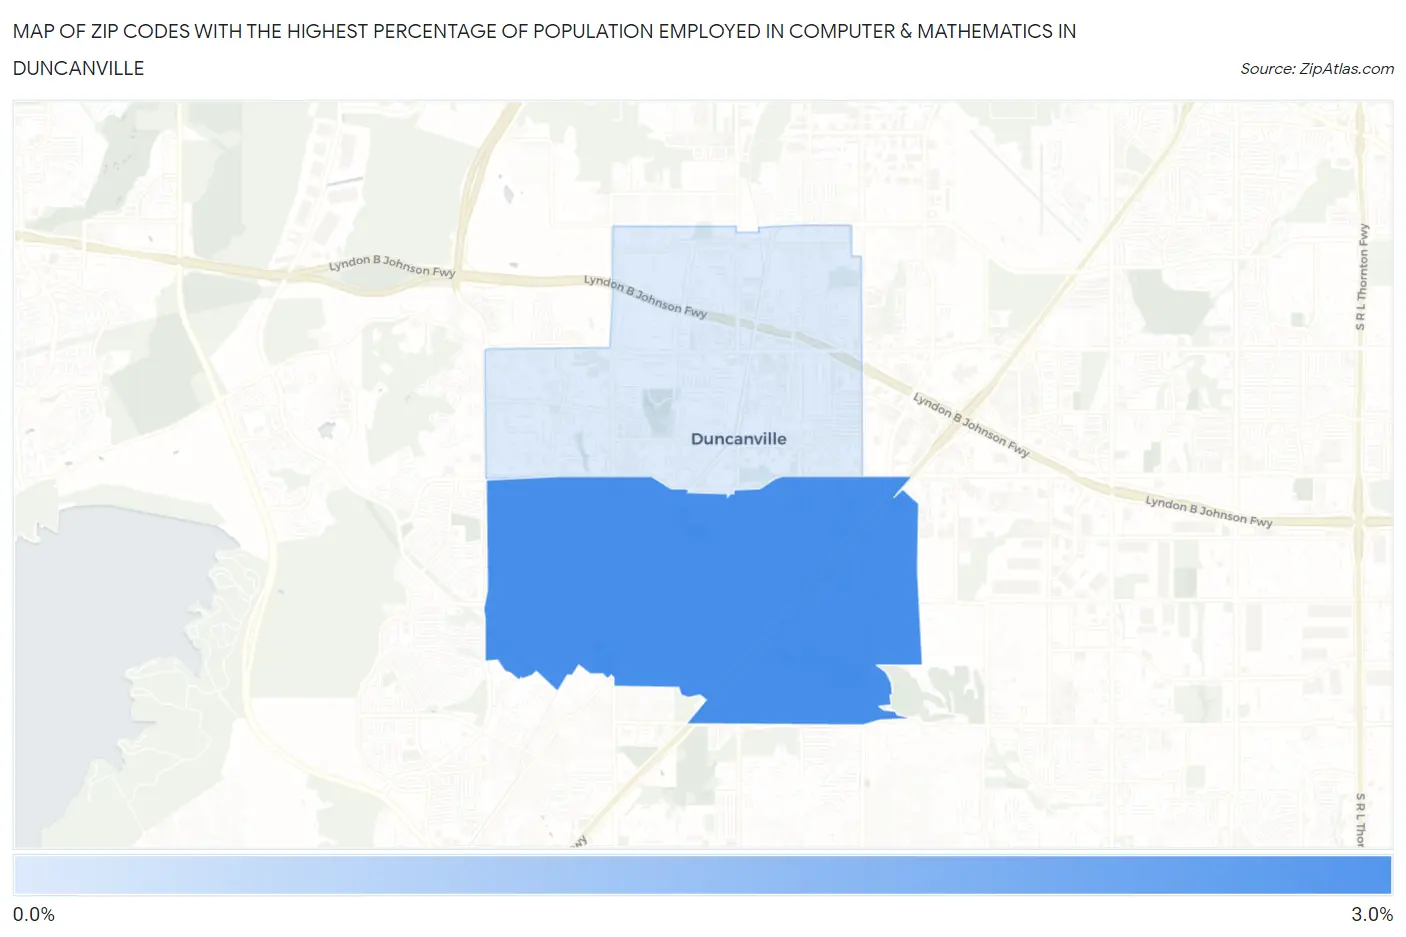
Map of Zip Codes with the Highest Percentage of Population Employed in Computer & Mathematics in Duncanville
0.0%
3.0%
Zip Codes with the Highest Percentage of Population Employed in Computer & Mathematics in Duncanville, TX
| Zip Code | % Employed | vs State | vs National | |
| 1. | 75137 | 2.7% | 3.4%(-0.774)#478 | 3.5%(-0.863)#8,984 |
| 2. | 75116 | 0.53% | 3.4%(-2.90)#1,164 | 3.5%(-2.99)#20,292 |
1
Common Questions
What are the Top Zip Codes with the Highest Percentage of Population Employed in Computer & Mathematics in Duncanville, TX?
Top Zip Codes with the Highest Percentage of Population Employed in Computer & Mathematics in Duncanville, TX are:
What zip code has the Highest Percentage of Population Employed in Computer & Mathematics in Duncanville, TX?
75137 has the Highest Percentage of Population Employed in Computer & Mathematics in Duncanville, TX with 2.7%.
What is the Percentage of Population Employed in Computer & Mathematics in Duncanville, TX?
Percentage of Population Employed in Computer & Mathematics in Duncanville is 1.6%.
What is the Percentage of Population Employed in Computer & Mathematics in Texas?
Percentage of Population Employed in Computer & Mathematics in Texas is 3.4%.
What is the Percentage of Population Employed in Computer & Mathematics in the United States?
Percentage of Population Employed in Computer & Mathematics in the United States is 3.5%.