Zip Codes with the Highest Percentage of Population Employed in Computer & Mathematics in San Antonio, TX
RELATED REPORTS & OPTIONS
Computer & Mathematics
San Antonio
Compare Zip Codes
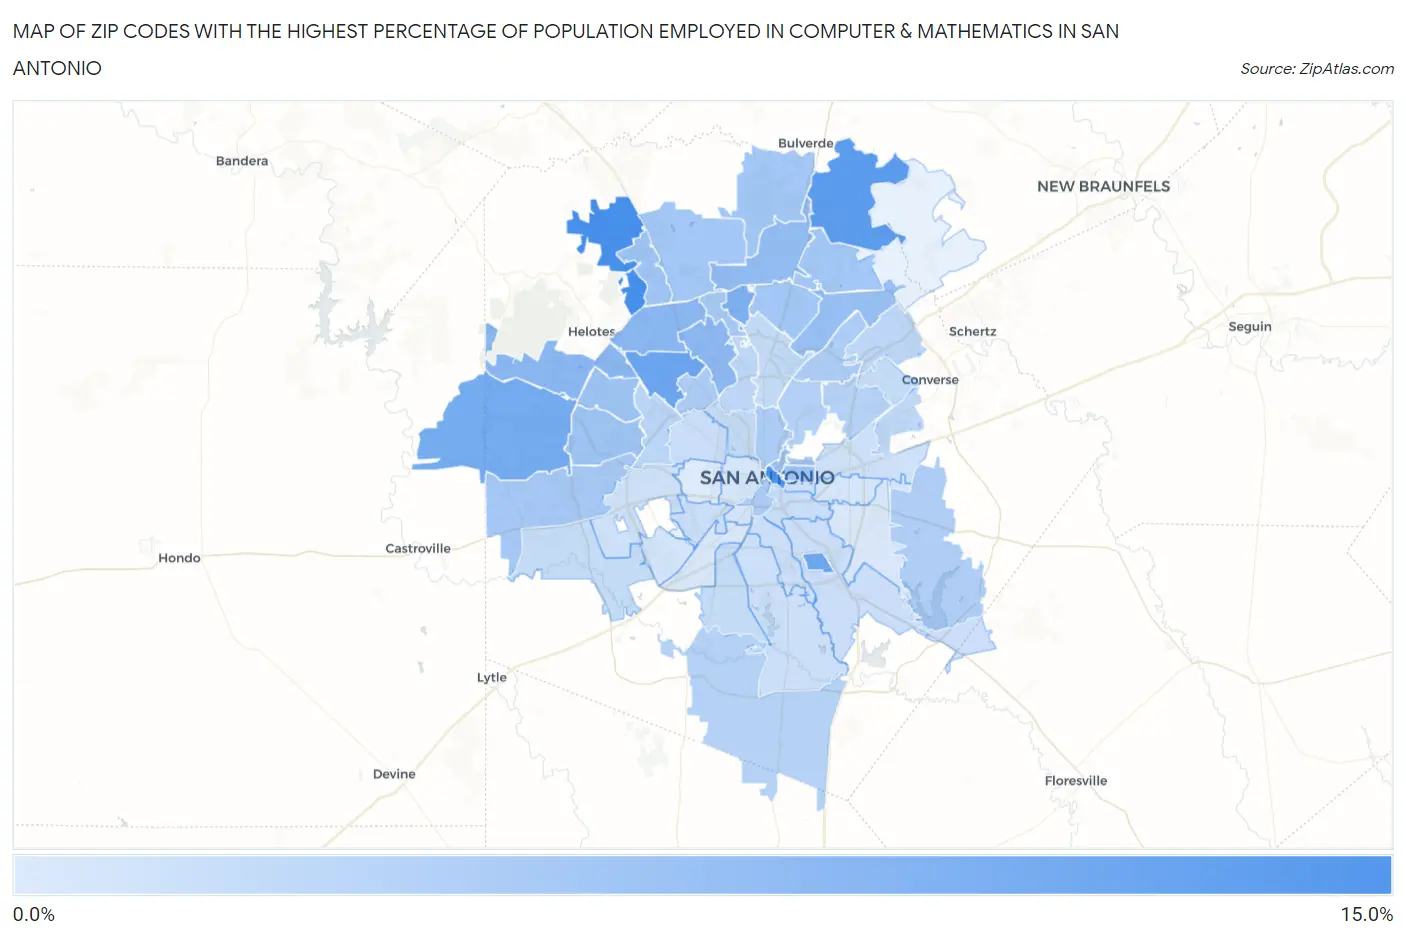
Map of Zip Codes with the Highest Percentage of Population Employed in Computer & Mathematics in San Antonio
0.0%
15.0%
Zip Codes with the Highest Percentage of Population Employed in Computer & Mathematics in San Antonio, TX
| Zip Code | % Employed | vs State | vs National | |
| 1. | 78255 | 10.5% | 3.4%(+7.08)#43 | 3.5%(+7.00)#628 |
| 2. | 78205 | 10.0% | 3.4%(+6.57)#47 | 3.5%(+6.49)#711 |
| 3. | 78261 | 9.0% | 3.4%(+5.58)#60 | 3.5%(+5.49)#900 |
| 4. | 78240 | 7.9% | 3.4%(+4.47)#75 | 3.5%(+4.38)#1,233 |
| 5. | 78235 | 7.6% | 3.4%(+4.19)#90 | 3.5%(+4.10)#1,344 |
| 6. | 78253 | 7.2% | 3.4%(+3.73)#106 | 3.5%(+3.64)#1,533 |
| 7. | 78248 | 6.6% | 3.4%(+3.18)#117 | 3.5%(+3.09)#1,846 |
| 8. | 78254 | 5.8% | 3.4%(+2.37)#146 | 3.5%(+2.29)#2,489 |
| 9. | 78249 | 5.8% | 3.4%(+2.36)#147 | 3.5%(+2.27)#2,498 |
| 10. | 78230 | 5.5% | 3.4%(+2.08)#162 | 3.5%(+1.99)#2,760 |
| 11. | 78258 | 5.0% | 3.4%(+1.60)#193 | 3.5%(+1.51)#3,320 |
| 12. | 78247 | 4.9% | 3.4%(+1.43)#209 | 3.5%(+1.34)#3,551 |
| 13. | 78202 | 4.4% | 3.4%(+1.01)#241 | 3.5%(+0.924)#4,179 |
| 14. | 78215 | 4.3% | 3.4%(+0.880)#251 | 3.5%(+0.791)#4,404 |
| 15. | 78250 | 4.3% | 3.4%(+0.861)#252 | 3.5%(+0.772)#4,437 |
| 16. | 78251 | 4.2% | 3.4%(+0.803)#259 | 3.5%(+0.714)#4,538 |
| 17. | 78256 | 4.2% | 3.4%(+0.777)#263 | 3.5%(+0.688)#4,589 |
| 18. | 78257 | 4.1% | 3.4%(+0.627)#283 | 3.5%(+0.538)#4,899 |
| 19. | 78260 | 4.1% | 3.4%(+0.619)#285 | 3.5%(+0.530)#4,911 |
| 20. | 78232 | 4.0% | 3.4%(+0.598)#287 | 3.5%(+0.509)#4,959 |
| 21. | 78259 | 4.0% | 3.4%(+0.595)#288 | 3.5%(+0.506)#4,970 |
| 22. | 78208 | 3.9% | 3.4%(+0.485)#299 | 3.5%(+0.396)#5,209 |
| 23. | 78245 | 3.8% | 3.4%(+0.402)#301 | 3.5%(+0.313)#5,383 |
| 24. | 78231 | 3.7% | 3.4%(+0.236)#321 | 3.5%(+0.148)#5,800 |
| 25. | 78204 | 3.5% | 3.4%(+0.105)#335 | 3.5%(+0.016)#6,095 |
| 26. | 78217 | 3.4% | 3.4%(-0.053)#359 | 3.5%(-0.141)#6,534 |
| 27. | 78229 | 3.4% | 3.4%(-0.055)#360 | 3.5%(-0.144)#6,542 |
| 28. | 78212 | 3.4% | 3.4%(-0.084)#365 | 3.5%(-0.172)#6,615 |
| 29. | 78263 | 3.3% | 3.4%(-0.171)#378 | 3.5%(-0.260)#6,894 |
| 30. | 78209 | 2.8% | 3.4%(-0.597)#451 | 3.5%(-0.686)#8,314 |
| 31. | 78264 | 2.7% | 3.4%(-0.750)#472 | 3.5%(-0.838)#8,890 |
| 32. | 78218 | 2.7% | 3.4%(-0.757)#476 | 3.5%(-0.846)#8,922 |
| 33. | 78238 | 2.4% | 3.4%(-1.02)#534 | 3.5%(-1.11)#9,957 |
| 34. | 78213 | 2.3% | 3.4%(-1.12)#561 | 3.5%(-1.21)#10,380 |
| 35. | 78233 | 2.3% | 3.4%(-1.12)#563 | 3.5%(-1.21)#10,389 |
| 36. | 78244 | 2.1% | 3.4%(-1.34)#607 | 3.5%(-1.43)#11,345 |
| 37. | 78216 | 1.8% | 3.4%(-1.60)#671 | 3.5%(-1.69)#12,605 |
| 38. | 78224 | 1.6% | 3.4%(-1.82)#738 | 3.5%(-1.91)#13,704 |
| 39. | 78252 | 1.6% | 3.4%(-1.83)#742 | 3.5%(-1.92)#13,757 |
| 40. | 78201 | 1.6% | 3.4%(-1.85)#746 | 3.5%(-1.94)#13,881 |
| 41. | 78239 | 1.6% | 3.4%(-1.86)#748 | 3.5%(-1.95)#13,927 |
| 42. | 78210 | 1.5% | 3.4%(-1.94)#773 | 3.5%(-2.02)#14,380 |
| 43. | 78228 | 1.3% | 3.4%(-2.11)#836 | 3.5%(-2.20)#15,400 |
| 44. | 78223 | 1.3% | 3.4%(-2.16)#850 | 3.5%(-2.25)#15,678 |
| 45. | 78203 | 1.3% | 3.4%(-2.17)#853 | 3.5%(-2.25)#15,720 |
| 46. | 78214 | 1.2% | 3.4%(-2.20)#868 | 3.5%(-2.29)#15,946 |
| 47. | 78226 | 1.2% | 3.4%(-2.24)#888 | 3.5%(-2.33)#16,142 |
| 48. | 78221 | 1.1% | 3.4%(-2.31)#913 | 3.5%(-2.39)#16,541 |
| 49. | 78219 | 1.1% | 3.4%(-2.34)#930 | 3.5%(-2.43)#16,789 |
| 50. | 78227 | 1.0% | 3.4%(-2.40)#953 | 3.5%(-2.49)#17,189 |
| 51. | 78225 | 0.84% | 3.4%(-2.59)#1,036 | 3.5%(-2.68)#18,371 |
| 52. | 78242 | 0.75% | 3.4%(-2.69)#1,074 | 3.5%(-2.78)#18,967 |
| 53. | 78220 | 0.53% | 3.4%(-2.91)#1,166 | 3.5%(-3.00)#20,329 |
| 54. | 78207 | 0.51% | 3.4%(-2.92)#1,176 | 3.5%(-3.01)#20,423 |
| 55. | 78211 | 0.45% | 3.4%(-2.99)#1,193 | 3.5%(-3.07)#20,781 |
| 56. | 78222 | 0.39% | 3.4%(-3.05)#1,230 | 3.5%(-3.14)#21,142 |
| 57. | 78237 | 0.12% | 3.4%(-3.32)#1,320 | 3.5%(-3.41)#22,332 |
1
Common Questions
What are the Top 10 Zip Codes with the Highest Percentage of Population Employed in Computer & Mathematics in San Antonio, TX?
Top 10 Zip Codes with the Highest Percentage of Population Employed in Computer & Mathematics in San Antonio, TX are:
What zip code has the Highest Percentage of Population Employed in Computer & Mathematics in San Antonio, TX?
78255 has the Highest Percentage of Population Employed in Computer & Mathematics in San Antonio, TX with 10.5%.
What is the Percentage of Population Employed in Computer & Mathematics in San Antonio, TX?
Percentage of Population Employed in Computer & Mathematics in San Antonio is 3.2%.
What is the Percentage of Population Employed in Computer & Mathematics in Texas?
Percentage of Population Employed in Computer & Mathematics in Texas is 3.4%.
What is the Percentage of Population Employed in Computer & Mathematics in the United States?
Percentage of Population Employed in Computer & Mathematics in the United States is 3.5%.