Zip Codes with the Highest Percentage of Population Employed in Computer & Mathematics in Brownsville, TX
RELATED REPORTS & OPTIONS
Computer & Mathematics
Brownsville
Compare Zip Codes
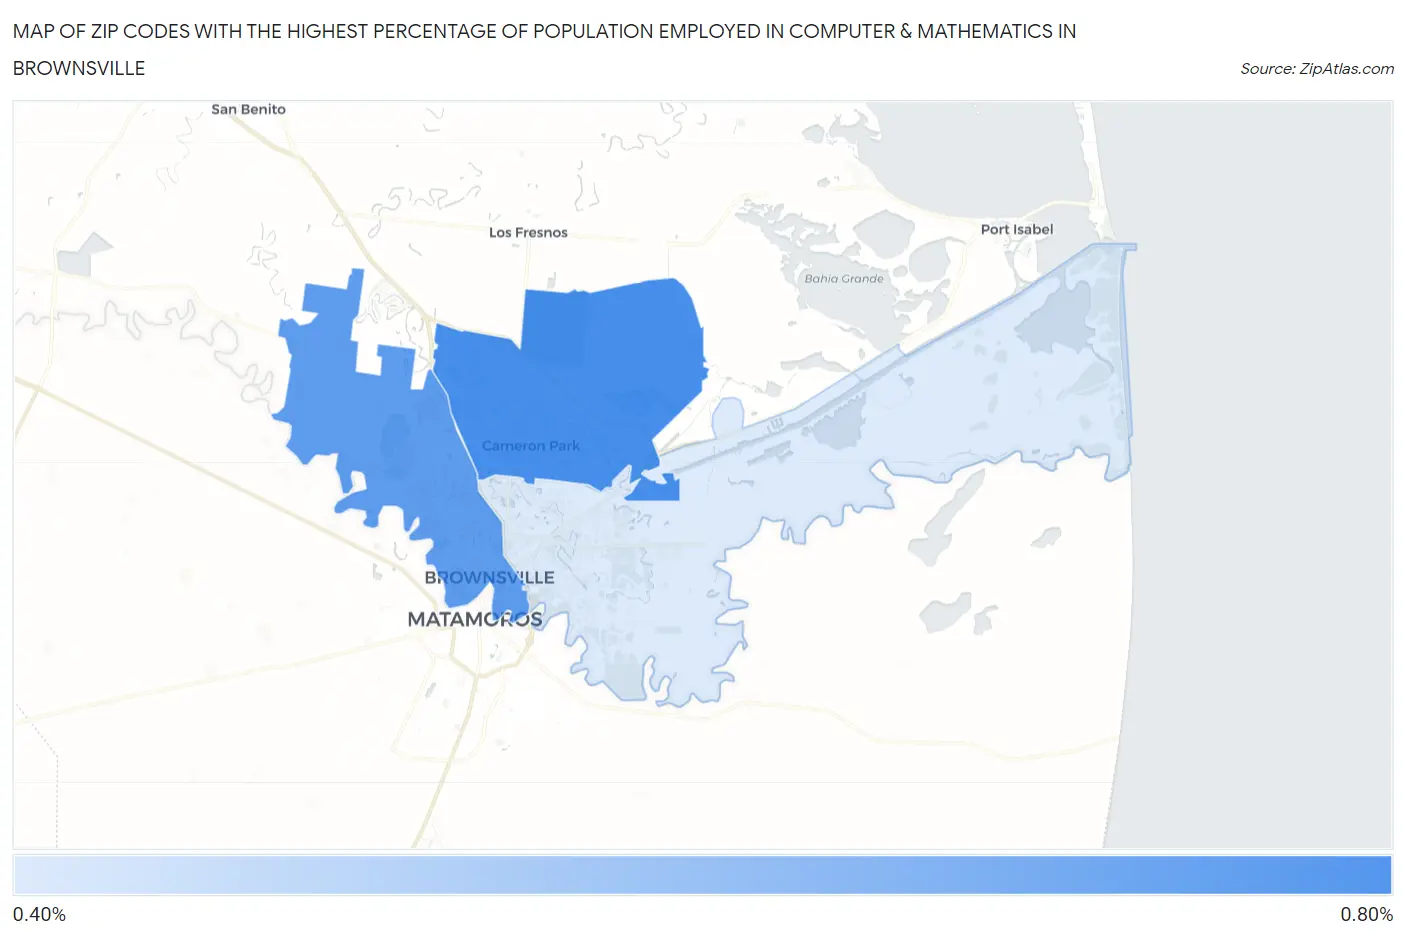
Map of Zip Codes with the Highest Percentage of Population Employed in Computer & Mathematics in Brownsville
0.0%
0.80%
Zip Codes with the Highest Percentage of Population Employed in Computer & Mathematics in Brownsville, TX
| Zip Code | % Employed | vs State | vs National | |
| 1. | 78526 | 0.79% | 3.4%(-2.65)#1,057 | 3.5%(-2.74)#18,699 |
| 2. | 78520 | 0.75% | 3.4%(-2.69)#1,075 | 3.5%(-2.78)#18,978 |
| 3. | 78521 | 0.50% | 3.4%(-2.94)#1,179 | 3.5%(-3.03)#20,499 |
1
Common Questions
What are the Top Zip Codes with the Highest Percentage of Population Employed in Computer & Mathematics in Brownsville, TX?
Top Zip Codes with the Highest Percentage of Population Employed in Computer & Mathematics in Brownsville, TX are:
What zip code has the Highest Percentage of Population Employed in Computer & Mathematics in Brownsville, TX?
78526 has the Highest Percentage of Population Employed in Computer & Mathematics in Brownsville, TX with 0.79%.
What is the Percentage of Population Employed in Computer & Mathematics in Brownsville, TX?
Percentage of Population Employed in Computer & Mathematics in Brownsville is 0.66%.
What is the Percentage of Population Employed in Computer & Mathematics in Texas?
Percentage of Population Employed in Computer & Mathematics in Texas is 3.4%.
What is the Percentage of Population Employed in Computer & Mathematics in the United States?
Percentage of Population Employed in Computer & Mathematics in the United States is 3.5%.