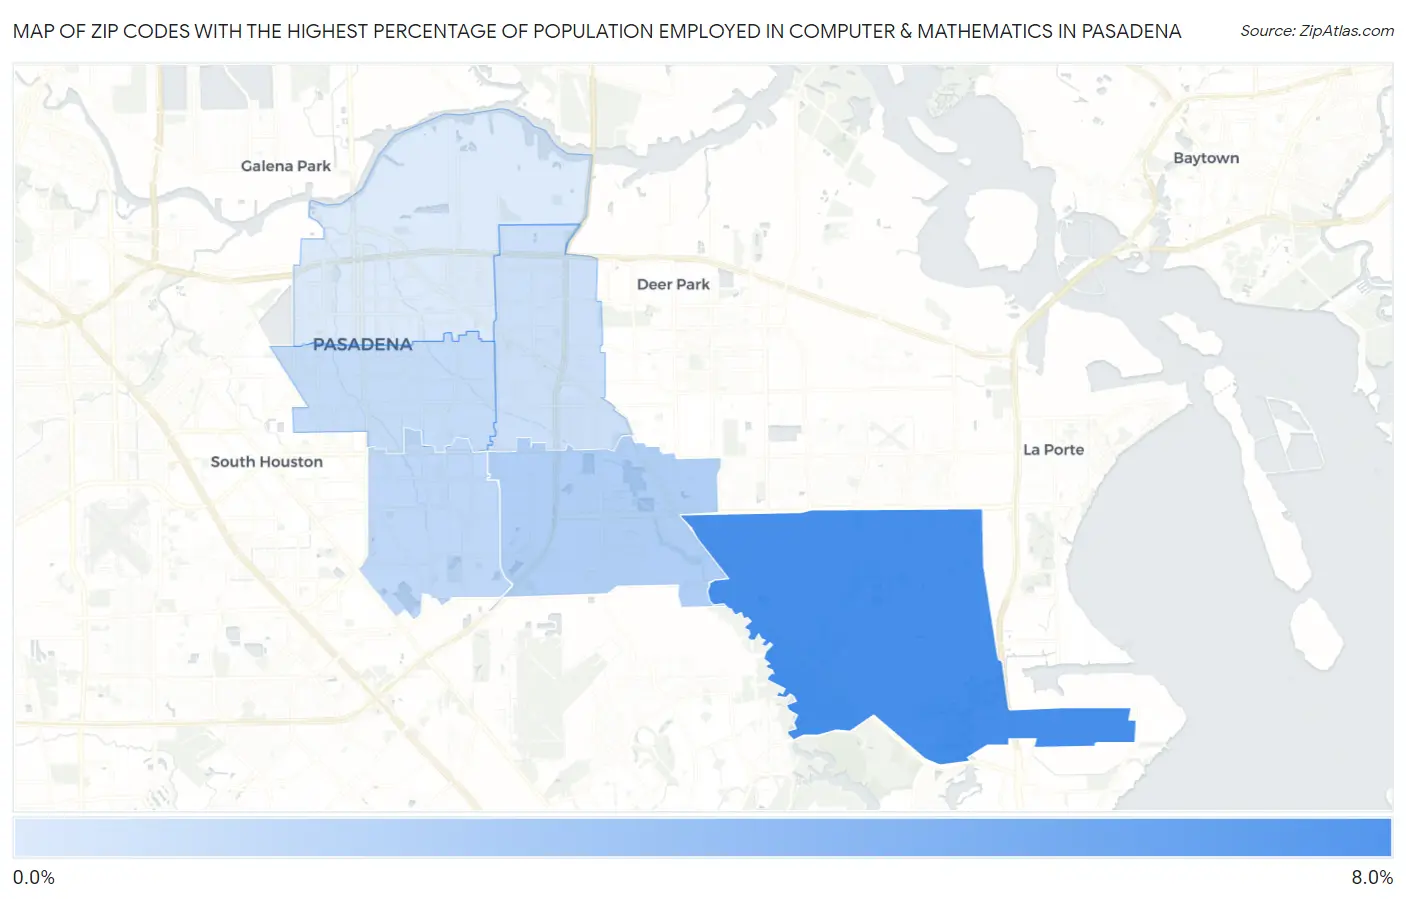
Zip Codes with the Highest Percentage of Population Employed in Computer & Mathematics in Pasadena, TX
RELATED REPORTS & OPTIONS
Computer & Mathematics
Pasadena
Compare Zip Codes
Map of Zip Codes with the Highest Percentage of Population Employed in Computer & Mathematics in Pasadena
0.0%
8.0%
Zip Codes with the Highest Percentage of Population Employed in Computer & Mathematics in Pasadena, TX
| Zip Code | % Employed | vs State | vs National | |
| 1. | 77507 | 7.3% | 3.4%(+3.85)#102 | 3.5%(+3.76)#1,470 |
| 2. | 77505 | 2.2% | 3.4%(-1.26)#596 | 3.5%(-1.35)#11,002 |
| 3. | 77504 | 1.5% | 3.4%(-1.93)#772 | 3.5%(-2.02)#14,352 |
| 4. | 77502 | 1.1% | 3.4%(-2.31)#917 | 3.5%(-2.40)#16,576 |
| 5. | 77503 | 0.87% | 3.4%(-2.57)#1,029 | 3.5%(-2.66)#18,234 |
| 6. | 77506 | 0.093% | 3.4%(-3.34)#1,325 | 3.5%(-3.43)#22,383 |
1
Common Questions
What are the Top 5 Zip Codes with the Highest Percentage of Population Employed in Computer & Mathematics in Pasadena, TX?
Top 5 Zip Codes with the Highest Percentage of Population Employed in Computer & Mathematics in Pasadena, TX are:
What zip code has the Highest Percentage of Population Employed in Computer & Mathematics in Pasadena, TX?
77507 has the Highest Percentage of Population Employed in Computer & Mathematics in Pasadena, TX with 7.3%.
What is the Percentage of Population Employed in Computer & Mathematics in Pasadena, TX?
Percentage of Population Employed in Computer & Mathematics in Pasadena is 1.4%.
What is the Percentage of Population Employed in Computer & Mathematics in Texas?
Percentage of Population Employed in Computer & Mathematics in Texas is 3.4%.
What is the Percentage of Population Employed in Computer & Mathematics in the United States?
Percentage of Population Employed in Computer & Mathematics in the United States is 3.5%.