Zip Codes with the Highest Percentage of Population Employed in Computer & Mathematics in Illinois
RELATED REPORTS & OPTIONS
Computer & Mathematics
Illinois
Compare Zip Codes
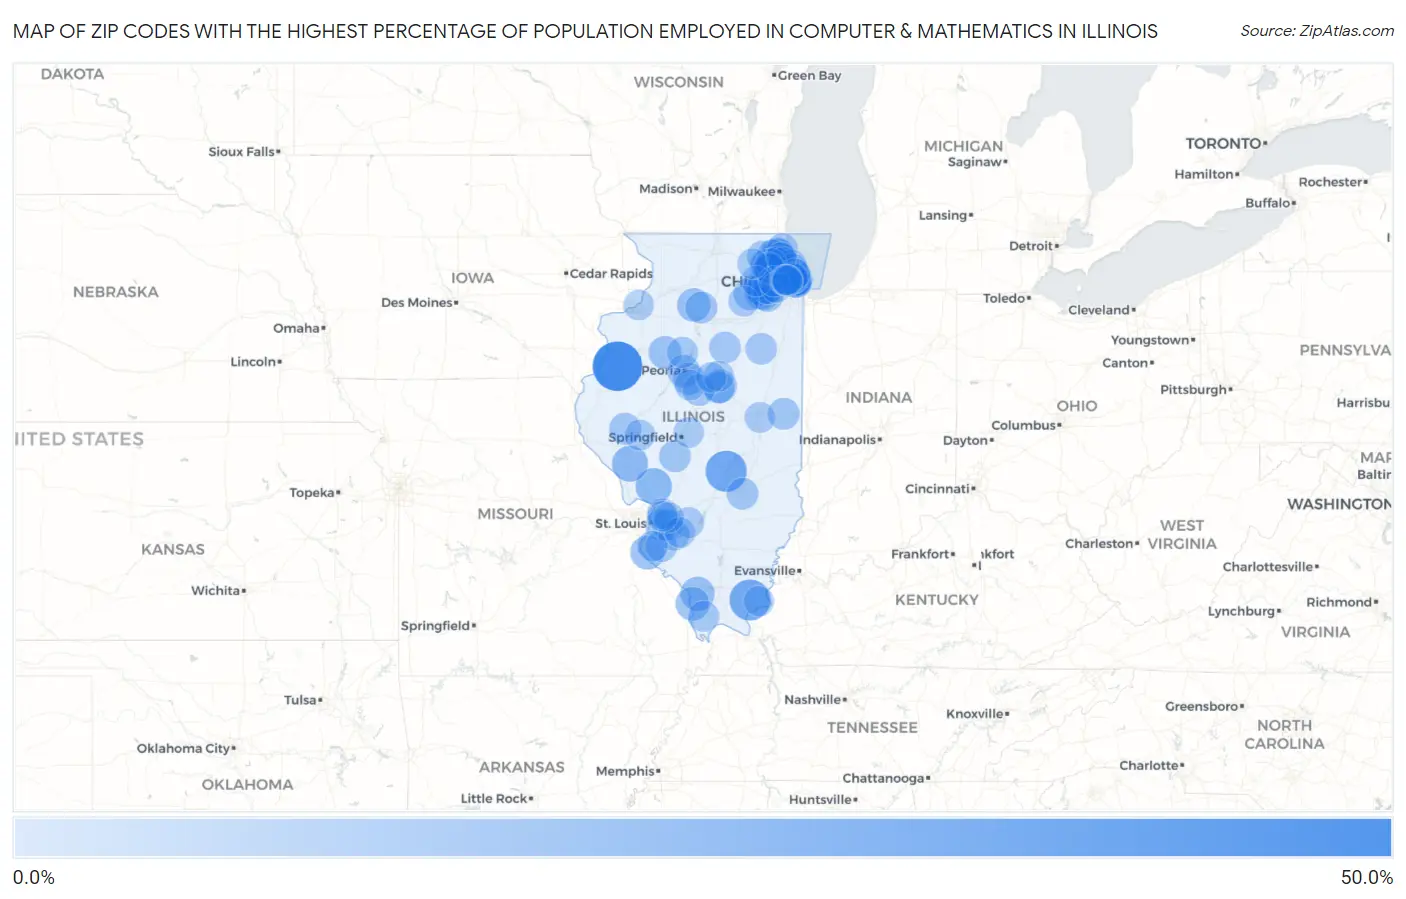
Map of Zip Codes with the Highest Percentage of Population Employed in Computer & Mathematics in Illinois
0.0%
50.0%
Zip Codes with the Highest Percentage of Population Employed in Computer & Mathematics in Illinois
| Zip Code | % Employed | vs State | vs National | |
| 1. | 61478 | 50.0% | 3.6%(+46.4)#1 | 3.5%(+46.5)#14 |
| 2. | 62438 | 30.3% | 3.6%(+26.8)#2 | 3.5%(+26.8)#48 |
| 3. | 62947 | 30.0% | 3.6%(+26.4)#3 | 3.5%(+26.5)#49 |
| 4. | 60195 | 19.2% | 3.6%(+15.6)#4 | 3.5%(+15.7)#147 |
| 5. | 62079 | 19.0% | 3.6%(+15.4)#5 | 3.5%(+15.4)#151 |
| 6. | 62050 | 18.5% | 3.6%(+15.0)#6 | 3.5%(+15.0)#161 |
| 7. | 60604 | 16.7% | 3.6%(+13.2)#7 | 3.5%(+13.2)#195 |
| 8. | 60661 | 15.5% | 3.6%(+11.9)#8 | 3.5%(+11.9)#231 |
| 9. | 60069 | 15.4% | 3.6%(+11.8)#9 | 3.5%(+11.9)#238 |
| 10. | 62256 | 14.3% | 3.6%(+10.7)#10 | 3.5%(+10.8)#288 |
| 11. | 60173 | 14.1% | 3.6%(+10.5)#11 | 3.5%(+10.5)#303 |
| 12. | 60089 | 14.1% | 3.6%(+10.5)#12 | 3.5%(+10.5)#304 |
| 13. | 62975 | 14.0% | 3.6%(+10.4)#13 | 3.5%(+10.4)#314 |
| 14. | 62998 | 13.5% | 3.6%(+9.90)#14 | 3.5%(+9.94)#337 |
| 15. | 61704 | 13.0% | 3.6%(+9.45)#15 | 3.5%(+9.49)#362 |
| 16. | 61349 | 12.7% | 3.6%(+9.11)#16 | 3.5%(+9.15)#384 |
| 17. | 60563 | 12.0% | 3.6%(+8.45)#17 | 3.5%(+8.49)#440 |
| 18. | 61451 | 11.5% | 3.6%(+7.98)#18 | 3.5%(+8.01)#486 |
| 19. | 60502 | 11.5% | 3.6%(+7.95)#19 | 3.5%(+7.98)#492 |
| 20. | 60512 | 11.3% | 3.6%(+7.76)#20 | 3.5%(+7.80)#516 |
| 21. | 60603 | 11.3% | 3.6%(+7.73)#21 | 3.5%(+7.77)#520 |
| 22. | 61602 | 11.1% | 3.6%(+7.55)#22 | 3.5%(+7.59)#547 |
| 23. | 60564 | 10.3% | 3.6%(+6.75)#23 | 3.5%(+6.79)#660 |
| 24. | 60601 | 10.3% | 3.6%(+6.71)#24 | 3.5%(+6.75)#664 |
| 25. | 61535 | 10.1% | 3.6%(+6.56)#25 | 3.5%(+6.60)#687 |
| 26. | 60192 | 10.0% | 3.6%(+6.45)#26 | 3.5%(+6.49)#710 |
| 27. | 60532 | 9.9% | 3.6%(+6.33)#27 | 3.5%(+6.37)#724 |
| 28. | 60602 | 9.7% | 3.6%(+6.16)#28 | 3.5%(+6.20)#752 |
| 29. | 60061 | 9.7% | 3.6%(+6.09)#29 | 3.5%(+6.13)#763 |
| 30. | 62689 | 9.1% | 3.6%(+5.58)#30 | 3.5%(+5.62)#868 |
| 31. | 61330 | 9.1% | 3.6%(+5.55)#31 | 3.5%(+5.59)#879 |
| 32. | 61857 | 9.1% | 3.6%(+5.53)#32 | 3.5%(+5.57)#887 |
| 33. | 61705 | 9.1% | 3.6%(+5.52)#33 | 3.5%(+5.56)#890 |
| 34. | 62378 | 8.9% | 3.6%(+5.38)#34 | 3.5%(+5.42)#915 |
| 35. | 62473 | 8.9% | 3.6%(+5.34)#35 | 3.5%(+5.38)#925 |
| 36. | 61333 | 8.8% | 3.6%(+5.23)#36 | 3.5%(+5.27)#957 |
| 37. | 61759 | 8.7% | 3.6%(+5.15)#37 | 3.5%(+5.19)#982 |
| 38. | 60610 | 8.7% | 3.6%(+5.14)#38 | 3.5%(+5.17)#991 |
| 39. | 60642 | 8.6% | 3.6%(+5.06)#39 | 3.5%(+5.10)#1,015 |
| 40. | 62208 | 8.5% | 3.6%(+4.96)#40 | 3.5%(+5.00)#1,044 |
| 41. | 60503 | 8.4% | 3.6%(+4.79)#41 | 3.5%(+4.83)#1,094 |
| 42. | 60919 | 8.2% | 3.6%(+4.68)#42 | 3.5%(+4.72)#1,137 |
| 43. | 62248 | 8.2% | 3.6%(+4.66)#43 | 3.5%(+4.69)#1,145 |
| 44. | 60504 | 8.2% | 3.6%(+4.63)#44 | 3.5%(+4.66)#1,151 |
| 45. | 62269 | 8.2% | 3.6%(+4.59)#45 | 3.5%(+4.63)#1,161 |
| 46. | 60611 | 8.0% | 3.6%(+4.46)#46 | 3.5%(+4.50)#1,200 |
| 47. | 60657 | 7.9% | 3.6%(+4.31)#47 | 3.5%(+4.35)#1,245 |
| 48. | 60605 | 7.9% | 3.6%(+4.31)#48 | 3.5%(+4.35)#1,246 |
| 49. | 60490 | 7.8% | 3.6%(+4.19)#49 | 3.5%(+4.23)#1,300 |
| 50. | 60613 | 7.7% | 3.6%(+4.17)#50 | 3.5%(+4.21)#1,307 |
| 51. | 60607 | 7.7% | 3.6%(+4.09)#51 | 3.5%(+4.13)#1,331 |
| 52. | 60606 | 7.6% | 3.6%(+4.03)#52 | 3.5%(+4.07)#1,353 |
| 53. | 60143 | 7.5% | 3.6%(+3.90)#53 | 3.5%(+3.93)#1,403 |
| 54. | 60654 | 7.4% | 3.6%(+3.87)#54 | 3.5%(+3.91)#1,412 |
| 55. | 61526 | 7.3% | 3.6%(+3.75)#55 | 3.5%(+3.78)#1,461 |
| 56. | 60021 | 7.3% | 3.6%(+3.72)#56 | 3.5%(+3.76)#1,473 |
| 57. | 62258 | 7.2% | 3.6%(+3.66)#57 | 3.5%(+3.70)#1,494 |
| 58. | 60614 | 7.2% | 3.6%(+3.62)#58 | 3.5%(+3.65)#1,527 |
| 59. | 62961 | 7.1% | 3.6%(+3.58)#59 | 3.5%(+3.62)#1,550 |
| 60. | 60047 | 7.1% | 3.6%(+3.55)#60 | 3.5%(+3.58)#1,565 |
| 61. | 60090 | 6.9% | 3.6%(+3.38)#61 | 3.5%(+3.41)#1,658 |
| 62. | 60005 | 6.8% | 3.6%(+3.25)#62 | 3.5%(+3.29)#1,731 |
| 63. | 60044 | 6.8% | 3.6%(+3.23)#63 | 3.5%(+3.27)#1,738 |
| 64. | 60091 | 6.8% | 3.6%(+3.22)#64 | 3.5%(+3.25)#1,747 |
| 65. | 60540 | 6.8% | 3.6%(+3.21)#65 | 3.5%(+3.25)#1,751 |
| 66. | 61568 | 6.7% | 3.6%(+3.17)#66 | 3.5%(+3.21)#1,770 |
| 67. | 60193 | 6.7% | 3.6%(+3.15)#67 | 3.5%(+3.19)#1,789 |
| 68. | 62631 | 6.7% | 3.6%(+3.10)#68 | 3.5%(+3.14)#1,822 |
| 69. | 60004 | 6.7% | 3.6%(+3.10)#69 | 3.5%(+3.14)#1,826 |
| 70. | 60202 | 6.7% | 3.6%(+3.10)#70 | 3.5%(+3.14)#1,828 |
| 71. | 62034 | 6.6% | 3.6%(+3.07)#71 | 3.5%(+3.11)#1,836 |
| 72. | 60616 | 6.6% | 3.6%(+3.04)#72 | 3.5%(+3.08)#1,859 |
| 73. | 60194 | 6.6% | 3.6%(+3.03)#73 | 3.5%(+3.07)#1,862 |
| 74. | 62298 | 6.6% | 3.6%(+3.03)#74 | 3.5%(+3.07)#1,866 |
| 75. | 60062 | 6.5% | 3.6%(+2.97)#75 | 3.5%(+3.01)#1,904 |
| 76. | 61874 | 6.5% | 3.6%(+2.96)#76 | 3.5%(+3.00)#1,914 |
| 77. | 60067 | 6.5% | 3.6%(+2.92)#77 | 3.5%(+2.95)#1,945 |
| 78. | 60647 | 6.5% | 3.6%(+2.91)#78 | 3.5%(+2.95)#1,948 |
| 79. | 60622 | 6.4% | 3.6%(+2.86)#79 | 3.5%(+2.90)#1,988 |
| 80. | 62230 | 6.4% | 3.6%(+2.85)#80 | 3.5%(+2.89)#1,998 |
| 81. | 60536 | 6.4% | 3.6%(+2.82)#81 | 3.5%(+2.86)#2,013 |
| 82. | 60640 | 6.4% | 3.6%(+2.81)#82 | 3.5%(+2.85)#2,020 |
| 83. | 60169 | 6.3% | 3.6%(+2.75)#83 | 3.5%(+2.79)#2,071 |
| 84. | 62265 | 6.3% | 3.6%(+2.74)#84 | 3.5%(+2.77)#2,085 |
| 85. | 60134 | 6.2% | 3.6%(+2.67)#85 | 3.5%(+2.70)#2,127 |
| 86. | 61748 | 6.2% | 3.6%(+2.66)#86 | 3.5%(+2.70)#2,128 |
| 87. | 60559 | 6.1% | 3.6%(+2.55)#87 | 3.5%(+2.59)#2,215 |
| 88. | 60148 | 6.1% | 3.6%(+2.55)#88 | 3.5%(+2.58)#2,219 |
| 89. | 62294 | 6.1% | 3.6%(+2.51)#89 | 3.5%(+2.55)#2,246 |
| 90. | 62561 | 6.0% | 3.6%(+2.46)#90 | 3.5%(+2.50)#2,298 |
| 91. | 60305 | 6.0% | 3.6%(+2.43)#91 | 3.5%(+2.47)#2,317 |
| 92. | 60136 | 6.0% | 3.6%(+2.41)#92 | 3.5%(+2.45)#2,331 |
| 93. | 62062 | 5.9% | 3.6%(+2.36)#93 | 3.5%(+2.40)#2,380 |
| 94. | 60015 | 5.9% | 3.6%(+2.36)#94 | 3.5%(+2.40)#2,387 |
| 95. | 61725 | 5.9% | 3.6%(+2.35)#95 | 3.5%(+2.38)#2,397 |
| 96. | 62931 | 5.9% | 3.6%(+2.31)#96 | 3.5%(+2.35)#2,434 |
| 97. | 60301 | 5.9% | 3.6%(+2.30)#97 | 3.5%(+2.34)#2,444 |
| 98. | 60304 | 5.9% | 3.6%(+2.29)#98 | 3.5%(+2.33)#2,447 |
| 99. | 61256 | 5.8% | 3.6%(+2.27)#99 | 3.5%(+2.31)#2,469 |
| 100. | 60302 | 5.8% | 3.6%(+2.21)#100 | 3.5%(+2.25)#2,522 |
Common Questions
What are the Top 10 Zip Codes with the Highest Percentage of Population Employed in Computer & Mathematics in Illinois?
Top 10 Zip Codes with the Highest Percentage of Population Employed in Computer & Mathematics in Illinois are:
What zip code has the Highest Percentage of Population Employed in Computer & Mathematics in Illinois?
61478 has the Highest Percentage of Population Employed in Computer & Mathematics in Illinois with 50.0%.
What is the Percentage of Population Employed in Computer & Mathematics in the State of Illinois?
Percentage of Population Employed in Computer & Mathematics in Illinois is 3.6%.
What is the Percentage of Population Employed in Computer & Mathematics in the United States?
Percentage of Population Employed in Computer & Mathematics in the United States is 3.5%.