Zip Codes with the Highest Percentage of Households Without a Vehicle in Corpus Christi, TX
RELATED REPORTS & OPTIONS
Households without a Cars
Corpus Christi
Compare Zip Codes
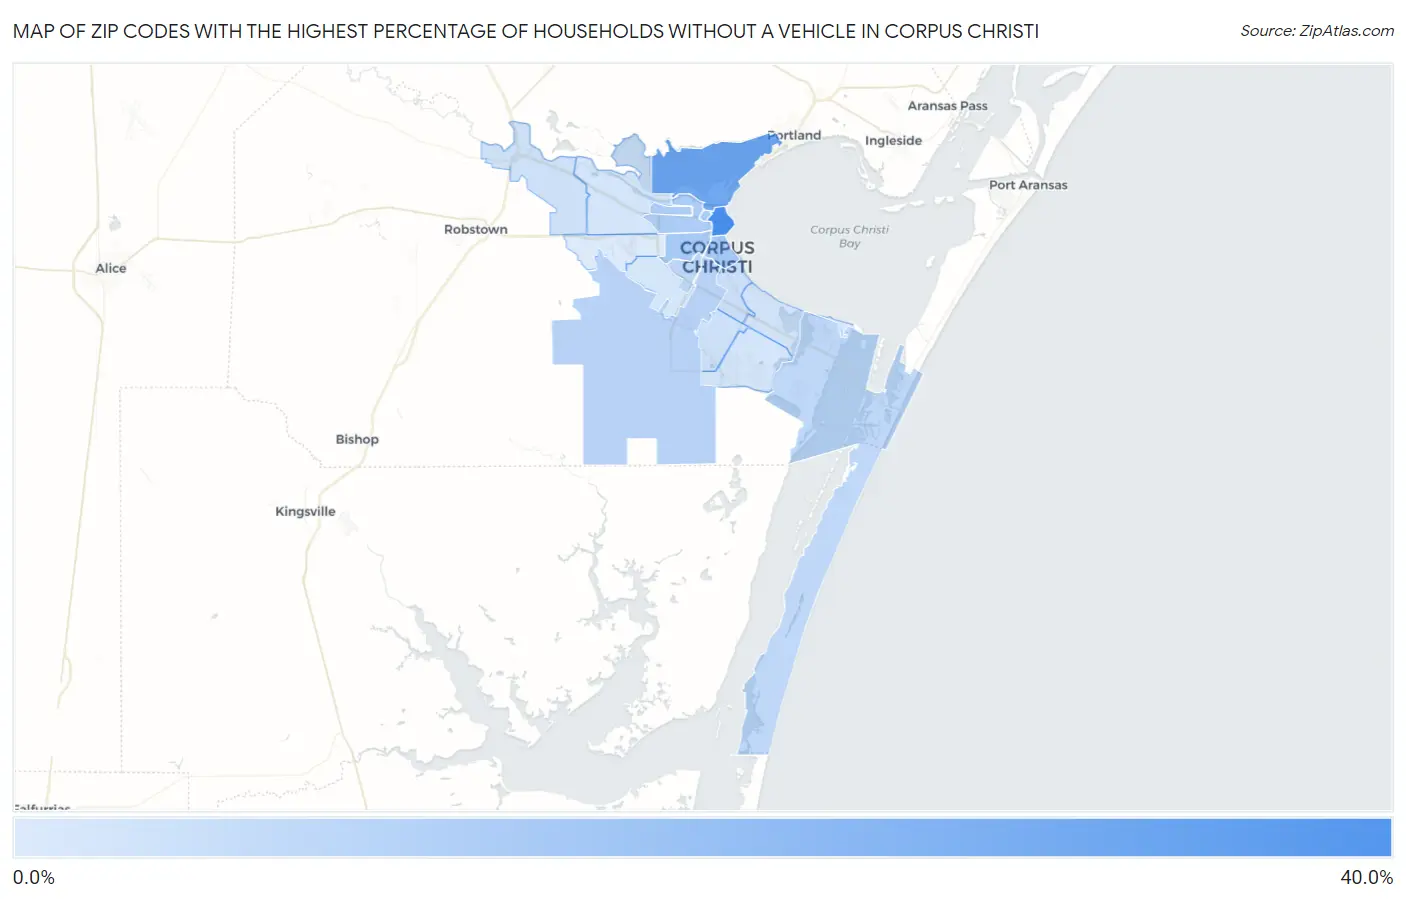
Map of Zip Codes with the Highest Percentage of Households Without a Vehicle in Corpus Christi
0.0%
40.0%
Zip Codes with the Highest Percentage of Households Without a Vehicle in Corpus Christi, TX
| Zip Code | Housholds Without a Car | vs State | vs National | |
| 1. | 78401 | 38.2% | 5.3%(+32.9)#11 | 8.3%(+29.9)#558 |
| 2. | 78402 | 27.2% | 5.3%(+21.9)#21 | 8.3%(+18.9)#929 |
| 3. | 78404 | 13.7% | 5.3%(+8.40)#103 | 8.3%(+5.40)#2,809 |
| 4. | 78405 | 13.1% | 5.3%(+7.80)#120 | 8.3%(+4.80)#3,060 |
| 5. | 78408 | 12.4% | 5.3%(+7.10)#136 | 8.3%(+4.10)#3,371 |
| 6. | 78407 | 12.3% | 5.3%(+7.00)#143 | 8.3%(+4.00)#3,442 |
| 7. | 78415 | 9.7% | 5.3%(+4.40)#235 | 8.3%(+1.40)#5,098 |
| 8. | 78416 | 8.7% | 5.3%(+3.40)#294 | 8.3%(+0.400)#6,088 |
| 9. | 78418 | 8.0% | 5.3%(+2.70)#339 | 8.3%(-0.300)#6,918 |
| 10. | 78411 | 5.6% | 5.3%(+0.300)#583 | 8.3%(-2.70)#11,383 |
| 11. | 78413 | 4.4% | 5.3%(-0.900)#773 | 8.3%(-3.90)#14,480 |
| 12. | 78410 | 4.4% | 5.3%(-0.900)#777 | 8.3%(-3.90)#14,498 |
| 13. | 78412 | 3.8% | 5.3%(-1.50)#892 | 8.3%(-4.50)#16,335 |
| 14. | 78414 | 3.4% | 5.3%(-1.90)#963 | 8.3%(-4.90)#17,609 |
| 15. | 78409 | 3.4% | 5.3%(-1.90)#982 | 8.3%(-4.90)#17,805 |
| 16. | 78417 | 3.2% | 5.3%(-2.10)#1,029 | 8.3%(-5.10)#18,473 |
| 17. | 78419 | 2.3% | 5.3%(-3.00)#1,224 | 8.3%(-6.00)#21,660 |
| 18. | 78406 | 1.6% | 5.3%(-3.70)#1,374 | 8.3%(-6.70)#23,927 |
1
Common Questions
What are the Top 10 Zip Codes with the Highest Percentage of Households Without a Vehicle in Corpus Christi, TX?
Top 10 Zip Codes with the Highest Percentage of Households Without a Vehicle in Corpus Christi, TX are:
What zip code has the Highest Percentage of Households Without a Vehicle in Corpus Christi, TX?
78401 has the Highest Percentage of Households Without a Vehicle in Corpus Christi, TX with 38.2%.
What is the Percentage of Households Without a Vehicle in Corpus Christi, TX?
Percentage of Households Without a Vehicle in Corpus Christi is 7.1%.
What is the Percentage of Households Without a Vehicle in Texas?
Percentage of Households Without a Vehicle in Texas is 5.3%.
What is the Percentage of Households Without a Vehicle in the United States?
Percentage of Households Without a Vehicle in the United States is 8.3%.