Zip Codes with the Highest Percentage of Population Employed in Office & Administration in Corpus Christi, TX
RELATED REPORTS & OPTIONS
Office & Administration
Corpus Christi
Compare Zip Codes
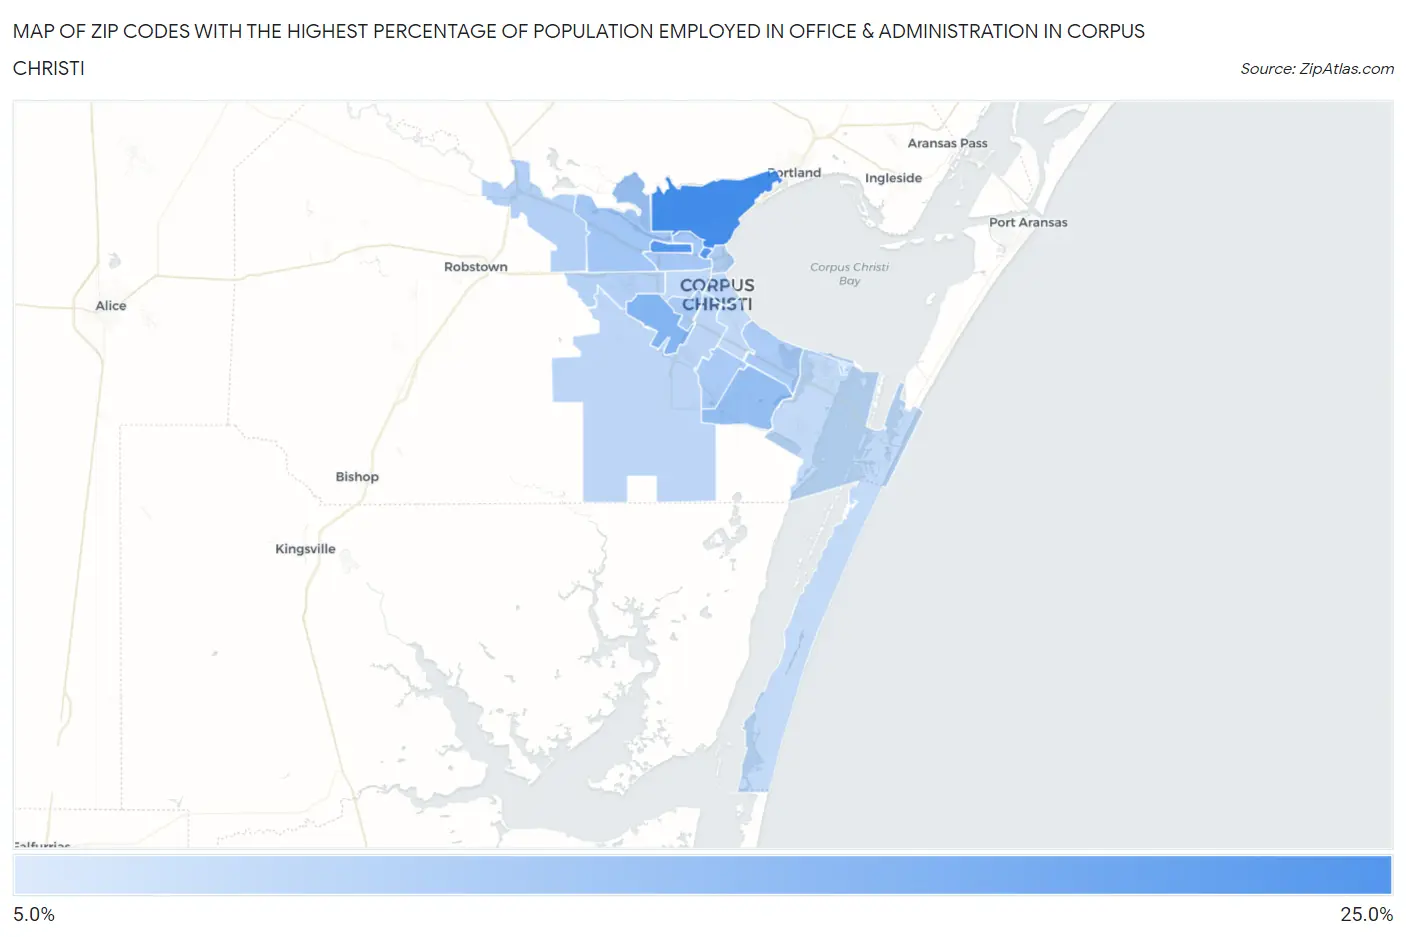
Map of Zip Codes with the Highest Percentage of Population Employed in Office & Administration in Corpus Christi
0.0%
25.0%
Zip Codes with the Highest Percentage of Population Employed in Office & Administration in Corpus Christi, TX
| Zip Code | % Employed | vs State | vs National | |
| 1. | 78402 | 25.0% | 11.0%(+14.0)#54 | 10.9%(+14.1)#918 |
| 2. | 78407 | 22.9% | 11.0%(+11.9)#72 | 10.9%(+12.0)#1,176 |
| 3. | 78417 | 16.5% | 11.0%(+5.52)#189 | 10.9%(+5.64)#3,173 |
| 4. | 78414 | 14.2% | 11.0%(+3.18)#353 | 10.9%(+3.30)#5,779 |
| 5. | 78409 | 12.3% | 11.0%(+1.30)#615 | 10.9%(+1.42)#9,910 |
| 6. | 78408 | 12.1% | 11.0%(+1.14)#638 | 10.9%(+1.26)#10,390 |
| 7. | 78416 | 11.5% | 11.0%(+0.488)#737 | 10.9%(+0.603)#12,360 |
| 8. | 78413 | 11.4% | 11.0%(+0.463)#745 | 10.9%(+0.578)#12,430 |
| 9. | 78412 | 11.1% | 11.0%(+0.151)#800 | 10.9%(+0.267)#13,444 |
| 10. | 78401 | 10.9% | 11.0%(-0.093)#855 | 10.9%(+0.022)#14,260 |
| 11. | 78410 | 10.2% | 11.0%(-0.780)#998 | 10.9%(-0.665)#16,507 |
| 12. | 78406 | 9.9% | 11.0%(-1.12)#1,073 | 10.9%(-1.00)#17,600 |
| 13. | 78415 | 9.1% | 11.0%(-1.86)#1,206 | 10.9%(-1.75)#19,930 |
| 14. | 78404 | 8.7% | 11.0%(-2.31)#1,270 | 10.9%(-2.19)#21,262 |
| 15. | 78411 | 8.6% | 11.0%(-2.37)#1,280 | 10.9%(-2.26)#21,439 |
| 16. | 78405 | 8.5% | 11.0%(-2.49)#1,307 | 10.9%(-2.38)#21,753 |
| 17. | 78418 | 8.2% | 11.0%(-2.81)#1,353 | 10.9%(-2.70)#22,638 |
| 18. | 78419 | 5.0% | 11.0%(-5.93)#1,636 | 10.9%(-5.81)#28,068 |
1
Common Questions
What are the Top 10 Zip Codes with the Highest Percentage of Population Employed in Office & Administration in Corpus Christi, TX?
Top 10 Zip Codes with the Highest Percentage of Population Employed in Office & Administration in Corpus Christi, TX are:
What zip code has the Highest Percentage of Population Employed in Office & Administration in Corpus Christi, TX?
78402 has the Highest Percentage of Population Employed in Office & Administration in Corpus Christi, TX with 25.0%.
What is the Percentage of Population Employed in Office & Administration in Corpus Christi, TX?
Percentage of Population Employed in Office & Administration in Corpus Christi is 10.8%.
What is the Percentage of Population Employed in Office & Administration in Texas?
Percentage of Population Employed in Office & Administration in Texas is 11.0%.
What is the Percentage of Population Employed in Office & Administration in the United States?
Percentage of Population Employed in Office & Administration in the United States is 10.9%.