Zip Codes with the Highest Percentage of Population Employed in Community & Social Service in Corpus Christi, TX
RELATED REPORTS & OPTIONS
Community & Social Service
Corpus Christi
Compare Zip Codes
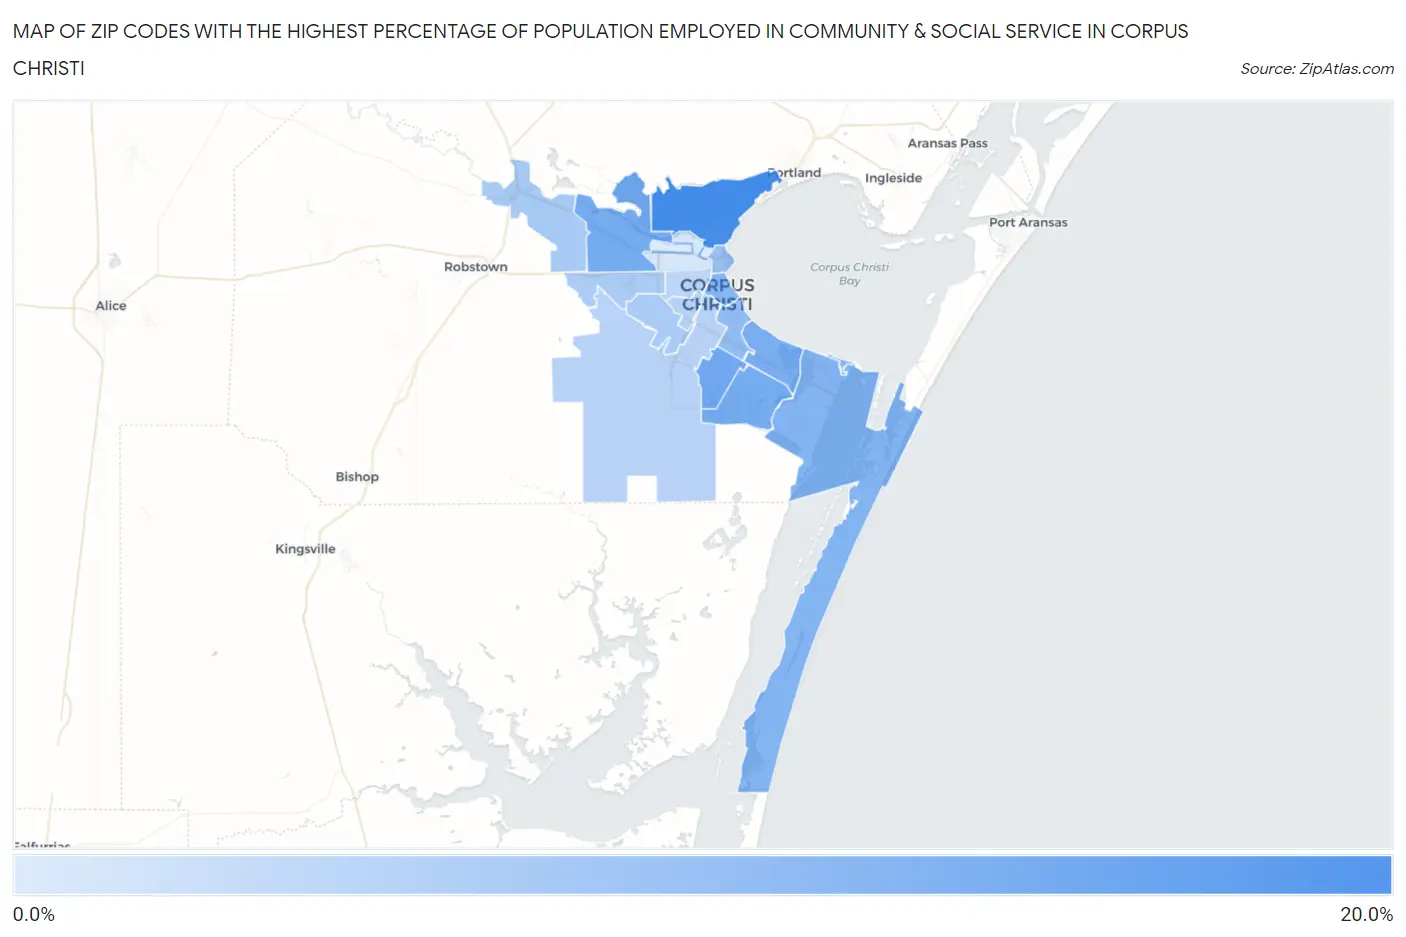
Map of Zip Codes with the Highest Percentage of Population Employed in Community & Social Service in Corpus Christi
0.0%
20.0%
Zip Codes with the Highest Percentage of Population Employed in Community & Social Service in Corpus Christi, TX
| Zip Code | % Employed | vs State | vs National | |
| 1. | 78402 | 18.3% | 10.5%(+7.77)#129 | 11.2%(+7.06)#2,685 |
| 2. | 78413 | 13.8% | 10.5%(+3.27)#328 | 11.2%(+2.56)#6,382 |
| 3. | 78414 | 13.2% | 10.5%(+2.73)#367 | 11.2%(+2.02)#7,186 |
| 4. | 78409 | 13.0% | 10.5%(+2.54)#384 | 11.2%(+1.83)#7,475 |
| 5. | 78412 | 12.6% | 10.5%(+2.10)#441 | 11.2%(+1.39)#8,234 |
| 6. | 78418 | 11.6% | 10.5%(+1.11)#571 | 11.2%(+0.401)#10,196 |
| 7. | 78404 | 11.1% | 10.5%(+0.617)#636 | 11.2%(-0.094)#11,315 |
| 8. | 78419 | 10.9% | 10.5%(+0.421)#675 | 11.2%(-0.290)#11,834 |
| 9. | 78411 | 10.1% | 10.5%(-0.425)#813 | 11.2%(-1.14)#13,933 |
| 10. | 78401 | 9.5% | 10.5%(-0.964)#904 | 11.2%(-1.67)#15,298 |
| 11. | 78410 | 7.7% | 10.5%(-2.81)#1,227 | 11.2%(-3.52)#20,369 |
| 12. | 78417 | 7.5% | 10.5%(-3.02)#1,259 | 11.2%(-3.73)#20,930 |
| 13. | 78406 | 7.3% | 10.5%(-3.20)#1,292 | 11.2%(-3.91)#21,408 |
| 14. | 78416 | 6.1% | 10.5%(-4.39)#1,437 | 11.2%(-5.10)#24,150 |
| 15. | 78415 | 6.1% | 10.5%(-4.40)#1,442 | 11.2%(-5.11)#24,174 |
| 16. | 78405 | 5.7% | 10.5%(-4.83)#1,483 | 11.2%(-5.54)#25,023 |
| 17. | 78408 | 3.3% | 10.5%(-7.24)#1,676 | 11.2%(-7.95)#28,312 |
| 18. | 78407 | 2.5% | 10.5%(-8.02)#1,702 | 11.2%(-8.73)#28,925 |
1
Common Questions
What are the Top 10 Zip Codes with the Highest Percentage of Population Employed in Community & Social Service in Corpus Christi, TX?
Top 10 Zip Codes with the Highest Percentage of Population Employed in Community & Social Service in Corpus Christi, TX are:
What zip code has the Highest Percentage of Population Employed in Community & Social Service in Corpus Christi, TX?
78402 has the Highest Percentage of Population Employed in Community & Social Service in Corpus Christi, TX with 18.3%.
What is the Percentage of Population Employed in Community & Social Service in Corpus Christi, TX?
Percentage of Population Employed in Community & Social Service in Corpus Christi is 10.3%.
What is the Percentage of Population Employed in Community & Social Service in Texas?
Percentage of Population Employed in Community & Social Service in Texas is 10.5%.
What is the Percentage of Population Employed in Community & Social Service in the United States?
Percentage of Population Employed in Community & Social Service in the United States is 11.2%.