Zip Codes with the Highest Percentage of Population Taking Taxi / Cab to Work in Corpus Christi, TX
RELATED REPORTS & OPTIONS
Taxi / Cab
Corpus Christi
Compare Zip Codes
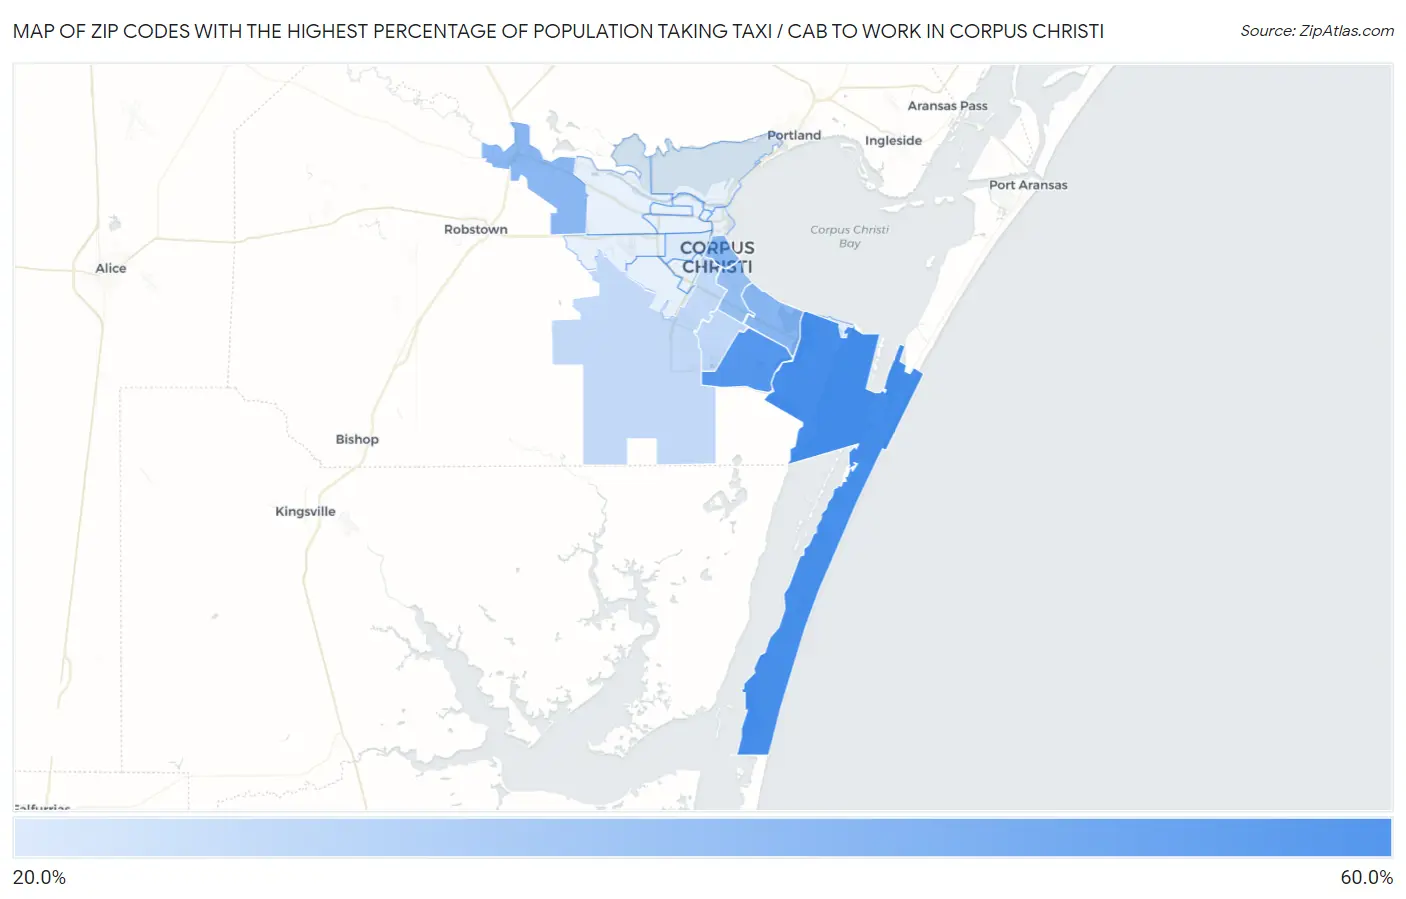
Map of Zip Codes with the Highest Percentage of Population Taking Taxi / Cab to Work in Corpus Christi
0.0%
60.0%
Zip Codes with the Highest Percentage of Population Taking Taxi / Cab to Work in Corpus Christi, TX
| Zip Code | % Take Taxi / Cab | vs State | vs National | |
| 1. | 78418 | 56.9% | 36.9%(+20.0)#61 | 38.2%(+18.7)#1,182 |
| 2. | 78414 | 53.3% | 36.9%(+16.4)#108 | 38.2%(+15.1)#2,020 |
| 3. | 78404 | 42.0% | 36.9%(+5.10)#347 | 38.2%(+3.80)#5,738 |
| 4. | 78412 | 41.8% | 36.9%(+4.90)#352 | 38.2%(+3.60)#5,788 |
| 5. | 78410 | 41.5% | 36.9%(+4.60)#359 | 38.2%(+3.30)#5,939 |
| 6. | 78411 | 38.6% | 36.9%(+1.70)#450 | 38.2%(+0.400)#7,226 |
| 7. | 78413 | 30.0% | 36.9%(-6.90)#688 | 38.2%(-8.20)#10,900 |
| 8. | 78415 | 29.5% | 36.9%(-7.40)#697 | 38.2%(-8.70)#11,091 |
| 9. | 78405 | 24.0% | 36.9%(-12.9)#825 | 38.2%(-14.2)#12,443 |
1
Common Questions
What are the Top 10 Zip Codes with the Highest Percentage of Population Taking Taxi / Cab to Work in Corpus Christi, TX?
Top 10 Zip Codes with the Highest Percentage of Population Taking Taxi / Cab to Work in Corpus Christi, TX are:
What zip code has the Highest Percentage of Population Taking Taxi / Cab to Work in Corpus Christi, TX?
78418 has the Highest Percentage of Population Taking Taxi / Cab to Work in Corpus Christi, TX with 56.9%.
What is the Percentage of Population Taking Taxi / Cab to Work in Corpus Christi, TX?
Percentage of Population Taking Taxi / Cab to Work in Corpus Christi is 45.5%.
What is the Percentage of Population Taking Taxi / Cab to Work in Texas?
Percentage of Population Taking Taxi / Cab to Work in Texas is 36.9%.
What is the Percentage of Population Taking Taxi / Cab to Work in the United States?
Percentage of Population Taking Taxi / Cab to Work in the United States is 38.2%.