Zip Codes with the Highest Percentage of Population Employed in Life, Physical & Social Science in Corpus Christi, TX
RELATED REPORTS & OPTIONS
Life, Physical & Social Science
Corpus Christi
Compare Zip Codes
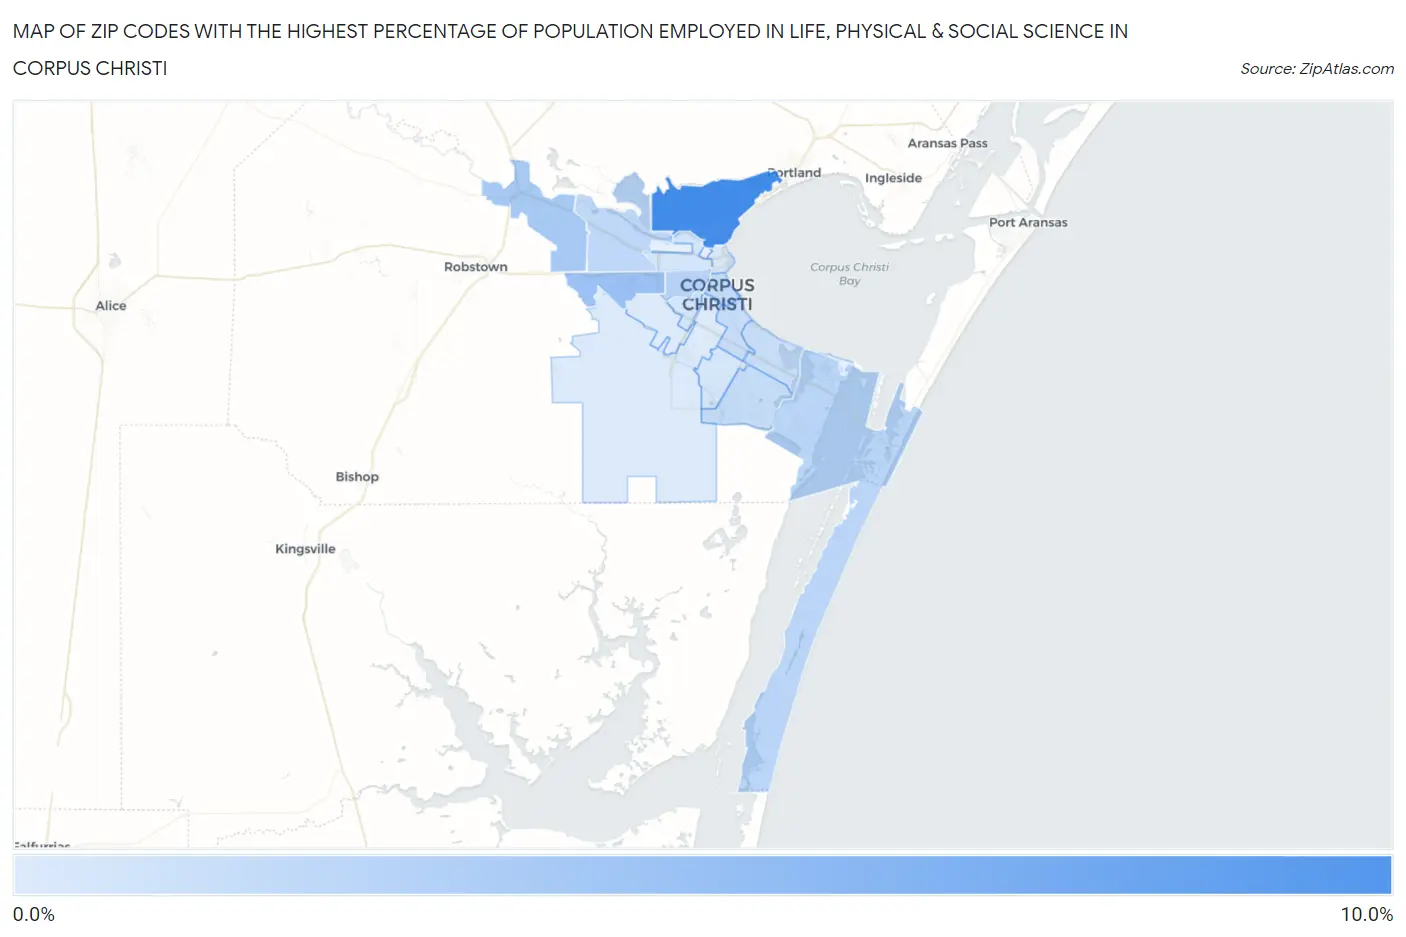
Map of Zip Codes with the Highest Percentage of Population Employed in Life, Physical & Social Science in Corpus Christi
0.0%
10.0%
Zip Codes with the Highest Percentage of Population Employed in Life, Physical & Social Science in Corpus Christi, TX
| Zip Code | % Employed | vs State | vs National | |
| 1. | 78402 | 8.7% | 0.84%(+7.81)#10 | 1.1%(+7.56)#272 |
| 2. | 78406 | 3.8% | 0.84%(+2.99)#43 | 1.1%(+2.74)#1,242 |
| 3. | 78410 | 3.2% | 0.84%(+2.33)#60 | 1.1%(+2.08)#1,689 |
| 4. | 78405 | 2.3% | 0.84%(+1.51)#97 | 1.1%(+1.26)#2,846 |
| 5. | 78418 | 2.2% | 0.84%(+1.39)#109 | 1.1%(+1.14)#3,110 |
| 6. | 78409 | 2.0% | 0.84%(+1.13)#128 | 1.1%(+0.883)#3,760 |
| 7. | 78414 | 1.6% | 0.84%(+0.729)#206 | 1.1%(+0.481)#5,287 |
| 8. | 78404 | 1.6% | 0.84%(+0.724)#208 | 1.1%(+0.475)#5,310 |
| 9. | 78411 | 1.4% | 0.84%(+0.569)#247 | 1.1%(+0.320)#6,126 |
| 10. | 78412 | 1.4% | 0.84%(+0.550)#255 | 1.1%(+0.301)#6,243 |
| 11. | 78416 | 0.82% | 0.84%(-0.027)#502 | 1.1%(-0.275)#10,837 |
| 12. | 78408 | 0.80% | 0.84%(-0.040)#511 | 1.1%(-0.289)#10,975 |
| 13. | 78413 | 0.73% | 0.84%(-0.112)#553 | 1.1%(-0.361)#11,709 |
| 14. | 78401 | 0.42% | 0.84%(-0.424)#809 | 1.1%(-0.673)#15,524 |
| 15. | 78415 | 0.36% | 0.84%(-0.481)#862 | 1.1%(-0.729)#16,255 |
| 16. | 78417 | 0.31% | 0.84%(-0.529)#903 | 1.1%(-0.777)#16,897 |
1
Common Questions
What are the Top 10 Zip Codes with the Highest Percentage of Population Employed in Life, Physical & Social Science in Corpus Christi, TX?
Top 10 Zip Codes with the Highest Percentage of Population Employed in Life, Physical & Social Science in Corpus Christi, TX are:
What zip code has the Highest Percentage of Population Employed in Life, Physical & Social Science in Corpus Christi, TX?
78402 has the Highest Percentage of Population Employed in Life, Physical & Social Science in Corpus Christi, TX with 8.7%.
What is the Percentage of Population Employed in Life, Physical & Social Science in Corpus Christi, TX?
Percentage of Population Employed in Life, Physical & Social Science in Corpus Christi is 1.5%.
What is the Percentage of Population Employed in Life, Physical & Social Science in Texas?
Percentage of Population Employed in Life, Physical & Social Science in Texas is 0.84%.
What is the Percentage of Population Employed in Life, Physical & Social Science in the United States?
Percentage of Population Employed in Life, Physical & Social Science in the United States is 1.1%.