Zip Codes with the Highest Percentage of Population with a Degree in Liberal Arts and History in Lorain, OH
RELATED REPORTS & OPTIONS
Liberal Arts and History
Lorain
Compare Zip Codes
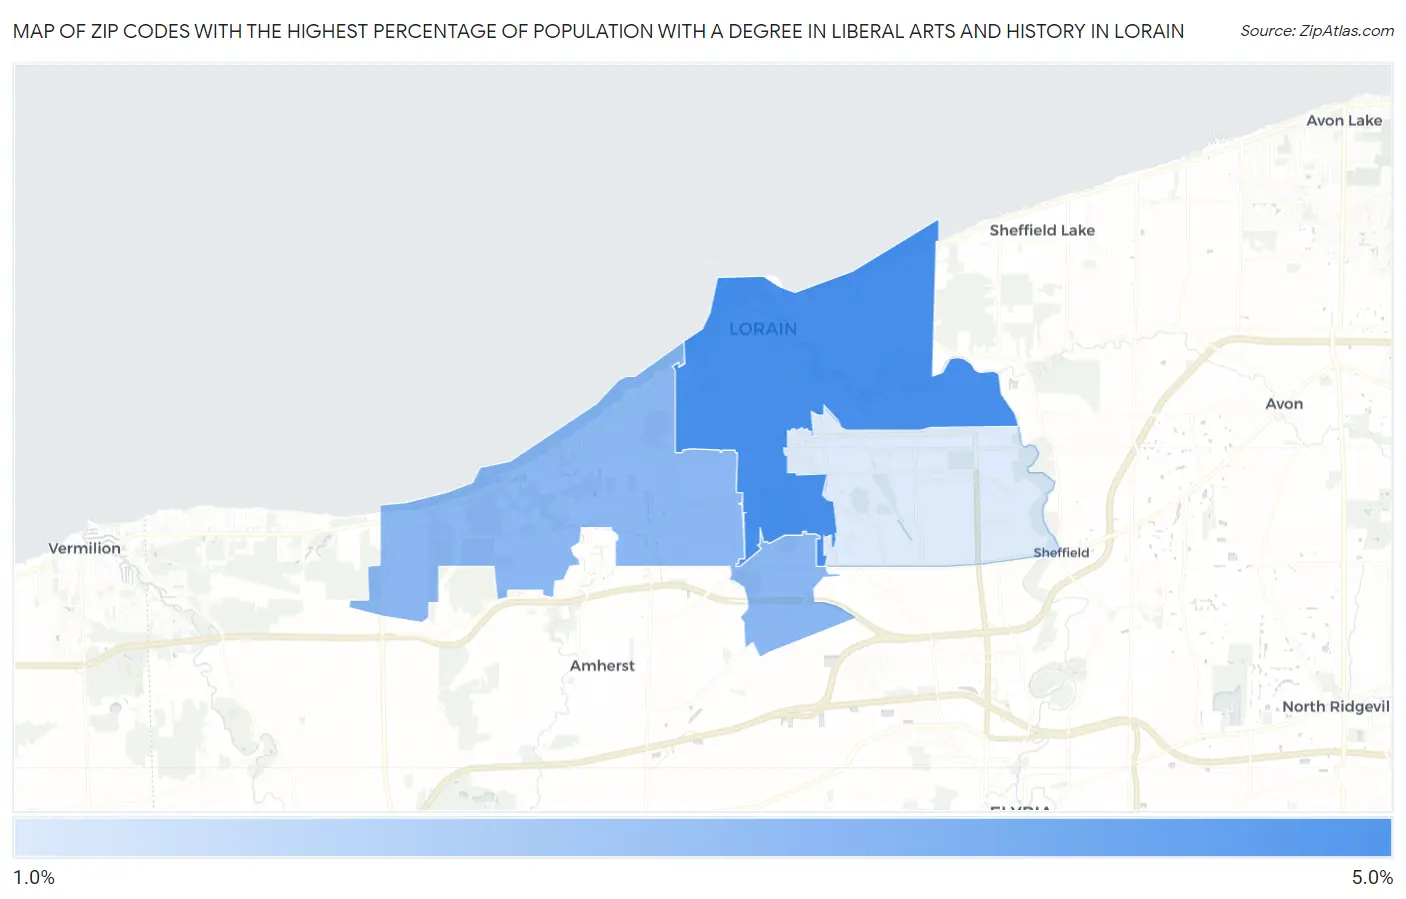
Map of Zip Codes with the Highest Percentage of Population with a Degree in Liberal Arts and History in Lorain
0.0%
5.0%
Zip Codes with the Highest Percentage of Population with a Degree in Liberal Arts and History in Lorain, OH
| Zip Code | % Graduates | vs State | vs National | |
| 1. | 44052 | 5.0% | 4.2%(+0.769)#347 | 4.9%(+0.095)#11,447 |
| 2. | 44053 | 3.5% | 4.2%(-0.744)#536 | 4.9%(-1.42)#16,772 |
| 3. | 44055 | 1.6% | 4.2%(-2.59)#790 | 4.9%(-3.27)#22,282 |
1
Common Questions
What are the Top Zip Codes with the Highest Percentage of Population with a Degree in Liberal Arts and History in Lorain, OH?
Top Zip Codes with the Highest Percentage of Population with a Degree in Liberal Arts and History in Lorain, OH are:
What zip code has the Highest Percentage of Population with a Degree in Liberal Arts and History in Lorain, OH?
44052 has the Highest Percentage of Population with a Degree in Liberal Arts and History in Lorain, OH with 5.0%.
What is the Percentage of Population with a Degree in Liberal Arts and History in Lorain, OH?
Percentage of Population with a Degree in Liberal Arts and History in Lorain is 3.8%.
What is the Percentage of Population with a Degree in Liberal Arts and History in Ohio?
Percentage of Population with a Degree in Liberal Arts and History in Ohio is 4.2%.
What is the Percentage of Population with a Degree in Liberal Arts and History in the United States?
Percentage of Population with a Degree in Liberal Arts and History in the United States is 4.9%.