Zip Codes with the Highest Percentage of Population with a Degree in Liberal Arts and History in Mansfield, OH
RELATED REPORTS & OPTIONS
Liberal Arts and History
Mansfield
Compare Zip Codes
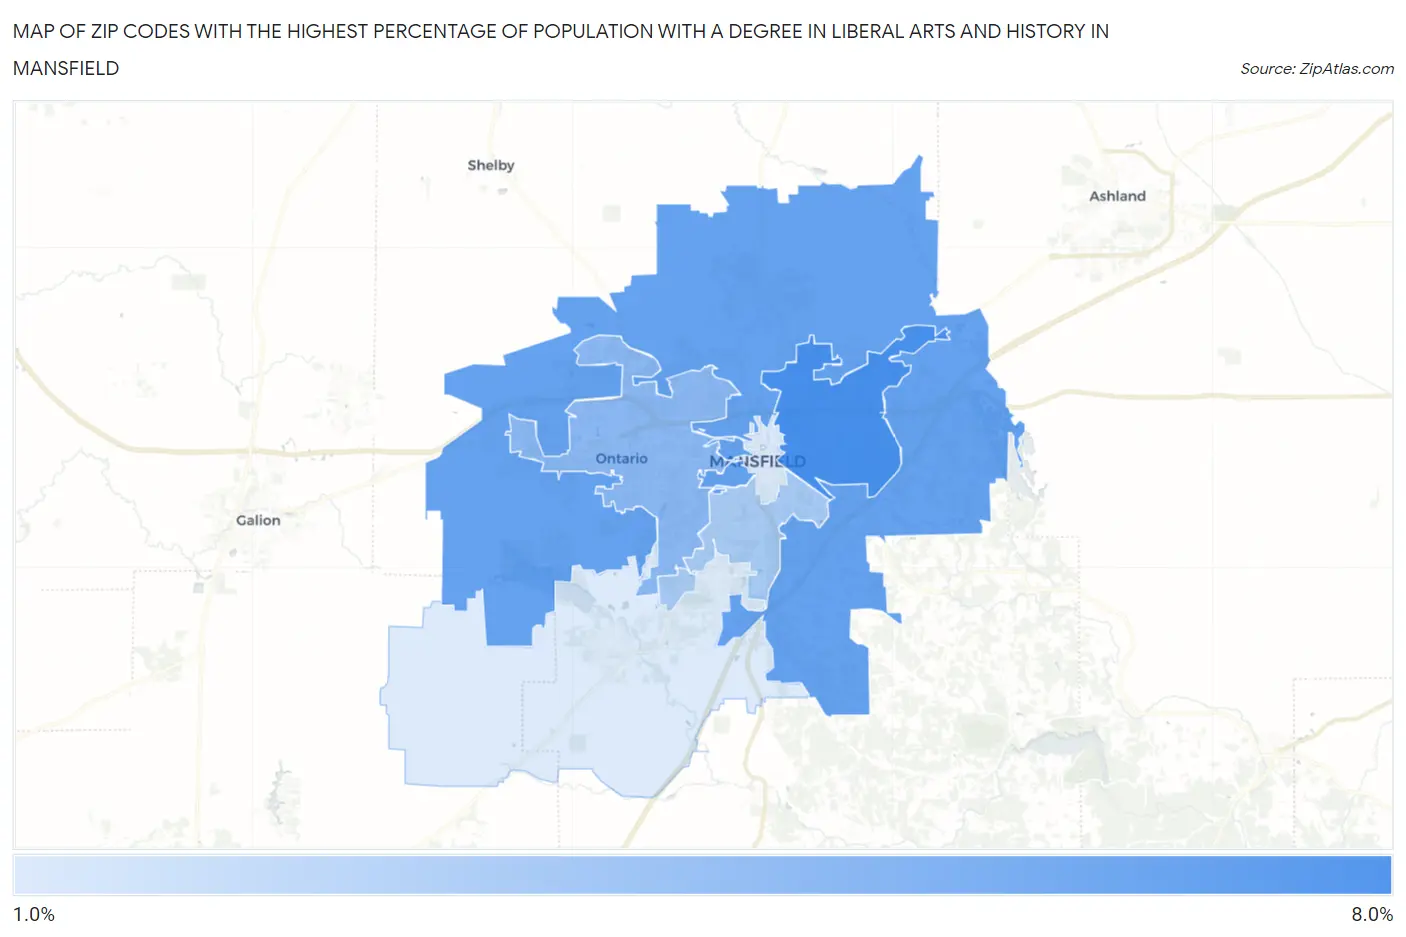
Map of Zip Codes with the Highest Percentage of Population with a Degree in Liberal Arts and History in Mansfield
0.0%
8.0%
Zip Codes with the Highest Percentage of Population with a Degree in Liberal Arts and History in Mansfield, OH
| Zip Code | % Graduates | vs State | vs National | |
| 1. | 44905 | 7.2% | 4.2%(+2.97)#171 | 4.9%(+2.29)#6,108 |
| 2. | 44903 | 6.0% | 4.2%(+1.80)#247 | 4.9%(+1.13)#8,527 |
| 3. | 44906 | 4.7% | 4.2%(+0.454)#380 | 4.9%(-0.220)#12,473 |
| 4. | 44907 | 3.5% | 4.2%(-0.657)#515 | 4.9%(-1.33)#16,438 |
| 5. | 44902 | 1.7% | 4.2%(-2.49)#773 | 4.9%(-3.16)#22,058 |
| 6. | 44904 | 1.6% | 4.2%(-2.57)#788 | 4.9%(-3.25)#22,240 |
1
Common Questions
What are the Top 5 Zip Codes with the Highest Percentage of Population with a Degree in Liberal Arts and History in Mansfield, OH?
Top 5 Zip Codes with the Highest Percentage of Population with a Degree in Liberal Arts and History in Mansfield, OH are:
What zip code has the Highest Percentage of Population with a Degree in Liberal Arts and History in Mansfield, OH?
44905 has the Highest Percentage of Population with a Degree in Liberal Arts and History in Mansfield, OH with 7.2%.
What is the Percentage of Population with a Degree in Liberal Arts and History in Mansfield, OH?
Percentage of Population with a Degree in Liberal Arts and History in Mansfield is 3.7%.
What is the Percentage of Population with a Degree in Liberal Arts and History in Ohio?
Percentage of Population with a Degree in Liberal Arts and History in Ohio is 4.2%.
What is the Percentage of Population with a Degree in Liberal Arts and History in the United States?
Percentage of Population with a Degree in Liberal Arts and History in the United States is 4.9%.