Zip Codes with the Highest Percentage of Population with a Degree in Liberal Arts and History in Pennsylvania
RELATED REPORTS & OPTIONS
Liberal Arts and History
Pennsylvania
Compare Zip Codes
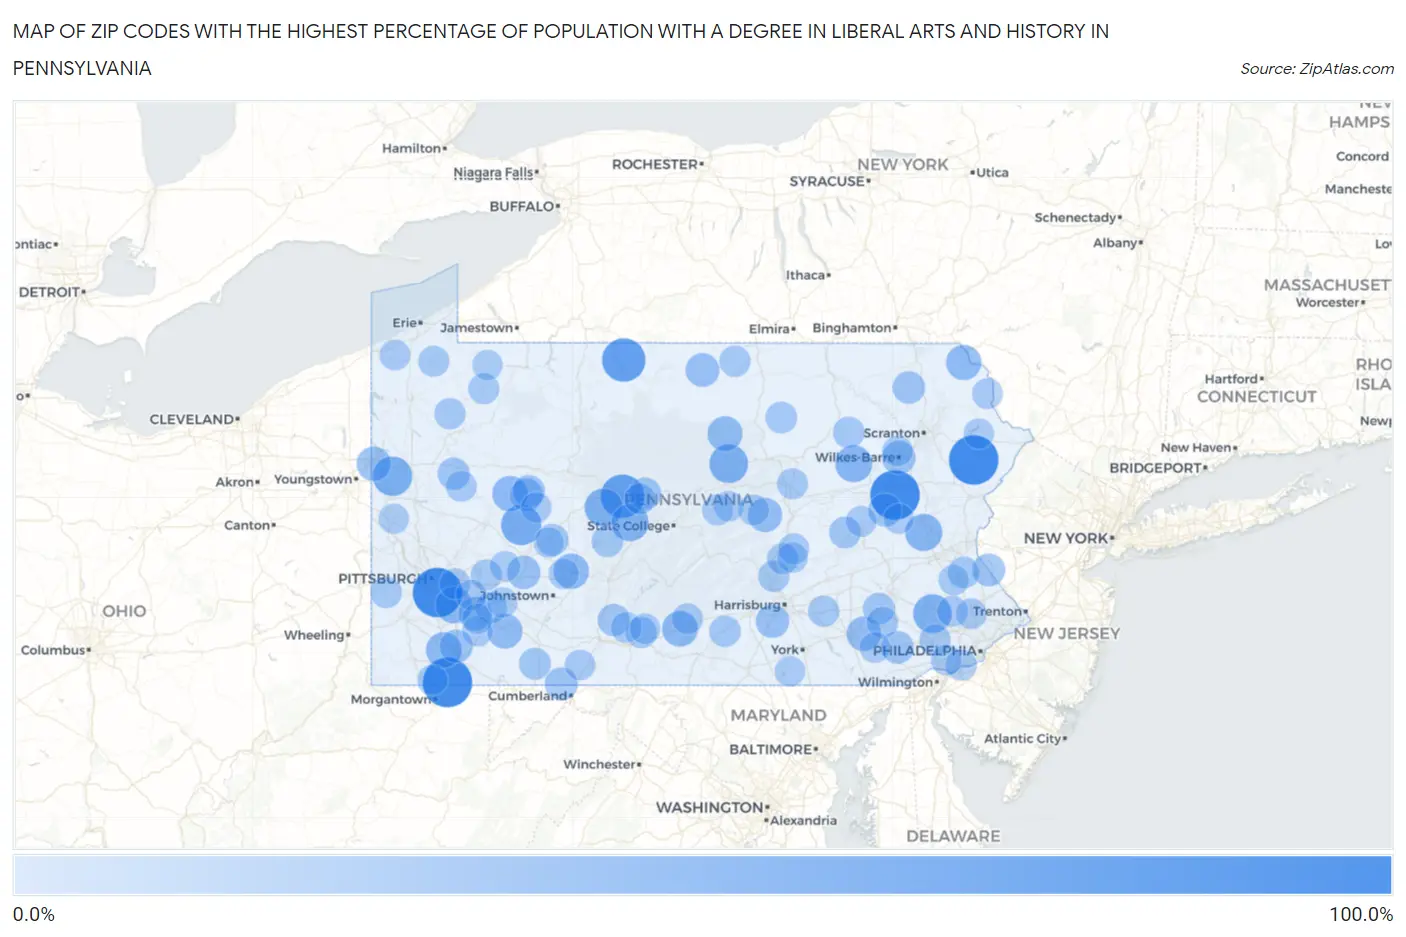
Map of Zip Codes with the Highest Percentage of Population with a Degree in Liberal Arts and History in Pennsylvania
0.0%
100.0%
Zip Codes with the Highest Percentage of Population with a Degree in Liberal Arts and History in Pennsylvania
| Zip Code | % Graduates | vs State | vs National | |
| 1. | 15451 | 100.0% | 4.6%(+95.4)#1 | 4.9%(+95.1)#10 |
| 2. | 18221 | 100.0% | 4.6%(+95.4)#2 | 4.9%(+95.1)#17 |
| 3. | 18357 | 100.0% | 4.6%(+95.4)#3 | 4.9%(+95.1)#41 |
| 4. | 15123 | 100.0% | 4.6%(+95.4)#4 | 4.9%(+95.1)#51 |
| 5. | 16825 | 72.6% | 4.6%(+68.0)#5 | 4.9%(+67.7)#75 |
| 6. | 16750 | 71.4% | 4.6%(+66.8)#6 | 4.9%(+66.6)#76 |
| 7. | 16211 | 57.1% | 4.6%(+52.5)#7 | 4.9%(+52.3)#113 |
| 8. | 16172 | 53.3% | 4.6%(+48.7)#8 | 4.9%(+48.5)#127 |
| 9. | 19457 | 50.0% | 4.6%(+45.4)#9 | 4.9%(+45.1)#158 |
| 10. | 17779 | 50.0% | 4.6%(+45.4)#10 | 4.9%(+45.1)#159 |
| 11. | 16863 | 47.1% | 4.6%(+42.4)#11 | 4.9%(+42.2)#188 |
| 12. | 16677 | 43.5% | 4.6%(+38.9)#12 | 4.9%(+38.6)#213 |
| 13. | 18079 | 42.7% | 4.6%(+38.1)#13 | 4.9%(+37.9)#226 |
| 14. | 18622 | 42.1% | 4.6%(+37.5)#14 | 4.9%(+37.2)#232 |
| 15. | 15018 | 40.6% | 4.6%(+36.0)#15 | 4.9%(+35.8)#244 |
| 16. | 17271 | 36.9% | 4.6%(+32.3)#16 | 4.9%(+32.1)#280 |
| 17. | 15475 | 36.5% | 4.6%(+31.9)#17 | 4.9%(+31.6)#284 |
| 18. | 16245 | 36.0% | 4.6%(+31.4)#18 | 4.9%(+31.1)#297 |
| 19. | 15948 | 35.3% | 4.6%(+30.7)#19 | 4.9%(+30.4)#311 |
| 20. | 18437 | 34.6% | 4.6%(+30.0)#20 | 4.9%(+29.7)#322 |
| 21. | 15646 | 33.3% | 4.6%(+28.7)#21 | 4.9%(+28.5)#355 |
| 22. | 17739 | 33.3% | 4.6%(+28.7)#22 | 4.9%(+28.5)#363 |
| 23. | 17505 | 31.3% | 4.6%(+26.7)#23 | 4.9%(+26.4)#395 |
| 24. | 16161 | 30.4% | 4.6%(+25.8)#24 | 4.9%(+25.5)#411 |
| 25. | 17862 | 30.2% | 4.6%(+25.6)#25 | 4.9%(+25.4)#414 |
| 26. | 16943 | 27.8% | 4.6%(+23.2)#26 | 4.9%(+22.9)#472 |
| 27. | 18701 | 27.4% | 4.6%(+22.8)#27 | 4.9%(+22.5)#485 |
| 28. | 15750 | 26.3% | 4.6%(+21.7)#28 | 4.9%(+21.4)#522 |
| 29. | 17027 | 26.1% | 4.6%(+21.5)#29 | 4.9%(+21.2)#532 |
| 30. | 15480 | 25.7% | 4.6%(+21.1)#30 | 4.9%(+20.8)#548 |
| 31. | 18231 | 25.5% | 4.6%(+20.9)#31 | 4.9%(+20.7)#553 |
| 32. | 15639 | 25.4% | 4.6%(+20.8)#32 | 4.9%(+20.5)#558 |
| 33. | 15770 | 25.0% | 4.6%(+20.4)#33 | 4.9%(+20.1)#588 |
| 34. | 18920 | 23.8% | 4.6%(+19.2)#34 | 4.9%(+18.9)#640 |
| 35. | 15564 | 23.5% | 4.6%(+18.9)#35 | 4.9%(+18.7)#654 |
| 36. | 19369 | 23.2% | 4.6%(+18.6)#36 | 4.9%(+18.3)#670 |
| 37. | 18824 | 22.9% | 4.6%(+18.2)#37 | 4.9%(+18.0)#685 |
| 38. | 15784 | 22.2% | 4.6%(+17.6)#38 | 4.9%(+17.4)#731 |
| 39. | 16839 | 22.1% | 4.6%(+17.4)#39 | 4.9%(+17.2)#736 |
| 40. | 16030 | 21.4% | 4.6%(+16.8)#40 | 4.9%(+16.6)#772 |
| 41. | 16659 | 21.4% | 4.6%(+16.8)#41 | 4.9%(+16.6)#774 |
| 42. | 15729 | 20.8% | 4.6%(+16.2)#42 | 4.9%(+15.9)#808 |
| 43. | 19501 | 19.7% | 4.6%(+15.0)#43 | 4.9%(+14.8)#889 |
| 44. | 15542 | 19.6% | 4.6%(+15.0)#44 | 4.9%(+14.7)#893 |
| 45. | 17921 | 19.0% | 4.6%(+14.4)#45 | 4.9%(+14.1)#934 |
| 46. | 18955 | 18.8% | 4.6%(+14.2)#46 | 4.9%(+14.0)#949 |
| 47. | 17763 | 18.8% | 4.6%(+14.1)#47 | 4.9%(+13.9)#957 |
| 48. | 16639 | 18.4% | 4.6%(+13.8)#48 | 4.9%(+13.6)#983 |
| 49. | 15676 | 18.3% | 4.6%(+13.7)#49 | 4.9%(+13.4)#996 |
| 50. | 18628 | 17.9% | 4.6%(+13.3)#50 | 4.9%(+13.1)#1,042 |
| 51. | 17266 | 17.8% | 4.6%(+13.2)#51 | 4.9%(+12.9)#1,060 |
| 52. | 16691 | 17.0% | 4.6%(+12.4)#52 | 4.9%(+12.1)#1,132 |
| 53. | 15004 | 16.9% | 4.6%(+12.3)#53 | 4.9%(+12.1)#1,138 |
| 54. | 17519 | 16.9% | 4.6%(+12.3)#54 | 4.9%(+12.0)#1,142 |
| 55. | 17041 | 16.9% | 4.6%(+12.3)#55 | 4.9%(+12.0)#1,144 |
| 56. | 19345 | 16.8% | 4.6%(+12.2)#56 | 4.9%(+12.0)#1,145 |
| 57. | 16935 | 16.8% | 4.6%(+12.2)#57 | 4.9%(+12.0)#1,147 |
| 58. | 17069 | 16.7% | 4.6%(+12.1)#58 | 4.9%(+11.8)#1,167 |
| 59. | 19022 | 16.4% | 4.6%(+11.8)#59 | 4.9%(+11.5)#1,207 |
| 60. | 16317 | 16.4% | 4.6%(+11.8)#60 | 4.9%(+11.5)#1,208 |
| 61. | 16879 | 16.1% | 4.6%(+11.5)#61 | 4.9%(+11.3)#1,239 |
| 62. | 17061 | 16.0% | 4.6%(+11.4)#62 | 4.9%(+11.2)#1,255 |
| 63. | 15684 | 16.0% | 4.6%(+11.4)#63 | 4.9%(+11.1)#1,263 |
| 64. | 17749 | 15.8% | 4.6%(+11.2)#64 | 4.9%(+10.9)#1,290 |
| 65. | 16420 | 15.4% | 4.6%(+10.8)#65 | 4.9%(+10.5)#1,349 |
| 66. | 16427 | 15.4% | 4.6%(+10.8)#66 | 4.9%(+10.5)#1,357 |
| 67. | 19474 | 15.3% | 4.6%(+10.7)#67 | 4.9%(+10.5)#1,364 |
| 68. | 17220 | 15.2% | 4.6%(+10.6)#68 | 4.9%(+10.3)#1,383 |
| 69. | 15140 | 15.2% | 4.6%(+10.6)#69 | 4.9%(+10.3)#1,388 |
| 70. | 17829 | 15.2% | 4.6%(+10.5)#70 | 4.9%(+10.3)#1,394 |
| 71. | 17080 | 15.0% | 4.6%(+10.4)#71 | 4.9%(+10.1)#1,424 |
| 72. | 16022 | 15.0% | 4.6%(+10.4)#72 | 4.9%(+10.1)#1,426 |
| 73. | 15675 | 14.8% | 4.6%(+10.2)#73 | 4.9%(+9.94)#1,456 |
| 74. | 16410 | 14.7% | 4.6%(+10.1)#74 | 4.9%(+9.83)#1,477 |
| 75. | 16854 | 14.6% | 4.6%(+10.0)#75 | 4.9%(+9.74)#1,492 |
| 76. | 17562 | 14.6% | 4.6%(+9.99)#76 | 4.9%(+9.73)#1,497 |
| 77. | 16650 | 14.6% | 4.6%(+9.96)#77 | 4.9%(+9.70)#1,507 |
| 78. | 18443 | 14.5% | 4.6%(+9.89)#78 | 4.9%(+9.63)#1,523 |
| 79. | 19436 | 14.5% | 4.6%(+9.89)#79 | 4.9%(+9.62)#1,525 |
| 80. | 17976 | 14.3% | 4.6%(+9.70)#80 | 4.9%(+9.44)#1,554 |
| 81. | 15744 | 14.3% | 4.6%(+9.68)#81 | 4.9%(+9.41)#1,591 |
| 82. | 17023 | 14.0% | 4.6%(+9.36)#82 | 4.9%(+9.10)#1,644 |
| 83. | 19017 | 14.0% | 4.6%(+9.35)#83 | 4.9%(+9.09)#1,647 |
| 84. | 15534 | 13.8% | 4.6%(+9.24)#84 | 4.9%(+8.97)#1,672 |
| 85. | 16689 | 13.8% | 4.6%(+9.18)#85 | 4.9%(+8.92)#1,690 |
| 86. | 16820 | 13.6% | 4.6%(+9.03)#86 | 4.9%(+8.76)#1,725 |
| 87. | 15631 | 13.6% | 4.6%(+9.03)#87 | 4.9%(+8.76)#1,728 |
| 88. | 18935 | 13.4% | 4.6%(+8.84)#88 | 4.9%(+8.57)#1,786 |
| 89. | 15315 | 13.4% | 4.6%(+8.82)#89 | 4.9%(+8.56)#1,791 |
| 90. | 15943 | 13.4% | 4.6%(+8.74)#90 | 4.9%(+8.48)#1,811 |
| 91. | 15725 | 13.3% | 4.6%(+8.64)#91 | 4.9%(+8.38)#1,837 |
| 92. | 18232 | 13.1% | 4.6%(+8.47)#92 | 4.9%(+8.21)#1,883 |
| 93. | 17311 | 13.0% | 4.6%(+8.43)#93 | 4.9%(+8.17)#1,903 |
| 94. | 18464 | 12.9% | 4.6%(+8.33)#94 | 4.9%(+8.07)#1,924 |
| 95. | 18709 | 12.9% | 4.6%(+8.32)#95 | 4.9%(+8.05)#1,931 |
| 96. | 15728 | 12.9% | 4.6%(+8.27)#96 | 4.9%(+8.01)#1,944 |
| 97. | 16136 | 12.9% | 4.6%(+8.25)#97 | 4.9%(+7.98)#1,948 |
| 98. | 16436 | 12.8% | 4.6%(+8.21)#98 | 4.9%(+7.95)#1,957 |
| 99. | 15688 | 12.8% | 4.6%(+8.18)#99 | 4.9%(+7.92)#1,962 |
| 100. | 15696 | 12.8% | 4.6%(+8.16)#100 | 4.9%(+7.89)#1,968 |
Common Questions
What are the Top 10 Zip Codes with the Highest Percentage of Population with a Degree in Liberal Arts and History in Pennsylvania?
Top 10 Zip Codes with the Highest Percentage of Population with a Degree in Liberal Arts and History in Pennsylvania are:
What zip code has the Highest Percentage of Population with a Degree in Liberal Arts and History in Pennsylvania?
15451 has the Highest Percentage of Population with a Degree in Liberal Arts and History in Pennsylvania with 100.0%.
What is the Percentage of Population with a Degree in Liberal Arts and History in the State of Pennsylvania?
Percentage of Population with a Degree in Liberal Arts and History in Pennsylvania is 4.6%.
What is the Percentage of Population with a Degree in Liberal Arts and History in the United States?
Percentage of Population with a Degree in Liberal Arts and History in the United States is 4.9%.