Zip Codes with the Highest Percentage of Population with a Degree in Liberal Arts and History in Cincinnati, OH
RELATED REPORTS & OPTIONS
Liberal Arts and History
Cincinnati
Compare Zip Codes
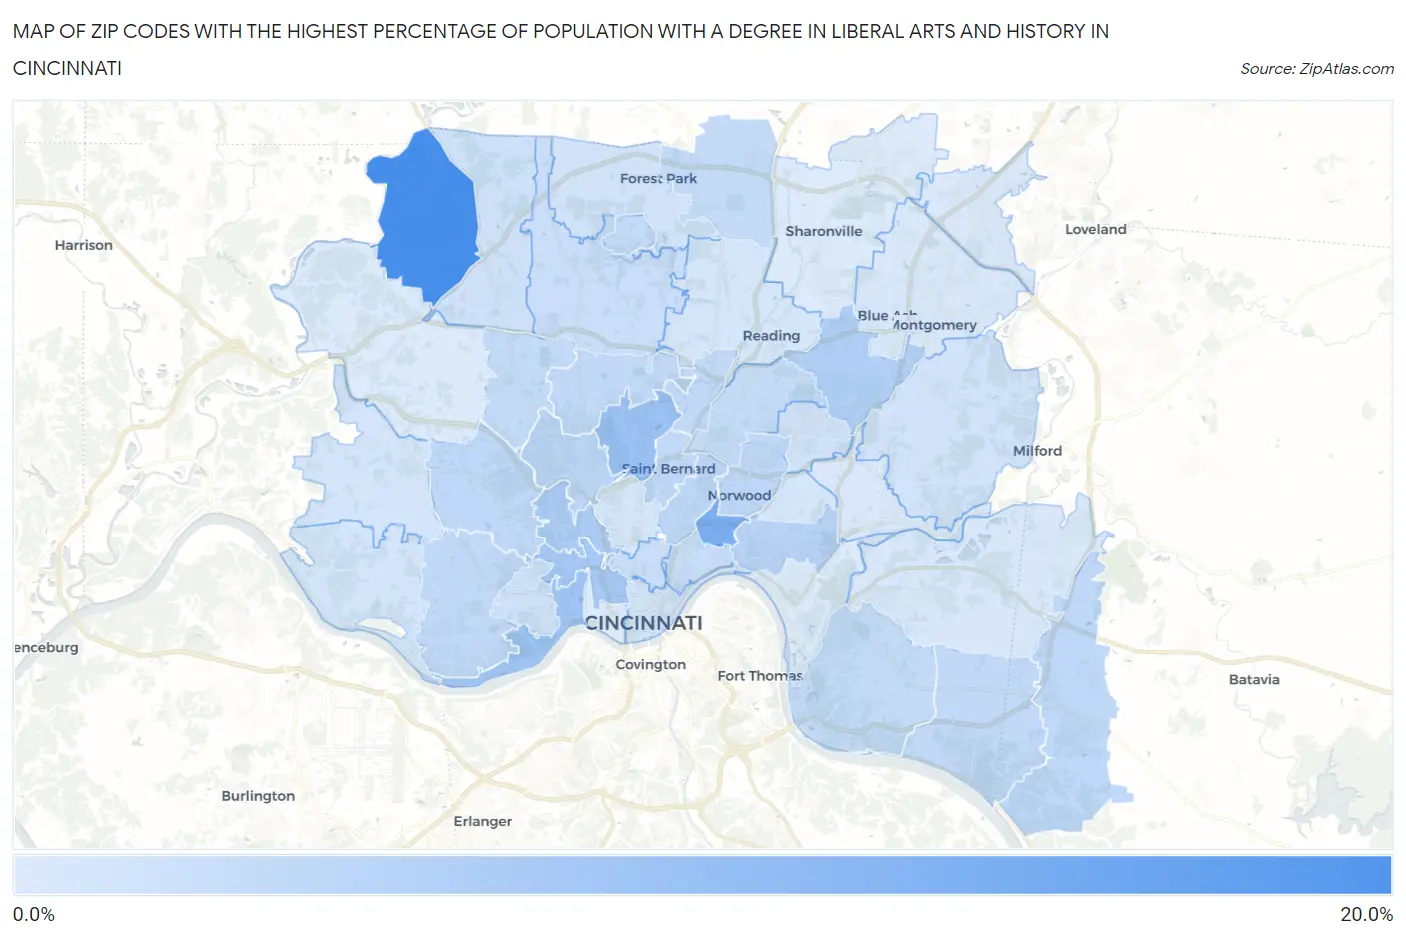
Map of Zip Codes with the Highest Percentage of Population with a Degree in Liberal Arts and History in Cincinnati
0.0%
20.0%
Zip Codes with the Highest Percentage of Population with a Degree in Liberal Arts and History in Cincinnati, OH
| Zip Code | % Graduates | vs State | vs National | |
| 1. | 45252 | 19.0% | 4.2%(+14.8)#33 | 4.9%(+14.2)#932 |
| 2. | 45207 | 13.3% | 4.2%(+9.08)#51 | 4.9%(+8.40)#1,831 |
| 3. | 45232 | 10.1% | 4.2%(+5.95)#83 | 4.9%(+5.28)#3,028 |
| 4. | 45204 | 9.3% | 4.2%(+5.14)#98 | 4.9%(+4.46)#3,573 |
| 5. | 45214 | 8.9% | 4.2%(+4.70)#115 | 4.9%(+4.03)#3,938 |
| 6. | 45225 | 8.2% | 4.2%(+4.00)#137 | 4.9%(+3.32)#4,665 |
| 7. | 45236 | 7.8% | 4.2%(+3.58)#146 | 4.9%(+2.91)#5,199 |
| 8. | 45208 | 7.1% | 4.2%(+2.89)#176 | 4.9%(+2.21)#6,259 |
| 9. | 45223 | 6.7% | 4.2%(+2.52)#192 | 4.9%(+1.84)#6,908 |
| 10. | 45229 | 6.7% | 4.2%(+2.52)#193 | 4.9%(+1.84)#6,911 |
| 11. | 45211 | 6.4% | 4.2%(+2.18)#214 | 4.9%(+1.50)#7,619 |
| 12. | 45245 | 6.3% | 4.2%(+2.14)#215 | 4.9%(+1.46)#7,697 |
| 13. | 45212 | 6.3% | 4.2%(+2.11)#219 | 4.9%(+1.43)#7,777 |
| 14. | 45255 | 6.2% | 4.2%(+2.02)#222 | 4.9%(+1.35)#7,977 |
| 15. | 45238 | 6.2% | 4.2%(+2.02)#223 | 4.9%(+1.35)#7,986 |
| 16. | 45217 | 6.2% | 4.2%(+2.00)#225 | 4.9%(+1.33)#8,028 |
| 17. | 45224 | 6.2% | 4.2%(+1.98)#228 | 4.9%(+1.31)#8,074 |
| 18. | 45216 | 6.1% | 4.2%(+1.95)#231 | 4.9%(+1.27)#8,152 |
| 19. | 45246 | 6.0% | 4.2%(+1.81)#245 | 4.9%(+1.13)#8,502 |
| 20. | 45239 | 5.9% | 4.2%(+1.74)#252 | 4.9%(+1.07)#8,666 |
| 21. | 45218 | 5.9% | 4.2%(+1.72)#254 | 4.9%(+1.05)#8,734 |
| 22. | 45230 | 5.9% | 4.2%(+1.66)#259 | 4.9%(+0.984)#8,904 |
| 23. | 45237 | 5.8% | 4.2%(+1.57)#263 | 4.9%(+0.895)#9,124 |
| 24. | 45206 | 5.5% | 4.2%(+1.28)#297 | 4.9%(+0.610)#9,913 |
| 25. | 45231 | 5.3% | 4.2%(+1.14)#314 | 4.9%(+0.464)#10,324 |
| 26. | 45219 | 5.3% | 4.2%(+1.06)#323 | 4.9%(+0.385)#10,581 |
| 27. | 45205 | 4.8% | 4.2%(+0.639)#358 | 4.9%(-0.035)#11,866 |
| 28. | 45251 | 4.8% | 4.2%(+0.630)#359 | 4.9%(-0.044)#11,887 |
| 29. | 45202 | 4.6% | 4.2%(+0.428)#384 | 4.9%(-0.247)#12,565 |
| 30. | 45243 | 4.6% | 4.2%(+0.367)#392 | 4.9%(-0.308)#12,751 |
| 31. | 45240 | 4.6% | 4.2%(+0.362)#394 | 4.9%(-0.312)#12,765 |
| 32. | 45213 | 4.5% | 4.2%(+0.327)#399 | 4.9%(-0.347)#12,900 |
| 33. | 45233 | 4.4% | 4.2%(+0.217)#410 | 4.9%(-0.458)#13,242 |
| 34. | 45248 | 4.4% | 4.2%(+0.161)#413 | 4.9%(-0.513)#13,421 |
| 35. | 45220 | 4.2% | 4.2%(-0.044)#429 | 4.9%(-0.719)#14,198 |
| 36. | 45215 | 4.1% | 4.2%(-0.056)#430 | 4.9%(-0.730)#14,232 |
| 37. | 45209 | 4.0% | 4.2%(-0.206)#453 | 4.9%(-0.881)#14,822 |
| 38. | 45244 | 3.9% | 4.2%(-0.262)#460 | 4.9%(-0.937)#15,036 |
| 39. | 45242 | 3.8% | 4.2%(-0.379)#475 | 4.9%(-1.05)#15,446 |
| 40. | 45227 | 3.7% | 4.2%(-0.496)#491 | 4.9%(-1.17)#15,901 |
| 41. | 45249 | 3.7% | 4.2%(-0.537)#497 | 4.9%(-1.21)#16,035 |
| 42. | 45241 | 3.5% | 4.2%(-0.676)#521 | 4.9%(-1.35)#16,513 |
| 43. | 45226 | 3.5% | 4.2%(-0.681)#523 | 4.9%(-1.36)#16,529 |
| 44. | 45203 | 3.5% | 4.2%(-0.745)#537 | 4.9%(-1.42)#16,778 |
| 45. | 45247 | 3.4% | 4.2%(-0.769)#544 | 4.9%(-1.44)#16,883 |
1
Common Questions
What are the Top 10 Zip Codes with the Highest Percentage of Population with a Degree in Liberal Arts and History in Cincinnati, OH?
Top 10 Zip Codes with the Highest Percentage of Population with a Degree in Liberal Arts and History in Cincinnati, OH are:
What zip code has the Highest Percentage of Population with a Degree in Liberal Arts and History in Cincinnati, OH?
45252 has the Highest Percentage of Population with a Degree in Liberal Arts and History in Cincinnati, OH with 19.0%.
What is the Percentage of Population with a Degree in Liberal Arts and History in Cincinnati, OH?
Percentage of Population with a Degree in Liberal Arts and History in Cincinnati is 5.5%.
What is the Percentage of Population with a Degree in Liberal Arts and History in Ohio?
Percentage of Population with a Degree in Liberal Arts and History in Ohio is 4.2%.
What is the Percentage of Population with a Degree in Liberal Arts and History in the United States?
Percentage of Population with a Degree in Liberal Arts and History in the United States is 4.9%.