Zip Codes with the Highest Percentage of Population with a Degree in Liberal Arts and History in Lima, OH
RELATED REPORTS & OPTIONS
Liberal Arts and History
Lima
Compare Zip Codes
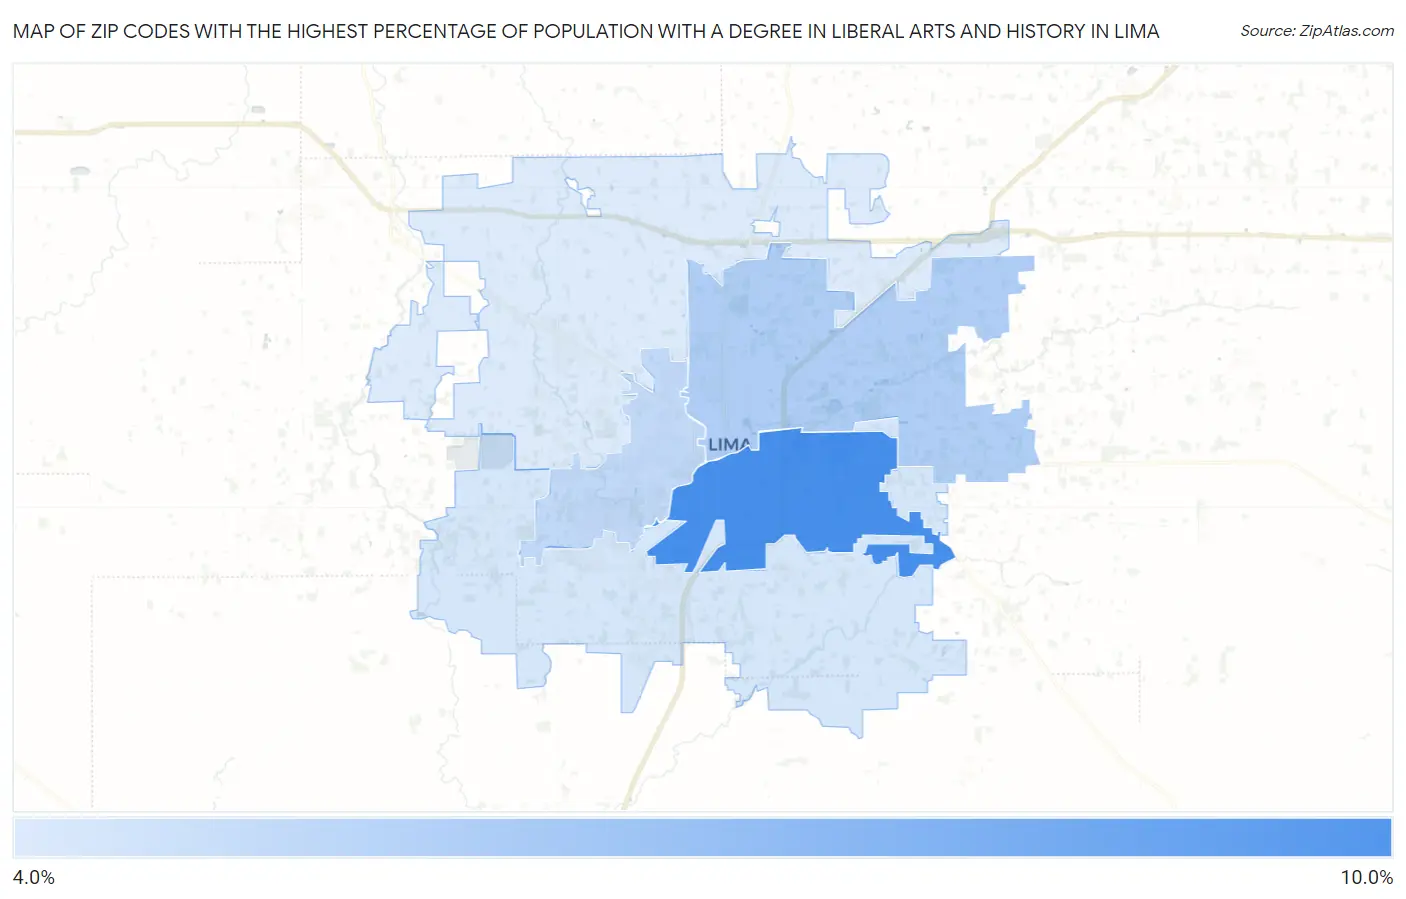
Map of Zip Codes with the Highest Percentage of Population with a Degree in Liberal Arts and History in Lima
0.0%
10.0%
Zip Codes with the Highest Percentage of Population with a Degree in Liberal Arts and History in Lima, OH
| Zip Code | % Graduates | vs State | vs National | |
| 1. | 45804 | 9.1% | 4.2%(+4.92)#103 | 4.9%(+4.25)#3,735 |
| 2. | 45801 | 6.0% | 4.2%(+1.76)#250 | 4.9%(+1.09)#8,634 |
| 3. | 45805 | 5.4% | 4.2%(+1.20)#307 | 4.9%(+0.524)#10,145 |
| 4. | 45806 | 4.8% | 4.2%(+0.573)#365 | 4.9%(-0.102)#12,066 |
| 5. | 45807 | 4.6% | 4.2%(+0.364)#393 | 4.9%(-0.310)#12,758 |
1
Common Questions
What are the Top 3 Zip Codes with the Highest Percentage of Population with a Degree in Liberal Arts and History in Lima, OH?
Top 3 Zip Codes with the Highest Percentage of Population with a Degree in Liberal Arts and History in Lima, OH are:
What zip code has the Highest Percentage of Population with a Degree in Liberal Arts and History in Lima, OH?
45804 has the Highest Percentage of Population with a Degree in Liberal Arts and History in Lima, OH with 9.1%.
What is the Percentage of Population with a Degree in Liberal Arts and History in Lima, OH?
Percentage of Population with a Degree in Liberal Arts and History in Lima is 7.0%.
What is the Percentage of Population with a Degree in Liberal Arts and History in Ohio?
Percentage of Population with a Degree in Liberal Arts and History in Ohio is 4.2%.
What is the Percentage of Population with a Degree in Liberal Arts and History in the United States?
Percentage of Population with a Degree in Liberal Arts and History in the United States is 4.9%.