Zip Codes with the Highest Percentage of Population with a Degree in Liberal Arts and History in Toledo, OH
RELATED REPORTS & OPTIONS
Liberal Arts and History
Toledo
Compare Zip Codes
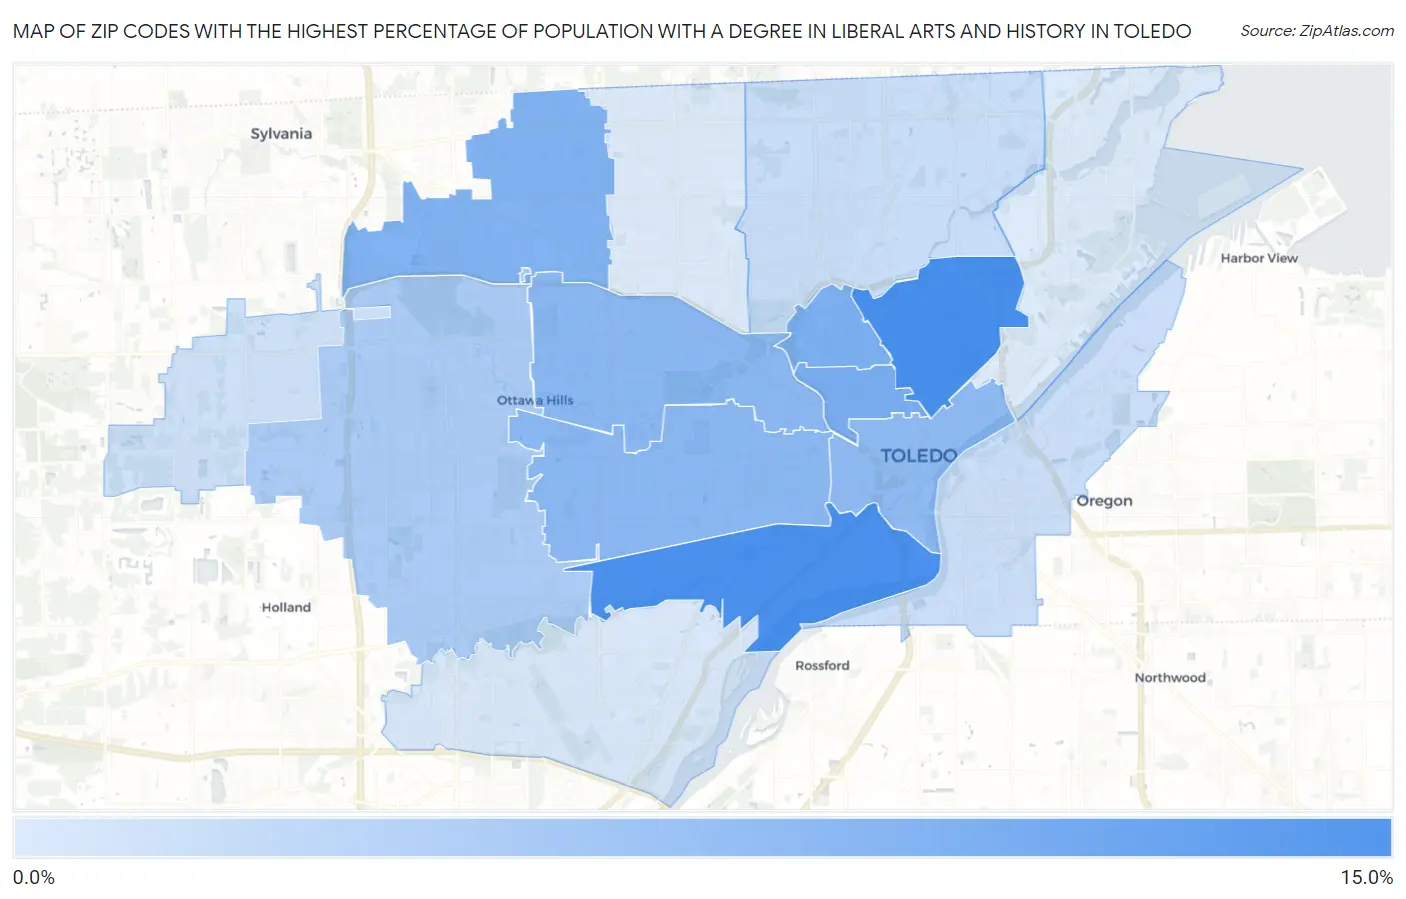
Map of Zip Codes with the Highest Percentage of Population with a Degree in Liberal Arts and History in Toledo
0.0%
15.0%
Zip Codes with the Highest Percentage of Population with a Degree in Liberal Arts and History in Toledo, OH
| Zip Code | % Graduates | vs State | vs National | |
| 1. | 43608 | 10.4% | 4.2%(+6.15)#78 | 4.9%(+5.48)#2,890 |
| 2. | 43609 | 10.2% | 4.2%(+6.01)#80 | 4.9%(+5.34)#2,992 |
| 3. | 43620 | 7.9% | 4.2%(+3.69)#142 | 4.9%(+3.01)#5,055 |
| 4. | 43610 | 7.7% | 4.2%(+3.49)#148 | 4.9%(+2.82)#5,309 |
| 5. | 43623 | 7.5% | 4.2%(+3.26)#158 | 4.9%(+2.59)#5,649 |
| 6. | 43606 | 7.1% | 4.2%(+2.89)#177 | 4.9%(+2.21)#6,264 |
| 7. | 43607 | 7.0% | 4.2%(+2.80)#180 | 4.9%(+2.13)#6,385 |
| 8. | 43604 | 6.8% | 4.2%(+2.59)#187 | 4.9%(+1.91)#6,773 |
| 9. | 43615 | 5.5% | 4.2%(+1.34)#293 | 4.9%(+0.661)#9,780 |
| 10. | 43612 | 4.1% | 4.2%(-0.096)#439 | 4.9%(-0.770)#14,401 |
| 11. | 43605 | 3.9% | 4.2%(-0.253)#459 | 4.9%(-0.927)#15,000 |
| 12. | 43617 | 3.7% | 4.2%(-0.502)#492 | 4.9%(-1.18)#15,923 |
| 13. | 43614 | 3.2% | 4.2%(-0.961)#570 | 4.9%(-1.64)#17,536 |
| 14. | 43613 | 3.1% | 4.2%(-1.08)#587 | 4.9%(-1.75)#17,933 |
| 15. | 43611 | 3.1% | 4.2%(-1.13)#596 | 4.9%(-1.80)#18,088 |
1
Common Questions
What are the Top 10 Zip Codes with the Highest Percentage of Population with a Degree in Liberal Arts and History in Toledo, OH?
Top 10 Zip Codes with the Highest Percentage of Population with a Degree in Liberal Arts and History in Toledo, OH are:
What zip code has the Highest Percentage of Population with a Degree in Liberal Arts and History in Toledo, OH?
43608 has the Highest Percentage of Population with a Degree in Liberal Arts and History in Toledo, OH with 10.4%.
What is the Percentage of Population with a Degree in Liberal Arts and History in Toledo, OH?
Percentage of Population with a Degree in Liberal Arts and History in Toledo is 5.8%.
What is the Percentage of Population with a Degree in Liberal Arts and History in Ohio?
Percentage of Population with a Degree in Liberal Arts and History in Ohio is 4.2%.
What is the Percentage of Population with a Degree in Liberal Arts and History in the United States?
Percentage of Population with a Degree in Liberal Arts and History in the United States is 4.9%.