Zip Codes with the Highest Percentage of Population with a Degree in Liberal Arts and History in Massillon, OH
RELATED REPORTS & OPTIONS
Liberal Arts and History
Massillon
Compare Zip Codes
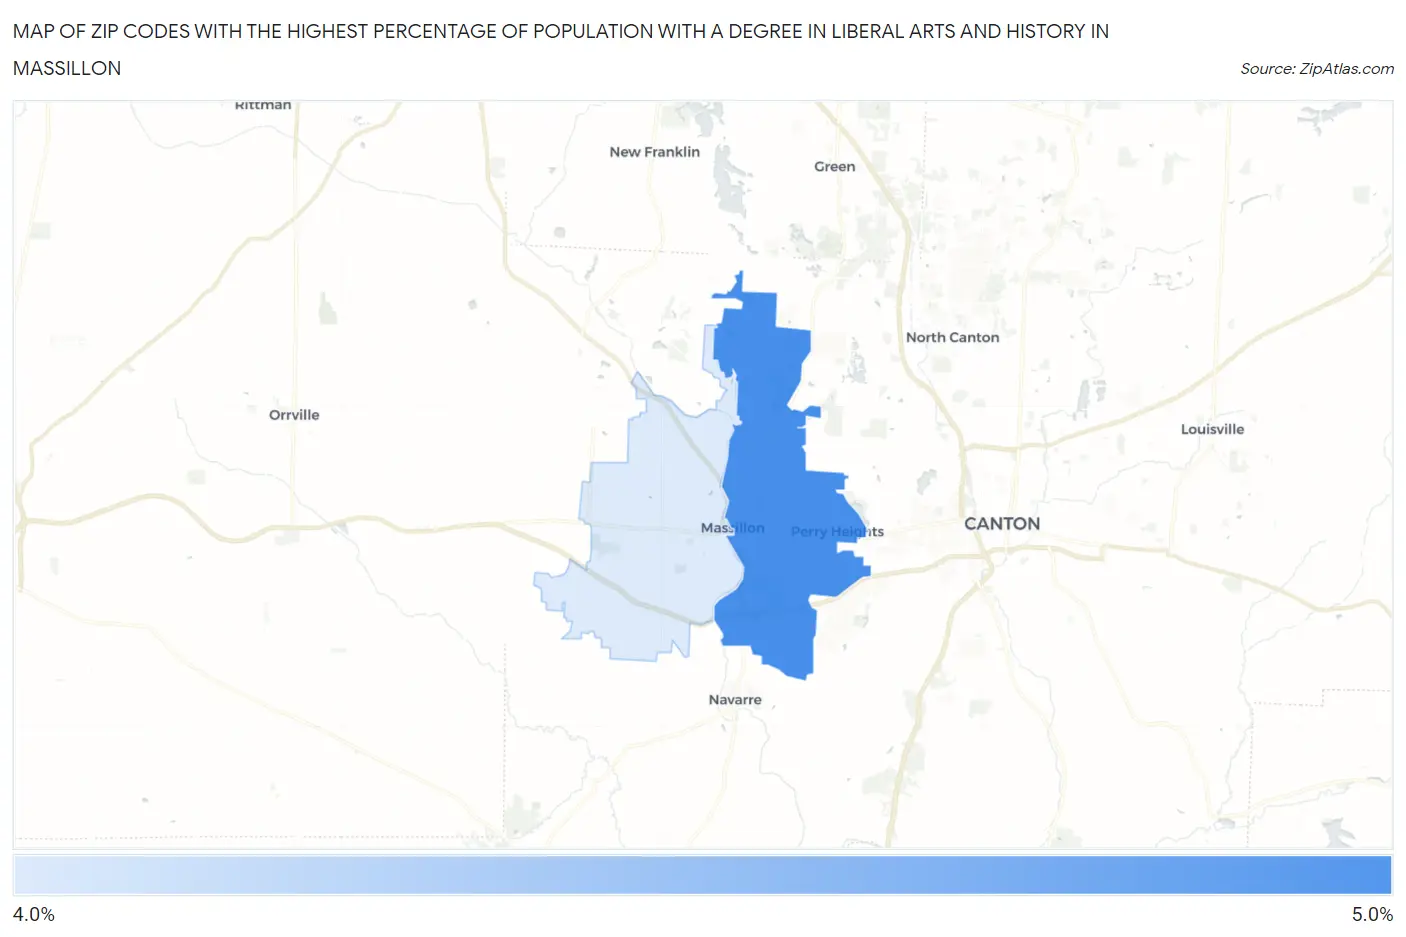
Map of Zip Codes with the Highest Percentage of Population with a Degree in Liberal Arts and History in Massillon
0.0%
5.0%
Zip Codes with the Highest Percentage of Population with a Degree in Liberal Arts and History in Massillon, OH
| Zip Code | % Graduates | vs State | vs National | |
| 1. | 44646 | 4.8% | 4.2%(+0.567)#367 | 4.9%(-0.108)#12,081 |
| 2. | 44647 | 4.1% | 4.2%(-0.069)#433 | 4.9%(-0.744)#14,292 |
1
Common Questions
What are the Top Zip Codes with the Highest Percentage of Population with a Degree in Liberal Arts and History in Massillon, OH?
Top Zip Codes with the Highest Percentage of Population with a Degree in Liberal Arts and History in Massillon, OH are:
What zip code has the Highest Percentage of Population with a Degree in Liberal Arts and History in Massillon, OH?
44646 has the Highest Percentage of Population with a Degree in Liberal Arts and History in Massillon, OH with 4.8%.
What is the Percentage of Population with a Degree in Liberal Arts and History in Massillon, OH?
Percentage of Population with a Degree in Liberal Arts and History in Massillon is 5.0%.
What is the Percentage of Population with a Degree in Liberal Arts and History in Ohio?
Percentage of Population with a Degree in Liberal Arts and History in Ohio is 4.2%.
What is the Percentage of Population with a Degree in Liberal Arts and History in the United States?
Percentage of Population with a Degree in Liberal Arts and History in the United States is 4.9%.