Zip Codes with the Highest Percentage of Population Employed in Security & Protection in Dayton, OH
RELATED REPORTS & OPTIONS
Security & Protection
Dayton
Compare Zip Codes
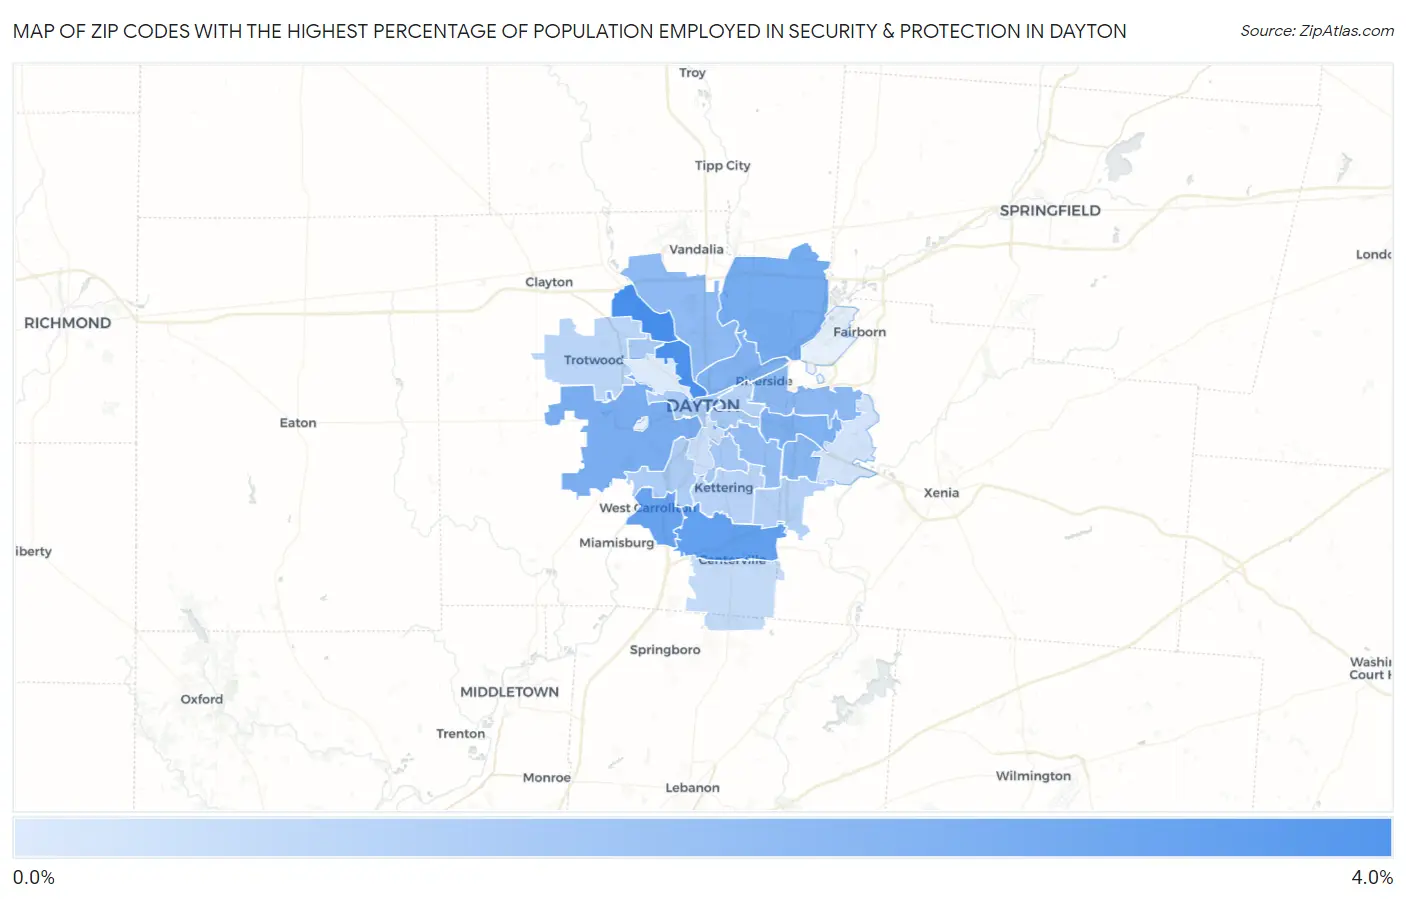
Map of Zip Codes with the Highest Percentage of Population Employed in Security & Protection in Dayton
0.0%
4.0%
Zip Codes with the Highest Percentage of Population Employed in Security & Protection in Dayton, OH
| Zip Code | % Employed | vs State | vs National | |
| 1. | 45415 | 3.0% | 1.9%(+1.14)#179 | 2.1%(+0.899)#7,053 |
| 2. | 45405 | 3.0% | 1.9%(+1.07)#191 | 2.1%(+0.837)#7,281 |
| 3. | 45459 | 2.6% | 1.9%(+0.673)#260 | 2.1%(+0.435)#9,086 |
| 4. | 45449 | 2.5% | 1.9%(+0.629)#266 | 2.1%(+0.390)#9,308 |
| 5. | 45424 | 2.3% | 1.9%(+0.402)#318 | 2.1%(+0.164)#10,568 |
| 6. | 45417 | 2.2% | 1.9%(+0.325)#340 | 2.1%(+0.087)#11,045 |
| 7. | 45432 | 2.2% | 1.9%(+0.243)#361 | 2.1%(+0.004)#11,549 |
| 8. | 45404 | 2.1% | 1.9%(+0.189)#374 | 2.1%(-0.049)#11,908 |
| 9. | 45430 | 2.0% | 1.9%(+0.094)#402 | 2.1%(-0.144)#12,538 |
| 10. | 45431 | 1.9% | 1.9%(+0.010)#430 | 2.1%(-0.229)#13,086 |
| 11. | 45414 | 1.9% | 1.9%(-0.028)#438 | 2.1%(-0.267)#13,366 |
| 12. | 45420 | 1.8% | 1.9%(-0.084)#457 | 2.1%(-0.322)#13,738 |
| 13. | 45419 | 1.5% | 1.9%(-0.409)#552 | 2.1%(-0.647)#16,191 |
| 14. | 45416 | 1.5% | 1.9%(-0.420)#557 | 2.1%(-0.659)#16,290 |
| 15. | 45410 | 1.5% | 1.9%(-0.449)#567 | 2.1%(-0.688)#16,485 |
| 16. | 45402 | 1.4% | 1.9%(-0.469)#575 | 2.1%(-0.708)#16,660 |
| 17. | 45439 | 1.4% | 1.9%(-0.518)#598 | 2.1%(-0.756)#17,006 |
| 18. | 45440 | 1.3% | 1.9%(-0.629)#627 | 2.1%(-0.867)#17,899 |
| 19. | 45403 | 1.3% | 1.9%(-0.650)#638 | 2.1%(-0.888)#18,065 |
| 20. | 45429 | 1.2% | 1.9%(-0.680)#654 | 2.1%(-0.918)#18,277 |
| 21. | 45426 | 1.2% | 1.9%(-0.740)#674 | 2.1%(-0.978)#18,744 |
| 22. | 45458 | 1.0% | 1.9%(-0.880)#726 | 2.1%(-1.12)#19,812 |
| 23. | 45409 | 0.93% | 1.9%(-0.978)#760 | 2.1%(-1.22)#20,557 |
| 24. | 45434 | 0.80% | 1.9%(-1.11)#800 | 2.1%(-1.34)#21,382 |
| 25. | 45406 | 0.62% | 1.9%(-1.29)#847 | 2.1%(-1.53)#22,539 |
1
Common Questions
What are the Top 10 Zip Codes with the Highest Percentage of Population Employed in Security & Protection in Dayton, OH?
Top 10 Zip Codes with the Highest Percentage of Population Employed in Security & Protection in Dayton, OH are:
What zip code has the Highest Percentage of Population Employed in Security & Protection in Dayton, OH?
45415 has the Highest Percentage of Population Employed in Security & Protection in Dayton, OH with 3.0%.
What is the Percentage of Population Employed in Security & Protection in Dayton, OH?
Percentage of Population Employed in Security & Protection in Dayton is 2.0%.
What is the Percentage of Population Employed in Security & Protection in Ohio?
Percentage of Population Employed in Security & Protection in Ohio is 1.9%.
What is the Percentage of Population Employed in Security & Protection in the United States?
Percentage of Population Employed in Security & Protection in the United States is 2.1%.