Zip Codes with the Highest Percentage of Population Employed in Security & Protection in Lima, OH
RELATED REPORTS & OPTIONS
Security & Protection
Lima
Compare Zip Codes
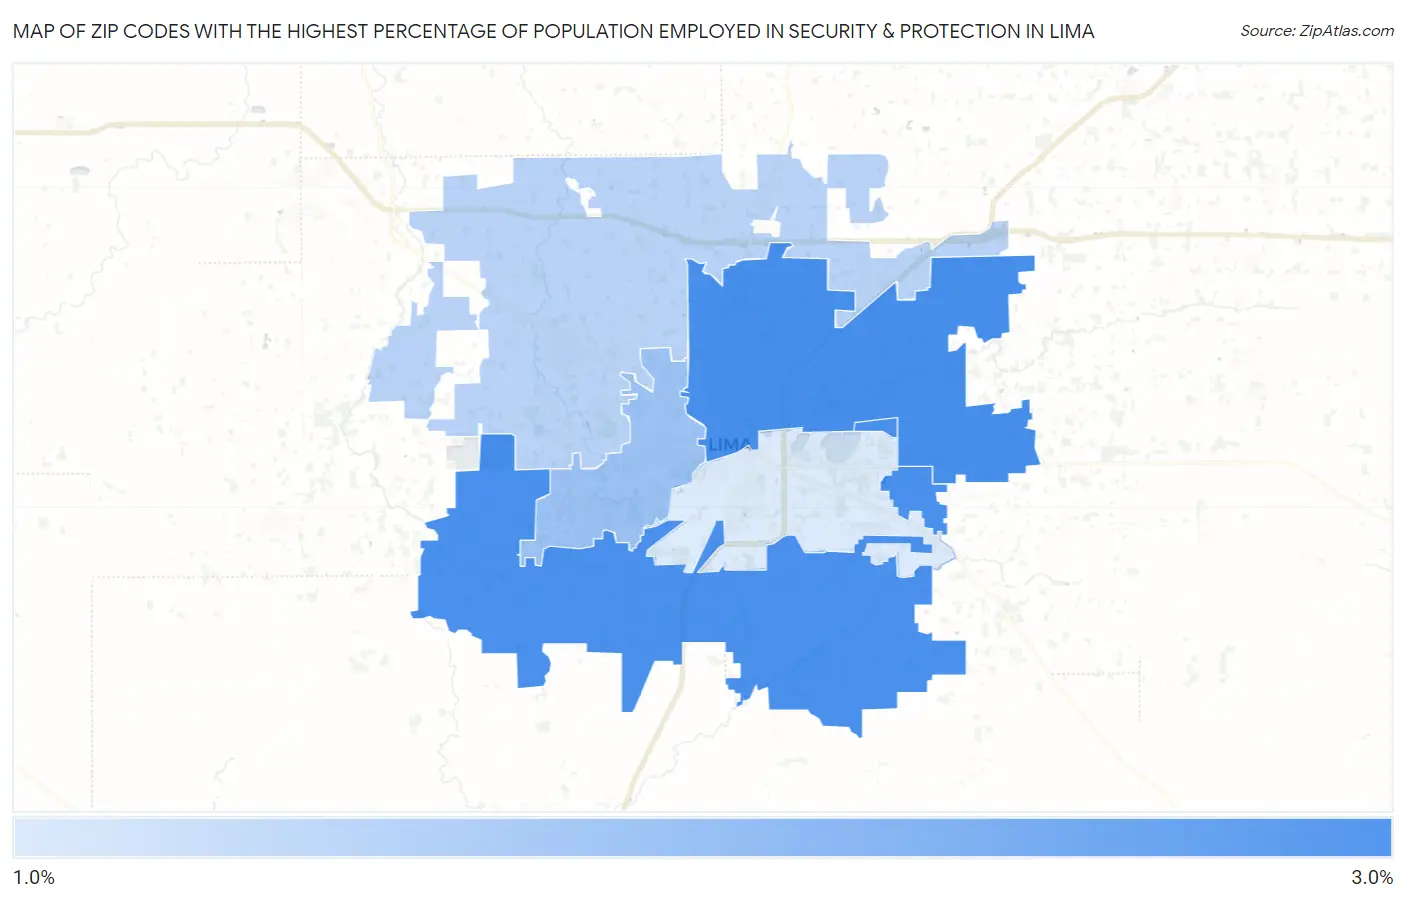
Map of Zip Codes with the Highest Percentage of Population Employed in Security & Protection in Lima
0.0%
3.0%
Zip Codes with the Highest Percentage of Population Employed in Security & Protection in Lima, OH
| Zip Code | % Employed | vs State | vs National | |
| 1. | 45801 | 2.9% | 1.9%(+0.986)#203 | 2.1%(+0.748)#7,663 |
| 2. | 45806 | 2.9% | 1.9%(+0.970)#206 | 2.1%(+0.732)#7,725 |
| 3. | 45805 | 2.1% | 1.9%(+0.162)#384 | 2.1%(-0.076)#12,094 |
| 4. | 45807 | 1.8% | 1.9%(-0.098)#459 | 2.1%(-0.337)#13,843 |
| 5. | 45804 | 1.4% | 1.9%(-0.462)#572 | 2.1%(-0.700)#16,596 |
1
Common Questions
What are the Top 3 Zip Codes with the Highest Percentage of Population Employed in Security & Protection in Lima, OH?
Top 3 Zip Codes with the Highest Percentage of Population Employed in Security & Protection in Lima, OH are:
What zip code has the Highest Percentage of Population Employed in Security & Protection in Lima, OH?
45801 has the Highest Percentage of Population Employed in Security & Protection in Lima, OH with 2.9%.
What is the Percentage of Population Employed in Security & Protection in Lima, OH?
Percentage of Population Employed in Security & Protection in Lima is 2.2%.
What is the Percentage of Population Employed in Security & Protection in Ohio?
Percentage of Population Employed in Security & Protection in Ohio is 1.9%.
What is the Percentage of Population Employed in Security & Protection in the United States?
Percentage of Population Employed in Security & Protection in the United States is 2.1%.