Zip Codes with the Highest Percentage of Population Employed in Security & Protection in Springfield, OH
RELATED REPORTS & OPTIONS
Security & Protection
Springfield
Compare Zip Codes
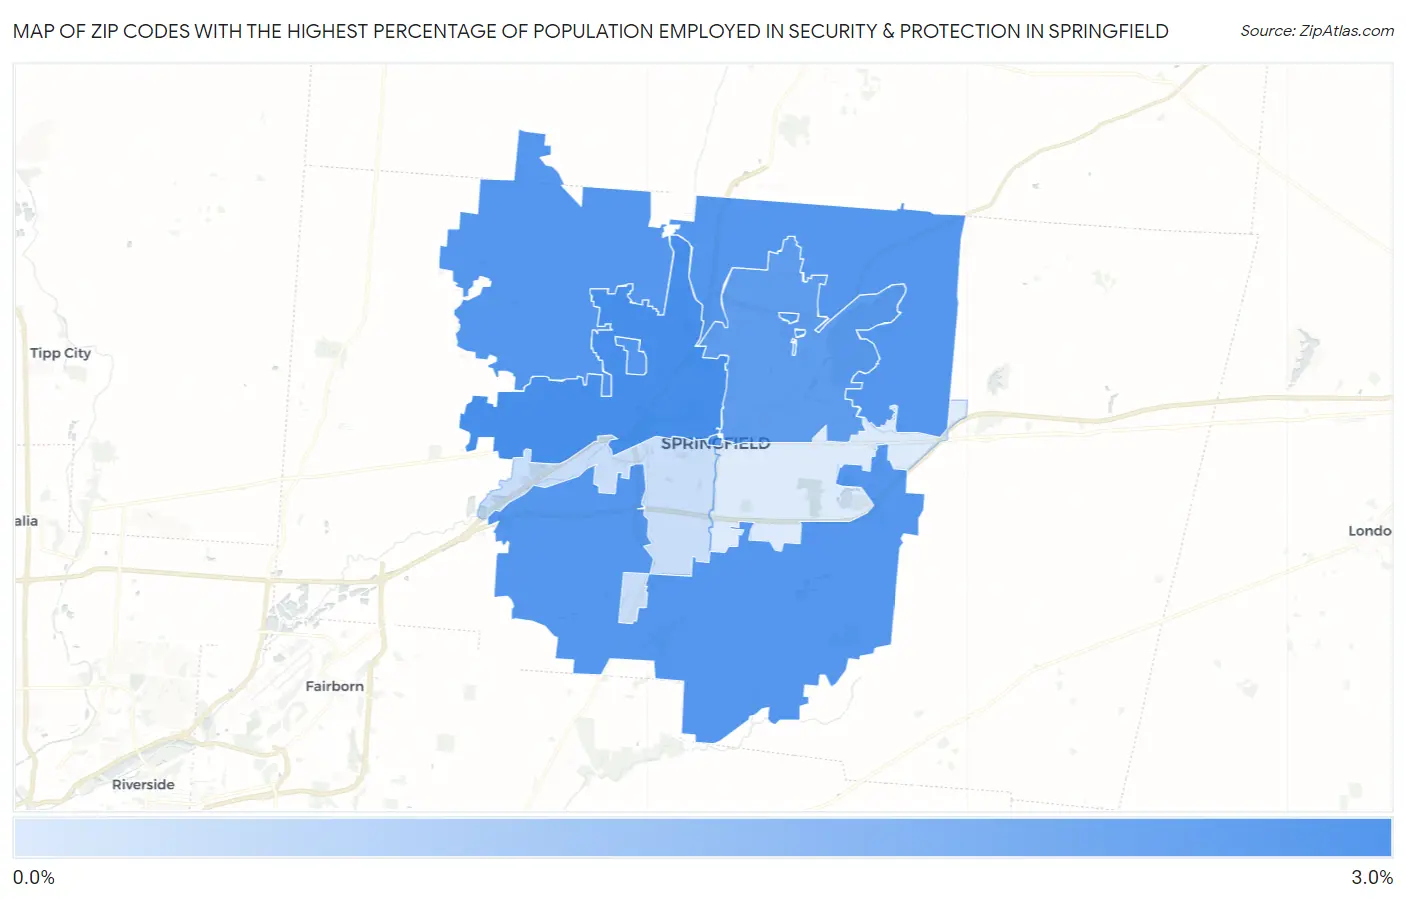
Map of Zip Codes with the Highest Percentage of Population Employed in Security & Protection in Springfield
0.0%
3.0%
Zip Codes with the Highest Percentage of Population Employed in Security & Protection in Springfield, OH
| Zip Code | % Employed | vs State | vs National | |
| 1. | 45504 | 2.6% | 1.9%(+0.678)#259 | 2.1%(+0.440)#9,058 |
| 2. | 45502 | 2.4% | 1.9%(+0.481)#300 | 2.1%(+0.242)#10,097 |
| 3. | 45503 | 2.3% | 1.9%(+0.362)#330 | 2.1%(+0.124)#10,825 |
| 4. | 45506 | 0.89% | 1.9%(-1.02)#776 | 2.1%(-1.26)#20,853 |
| 5. | 45505 | 0.62% | 1.9%(-1.29)#850 | 2.1%(-1.53)#22,562 |
1
Common Questions
What are the Top 3 Zip Codes with the Highest Percentage of Population Employed in Security & Protection in Springfield, OH?
Top 3 Zip Codes with the Highest Percentage of Population Employed in Security & Protection in Springfield, OH are:
What zip code has the Highest Percentage of Population Employed in Security & Protection in Springfield, OH?
45504 has the Highest Percentage of Population Employed in Security & Protection in Springfield, OH with 2.6%.
What is the Percentage of Population Employed in Security & Protection in Springfield, OH?
Percentage of Population Employed in Security & Protection in Springfield is 1.4%.
What is the Percentage of Population Employed in Security & Protection in Ohio?
Percentage of Population Employed in Security & Protection in Ohio is 1.9%.
What is the Percentage of Population Employed in Security & Protection in the United States?
Percentage of Population Employed in Security & Protection in the United States is 2.1%.