Zip Codes with the Highest Percentage of Population Employed in Security & Protection in Arkansas
RELATED REPORTS & OPTIONS
Security & Protection
Arkansas
Compare Zip Codes
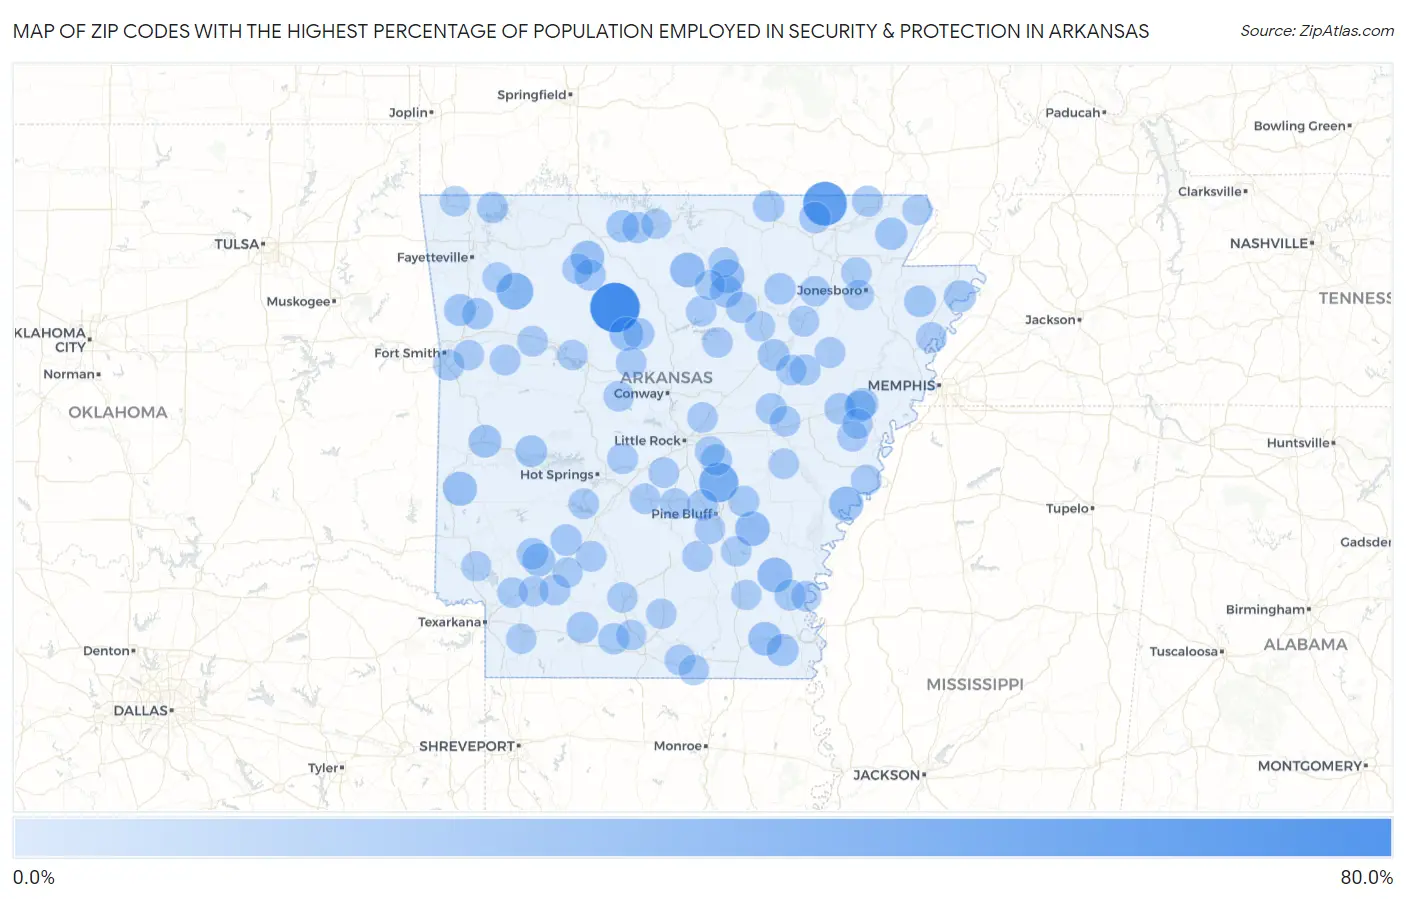
Map of Zip Codes with the Highest Percentage of Population Employed in Security & Protection in Arkansas
0.0%
80.0%
Zip Codes with the Highest Percentage of Population Employed in Security & Protection in Arkansas
| Zip Code | % Employed | vs State | vs National | |
| 1. | 72686 | 67.9% | 2.0%(+65.9)#1 | 2.1%(+65.8)#21 |
| 2. | 72478 | 48.4% | 2.0%(+46.4)#2 | 2.1%(+46.2)#43 |
| 3. | 72168 | 33.0% | 2.0%(+31.0)#3 | 2.1%(+30.8)#80 |
| 4. | 72721 | 24.5% | 2.0%(+22.5)#4 | 2.1%(+22.4)#134 |
| 5. | 72533 | 18.2% | 2.0%(+16.2)#5 | 2.1%(+16.0)#243 |
| 6. | 71677 | 18.2% | 2.0%(+16.2)#6 | 2.1%(+16.0)#245 |
| 7. | 71644 | 17.6% | 2.0%(+15.6)#7 | 2.1%(+15.4)#265 |
| 8. | 72333 | 16.8% | 2.0%(+14.8)#8 | 2.1%(+14.6)#290 |
| 9. | 71972 | 15.4% | 2.0%(+13.4)#9 | 2.1%(+13.2)#345 |
| 10. | 72540 | 15.0% | 2.0%(+13.0)#10 | 2.1%(+12.9)#364 |
| 11. | 72648 | 14.4% | 2.0%(+12.4)#11 | 2.1%(+12.2)#395 |
| 12. | 71658 | 14.2% | 2.0%(+12.2)#12 | 2.1%(+12.0)#406 |
| 13. | 72080 | 14.1% | 2.0%(+12.1)#13 | 2.1%(+12.0)#409 |
| 14. | 71825 | 11.5% | 2.0%(+9.51)#14 | 2.1%(+9.36)#601 |
| 15. | 72926 | 11.2% | 2.0%(+9.15)#15 | 2.1%(+9.01)#631 |
| 16. | 72567 | 10.8% | 2.0%(+8.81)#16 | 2.1%(+8.66)#665 |
| 17. | 71663 | 9.6% | 2.0%(+7.57)#17 | 2.1%(+7.43)#825 |
| 18. | 72436 | 9.6% | 2.0%(+7.55)#18 | 2.1%(+7.40)#831 |
| 19. | 72672 | 9.3% | 2.0%(+7.34)#19 | 2.1%(+7.20)#857 |
| 20. | 72358 | 8.9% | 2.0%(+6.93)#20 | 2.1%(+6.79)#927 |
| 21. | 72139 | 8.6% | 2.0%(+6.57)#21 | 2.1%(+6.42)#994 |
| 22. | 72934 | 8.5% | 2.0%(+6.52)#22 | 2.1%(+6.38)#1,003 |
| 23. | 72428 | 8.5% | 2.0%(+6.47)#23 | 2.1%(+6.33)#1,015 |
| 24. | 71969 | 8.1% | 2.0%(+6.14)#24 | 2.1%(+5.99)#1,115 |
| 25. | 71752 | 7.6% | 2.0%(+5.60)#25 | 2.1%(+5.46)#1,292 |
| 26. | 72359 | 7.4% | 2.0%(+5.40)#26 | 2.1%(+5.26)#1,364 |
| 27. | 72460 | 7.3% | 2.0%(+5.30)#27 | 2.1%(+5.16)#1,396 |
| 28. | 72372 | 7.3% | 2.0%(+5.28)#28 | 2.1%(+5.14)#1,407 |
| 29. | 71847 | 7.3% | 2.0%(+5.27)#29 | 2.1%(+5.12)#1,409 |
| 30. | 72579 | 7.3% | 2.0%(+5.26)#30 | 2.1%(+5.11)#1,417 |
| 31. | 72554 | 7.2% | 2.0%(+5.22)#31 | 2.1%(+5.07)#1,431 |
| 32. | 72946 | 7.2% | 2.0%(+5.19)#32 | 2.1%(+5.04)#1,443 |
| 33. | 72083 | 7.1% | 2.0%(+5.14)#33 | 2.1%(+4.99)#1,474 |
| 34. | 71962 | 7.1% | 2.0%(+5.11)#34 | 2.1%(+4.97)#1,484 |
| 35. | 72335 | 7.0% | 2.0%(+4.99)#35 | 2.1%(+4.84)#1,534 |
| 36. | 72141 | 6.9% | 2.0%(+4.87)#36 | 2.1%(+4.72)#1,598 |
| 37. | 72683 | 6.8% | 2.0%(+4.75)#37 | 2.1%(+4.61)#1,653 |
| 38. | 71654 | 6.6% | 2.0%(+4.63)#38 | 2.1%(+4.49)#1,722 |
| 39. | 71758 | 6.6% | 2.0%(+4.58)#39 | 2.1%(+4.43)#1,747 |
| 40. | 72916 | 6.4% | 2.0%(+4.35)#40 | 2.1%(+4.21)#1,857 |
| 41. | 72677 | 6.2% | 2.0%(+4.25)#41 | 2.1%(+4.10)#1,920 |
| 42. | 72550 | 6.2% | 2.0%(+4.22)#42 | 2.1%(+4.08)#1,935 |
| 43. | 72732 | 6.1% | 2.0%(+4.14)#43 | 2.1%(+3.99)#1,990 |
| 44. | 72004 | 5.9% | 2.0%(+3.94)#44 | 2.1%(+3.79)#2,118 |
| 45. | 72470 | 5.8% | 2.0%(+3.83)#45 | 2.1%(+3.68)#2,185 |
| 46. | 71602 | 5.8% | 2.0%(+3.77)#46 | 2.1%(+3.62)#2,235 |
| 47. | 72123 | 5.7% | 2.0%(+3.73)#47 | 2.1%(+3.59)#2,259 |
| 48. | 72040 | 5.7% | 2.0%(+3.67)#48 | 2.1%(+3.53)#2,301 |
| 49. | 72150 | 5.4% | 2.0%(+3.35)#49 | 2.1%(+3.21)#2,579 |
| 50. | 72112 | 5.3% | 2.0%(+3.34)#50 | 2.1%(+3.19)#2,595 |
| 51. | 72840 | 5.2% | 2.0%(+3.21)#51 | 2.1%(+3.06)#2,702 |
| 52. | 72087 | 5.2% | 2.0%(+3.17)#52 | 2.1%(+3.03)#2,731 |
| 53. | 72951 | 5.2% | 2.0%(+3.17)#53 | 2.1%(+3.02)#2,734 |
| 54. | 71743 | 5.1% | 2.0%(+3.14)#54 | 2.1%(+3.00)#2,766 |
| 55. | 71665 | 5.1% | 2.0%(+3.10)#55 | 2.1%(+2.95)#2,805 |
| 56. | 71835 | 5.1% | 2.0%(+3.05)#56 | 2.1%(+2.90)#2,863 |
| 57. | 71765 | 4.9% | 2.0%(+2.94)#57 | 2.1%(+2.79)#2,997 |
| 58. | 71929 | 4.9% | 2.0%(+2.89)#58 | 2.1%(+2.75)#3,051 |
| 59. | 72350 | 4.8% | 2.0%(+2.82)#59 | 2.1%(+2.67)#3,154 |
| 60. | 72006 | 4.8% | 2.0%(+2.80)#60 | 2.1%(+2.66)#3,173 |
| 61. | 72347 | 4.7% | 2.0%(+2.74)#61 | 2.1%(+2.59)#3,246 |
| 62. | 72017 | 4.7% | 2.0%(+2.72)#62 | 2.1%(+2.58)#3,268 |
| 63. | 72360 | 4.7% | 2.0%(+2.68)#63 | 2.1%(+2.53)#3,328 |
| 64. | 72044 | 4.6% | 2.0%(+2.63)#64 | 2.1%(+2.48)#3,390 |
| 65. | 71630 | 4.6% | 2.0%(+2.59)#65 | 2.1%(+2.45)#3,452 |
| 66. | 71603 | 4.5% | 2.0%(+2.52)#66 | 2.1%(+2.37)#3,579 |
| 67. | 72341 | 4.5% | 2.0%(+2.49)#67 | 2.1%(+2.35)#3,622 |
| 68. | 72641 | 4.5% | 2.0%(+2.48)#68 | 2.1%(+2.34)#3,632 |
| 69. | 72001 | 4.5% | 2.0%(+2.48)#69 | 2.1%(+2.34)#3,633 |
| 70. | 72128 | 4.5% | 2.0%(+2.45)#70 | 2.1%(+2.30)#3,685 |
| 71. | 72011 | 4.4% | 2.0%(+2.40)#71 | 2.1%(+2.26)#3,762 |
| 72. | 72076 | 4.4% | 2.0%(+2.40)#72 | 2.1%(+2.25)#3,772 |
| 73. | 71667 | 4.3% | 2.0%(+2.33)#73 | 2.1%(+2.18)#3,894 |
| 74. | 72342 | 4.3% | 2.0%(+2.31)#74 | 2.1%(+2.16)#3,925 |
| 75. | 72063 | 4.3% | 2.0%(+2.29)#75 | 2.1%(+2.14)#3,969 |
| 76. | 72543 | 4.2% | 2.0%(+2.20)#76 | 2.1%(+2.06)#4,117 |
| 77. | 71838 | 4.1% | 2.0%(+2.12)#77 | 2.1%(+1.98)#4,249 |
| 78. | 72715 | 4.1% | 2.0%(+2.11)#78 | 2.1%(+1.97)#4,275 |
| 79. | 71701 | 4.1% | 2.0%(+2.09)#79 | 2.1%(+1.94)#4,312 |
| 80. | 72416 | 4.1% | 2.0%(+2.08)#80 | 2.1%(+1.93)#4,333 |
| 81. | 71857 | 3.9% | 2.0%(+1.89)#81 | 2.1%(+1.74)#4,710 |
| 82. | 72170 | 3.9% | 2.0%(+1.87)#82 | 2.1%(+1.73)#4,745 |
| 83. | 72471 | 3.9% | 2.0%(+1.85)#83 | 2.1%(+1.71)#4,795 |
| 84. | 72556 | 3.8% | 2.0%(+1.84)#84 | 2.1%(+1.69)#4,820 |
| 85. | 72727 | 3.8% | 2.0%(+1.78)#85 | 2.1%(+1.64)#4,936 |
| 86. | 72568 | 3.8% | 2.0%(+1.77)#86 | 2.1%(+1.62)#4,973 |
| 87. | 71762 | 3.8% | 2.0%(+1.76)#87 | 2.1%(+1.61)#4,999 |
| 88. | 71744 | 3.8% | 2.0%(+1.75)#88 | 2.1%(+1.60)#5,022 |
| 89. | 71747 | 3.7% | 2.0%(+1.73)#89 | 2.1%(+1.58)#5,064 |
| 90. | 72847 | 3.7% | 2.0%(+1.72)#90 | 2.1%(+1.58)#5,085 |
| 91. | 72941 | 3.7% | 2.0%(+1.71)#91 | 2.1%(+1.57)#5,100 |
| 92. | 72560 | 3.7% | 2.0%(+1.71)#92 | 2.1%(+1.57)#5,101 |
| 93. | 71801 | 3.7% | 2.0%(+1.69)#93 | 2.1%(+1.55)#5,154 |
| 94. | 72454 | 3.6% | 2.0%(+1.62)#94 | 2.1%(+1.48)#5,344 |
| 95. | 71839 | 3.6% | 2.0%(+1.60)#95 | 2.1%(+1.46)#5,391 |
| 96. | 71823 | 3.6% | 2.0%(+1.57)#96 | 2.1%(+1.42)#5,478 |
| 97. | 71655 | 3.6% | 2.0%(+1.56)#97 | 2.1%(+1.42)#5,500 |
| 98. | 72142 | 3.5% | 2.0%(+1.52)#98 | 2.1%(+1.38)#5,609 |
| 99. | 72626 | 3.5% | 2.0%(+1.52)#99 | 2.1%(+1.38)#5,615 |
| 100. | 72404 | 3.5% | 2.0%(+1.51)#100 | 2.1%(+1.37)#5,632 |
Common Questions
What are the Top 10 Zip Codes with the Highest Percentage of Population Employed in Security & Protection in Arkansas?
Top 10 Zip Codes with the Highest Percentage of Population Employed in Security & Protection in Arkansas are:
What zip code has the Highest Percentage of Population Employed in Security & Protection in Arkansas?
72686 has the Highest Percentage of Population Employed in Security & Protection in Arkansas with 67.9%.
What is the Percentage of Population Employed in Security & Protection in the State of Arkansas?
Percentage of Population Employed in Security & Protection in Arkansas is 2.0%.
What is the Percentage of Population Employed in Security & Protection in the United States?
Percentage of Population Employed in Security & Protection in the United States is 2.1%.