Zip Codes with the Highest Percentage of Population Employed in Security & Protection in Lorain, OH
RELATED REPORTS & OPTIONS
Security & Protection
Lorain
Compare Zip Codes
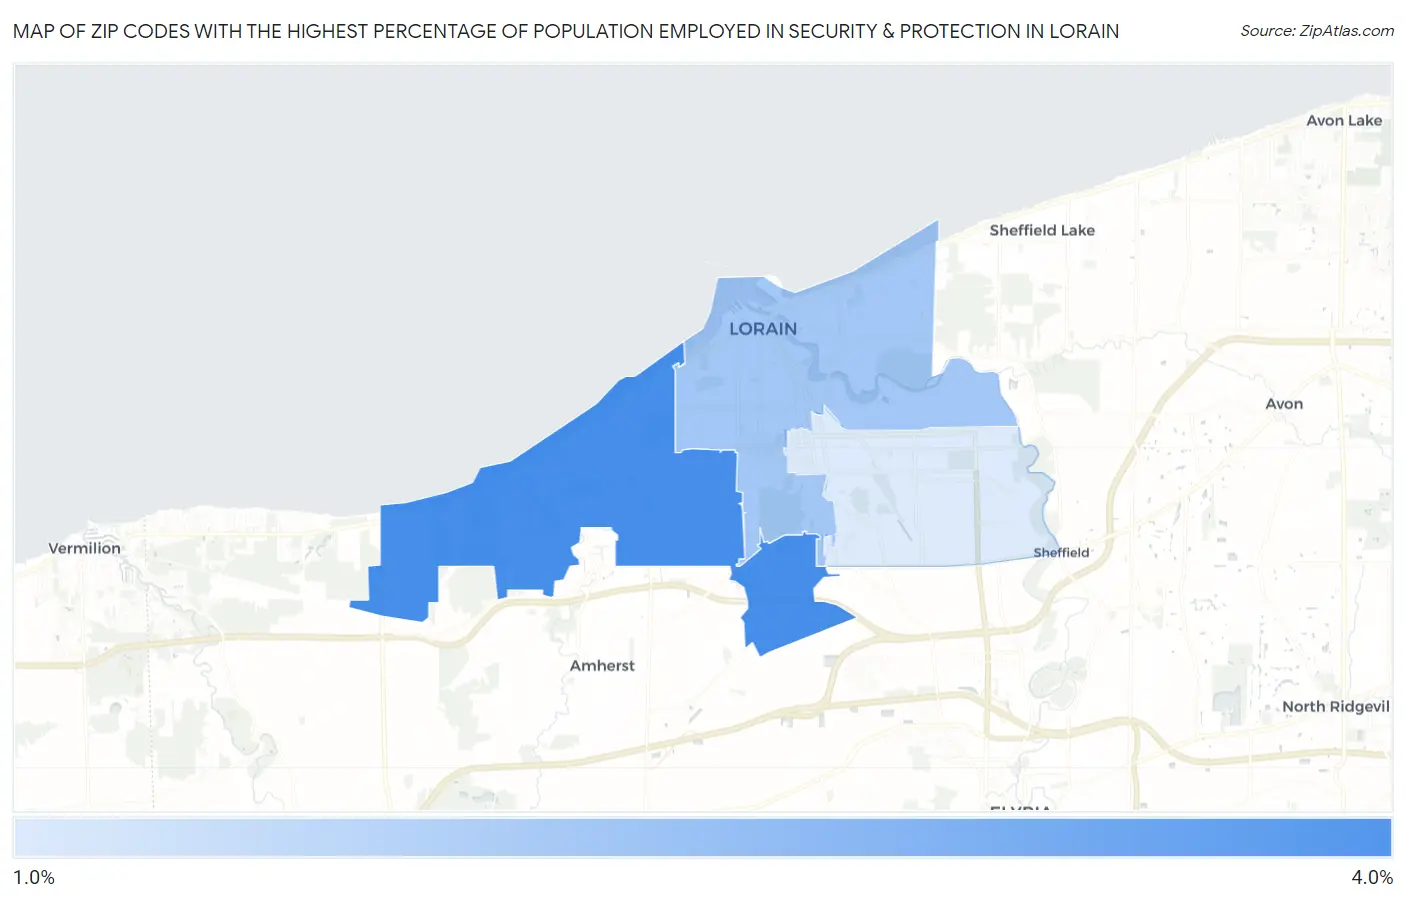
Map of Zip Codes with the Highest Percentage of Population Employed in Security & Protection in Lorain
0.0%
4.0%
Zip Codes with the Highest Percentage of Population Employed in Security & Protection in Lorain, OH
| Zip Code | % Employed | vs State | vs National | |
| 1. | 44053 | 3.3% | 1.9%(+1.36)#151 | 2.1%(+1.12)#6,343 |
| 2. | 44052 | 2.1% | 1.9%(+0.222)#364 | 2.1%(-0.016)#11,674 |
| 3. | 44055 | 1.4% | 1.9%(-0.461)#571 | 2.1%(-0.699)#16,589 |
1
Common Questions
What are the Top Zip Codes with the Highest Percentage of Population Employed in Security & Protection in Lorain, OH?
Top Zip Codes with the Highest Percentage of Population Employed in Security & Protection in Lorain, OH are:
What zip code has the Highest Percentage of Population Employed in Security & Protection in Lorain, OH?
44053 has the Highest Percentage of Population Employed in Security & Protection in Lorain, OH with 3.3%.
What is the Percentage of Population Employed in Security & Protection in Lorain, OH?
Percentage of Population Employed in Security & Protection in Lorain is 2.4%.
What is the Percentage of Population Employed in Security & Protection in Ohio?
Percentage of Population Employed in Security & Protection in Ohio is 1.9%.
What is the Percentage of Population Employed in Security & Protection in the United States?
Percentage of Population Employed in Security & Protection in the United States is 2.1%.