Zip Codes with the Highest Percentage of Population Employed in Security & Protection in Mansfield, OH
RELATED REPORTS & OPTIONS
Security & Protection
Mansfield
Compare Zip Codes
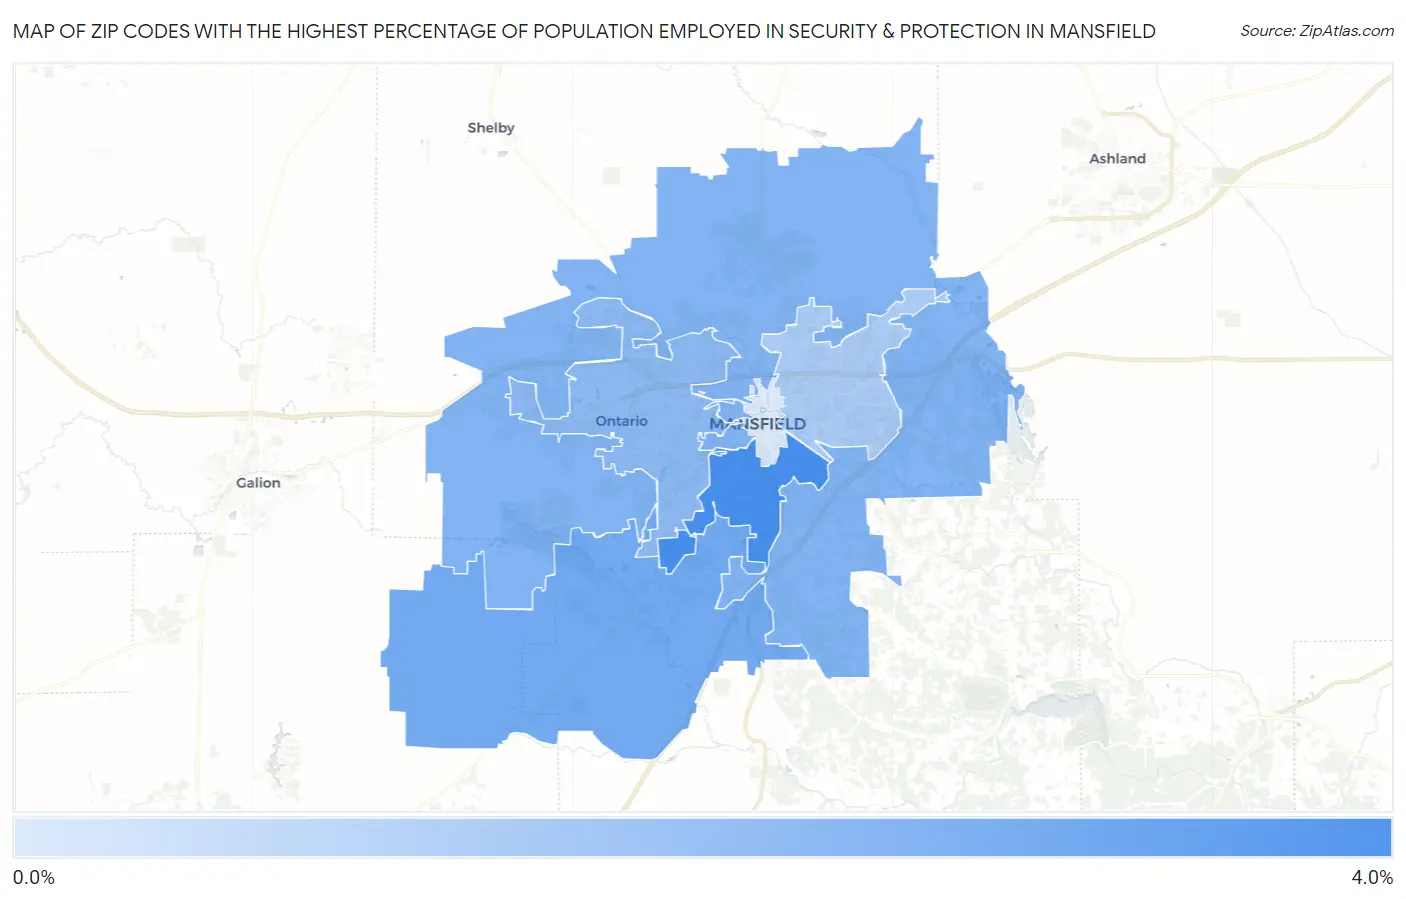
Map of Zip Codes with the Highest Percentage of Population Employed in Security & Protection in Mansfield
0.0%
4.0%
Zip Codes with the Highest Percentage of Population Employed in Security & Protection in Mansfield, OH
| Zip Code | % Employed | vs State | vs National | |
| 1. | 44907 | 3.9% | 1.9%(+1.95)#99 | 2.1%(+1.72)#4,767 |
| 2. | 44904 | 2.9% | 1.9%(+0.982)#204 | 2.1%(+0.744)#7,683 |
| 3. | 44903 | 2.6% | 1.9%(+0.719)#252 | 2.1%(+0.481)#8,877 |
| 4. | 44906 | 2.3% | 1.9%(+0.428)#314 | 2.1%(+0.189)#10,411 |
| 5. | 44905 | 1.7% | 1.9%(-0.201)#487 | 2.1%(-0.439)#14,606 |
| 6. | 44902 | 0.62% | 1.9%(-1.29)#848 | 2.1%(-1.53)#22,544 |
1
Common Questions
What are the Top 5 Zip Codes with the Highest Percentage of Population Employed in Security & Protection in Mansfield, OH?
Top 5 Zip Codes with the Highest Percentage of Population Employed in Security & Protection in Mansfield, OH are:
What zip code has the Highest Percentage of Population Employed in Security & Protection in Mansfield, OH?
44907 has the Highest Percentage of Population Employed in Security & Protection in Mansfield, OH with 3.9%.
What is the Percentage of Population Employed in Security & Protection in Mansfield, OH?
Percentage of Population Employed in Security & Protection in Mansfield is 2.8%.
What is the Percentage of Population Employed in Security & Protection in Ohio?
Percentage of Population Employed in Security & Protection in Ohio is 1.9%.
What is the Percentage of Population Employed in Security & Protection in the United States?
Percentage of Population Employed in Security & Protection in the United States is 2.1%.