Zip Codes with the Highest Percentage of Population Employed in Security & Protection in Canton, OH
RELATED REPORTS & OPTIONS
Security & Protection
Canton
Compare Zip Codes
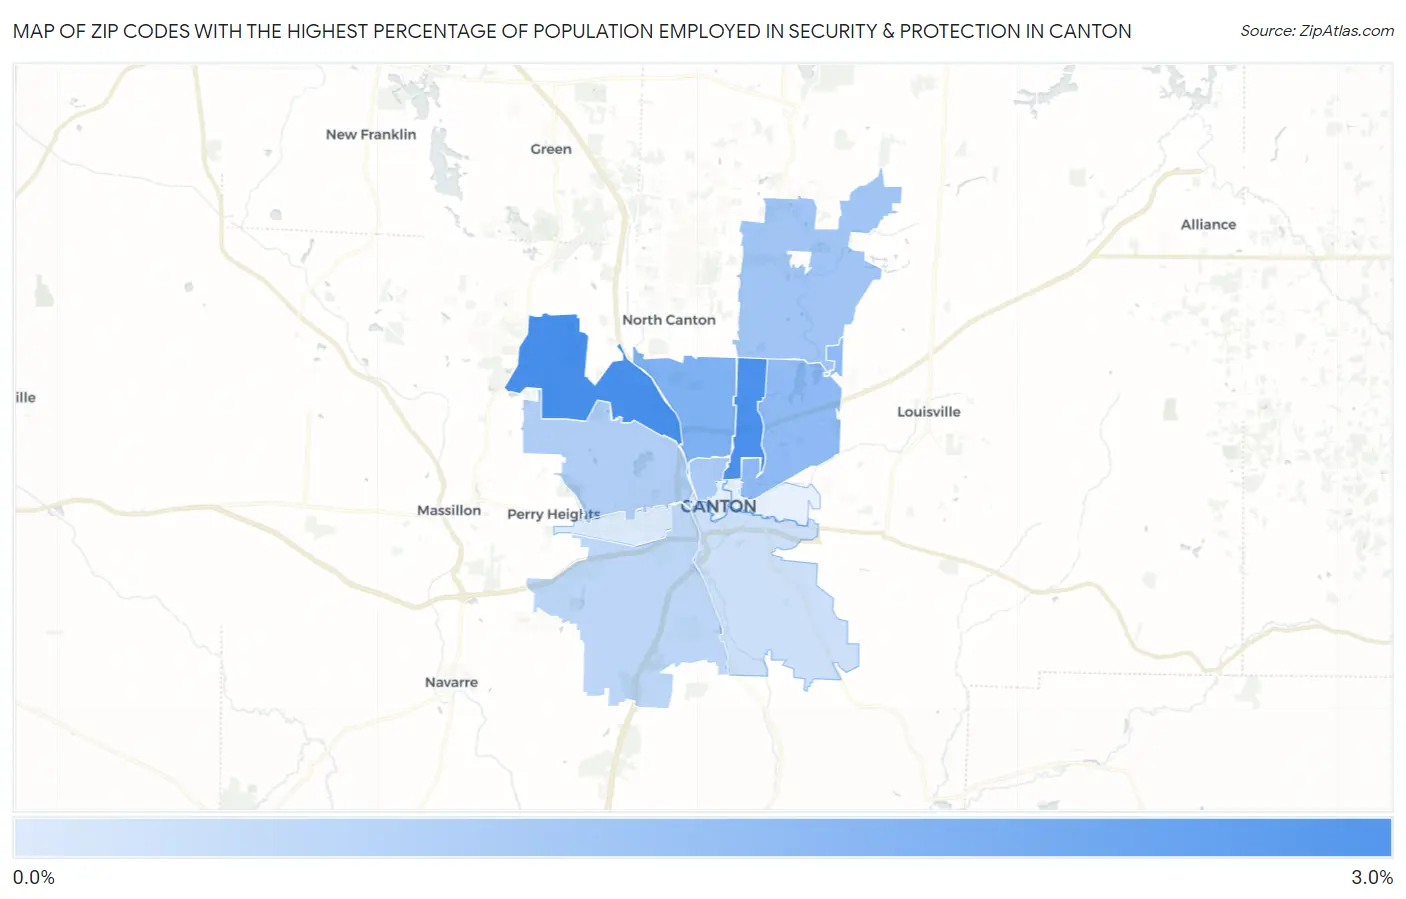
Map of Zip Codes with the Highest Percentage of Population Employed in Security & Protection in Canton
0.0%
3.0%
Zip Codes with the Highest Percentage of Population Employed in Security & Protection in Canton, OH
| Zip Code | % Employed | vs State | vs National | |
| 1. | 44718 | 2.5% | 1.9%(+0.609)#271 | 2.1%(+0.371)#9,413 |
| 2. | 44714 | 2.5% | 1.9%(+0.589)#275 | 2.1%(+0.351)#9,510 |
| 3. | 44709 | 1.7% | 1.9%(-0.258)#503 | 2.1%(-0.496)#15,023 |
| 4. | 44705 | 1.4% | 1.9%(-0.508)#592 | 2.1%(-0.747)#16,936 |
| 5. | 44721 | 1.1% | 1.9%(-0.800)#699 | 2.1%(-1.04)#19,207 |
| 6. | 44703 | 0.97% | 1.9%(-0.939)#750 | 2.1%(-1.18)#20,280 |
| 7. | 44708 | 0.89% | 1.9%(-1.02)#777 | 2.1%(-1.26)#20,874 |
| 8. | 44706 | 0.66% | 1.9%(-1.25)#832 | 2.1%(-1.49)#22,327 |
| 9. | 44707 | 0.41% | 1.9%(-1.50)#886 | 2.1%(-1.74)#23,680 |
| 10. | 44710 | 0.18% | 1.9%(-1.73)#924 | 2.1%(-1.97)#24,580 |
1
Common Questions
What are the Top 10 Zip Codes with the Highest Percentage of Population Employed in Security & Protection in Canton, OH?
Top 10 Zip Codes with the Highest Percentage of Population Employed in Security & Protection in Canton, OH are:
What zip code has the Highest Percentage of Population Employed in Security & Protection in Canton, OH?
44718 has the Highest Percentage of Population Employed in Security & Protection in Canton, OH with 2.5%.
What is the Percentage of Population Employed in Security & Protection in Canton, OH?
Percentage of Population Employed in Security & Protection in Canton is 1.1%.
What is the Percentage of Population Employed in Security & Protection in Ohio?
Percentage of Population Employed in Security & Protection in Ohio is 1.9%.
What is the Percentage of Population Employed in Security & Protection in the United States?
Percentage of Population Employed in Security & Protection in the United States is 2.1%.