Potawatomi vs French Canadian Male Disability
COMPARE
Potawatomi
French Canadian
Male Disability
Male Disability Comparison
Potawatomi
French Canadians
14.2%
MALE DISABILITY
0.0/ 100
METRIC RATING
327th/ 347
METRIC RANK
13.3%
MALE DISABILITY
0.0/ 100
METRIC RATING
305th/ 347
METRIC RANK
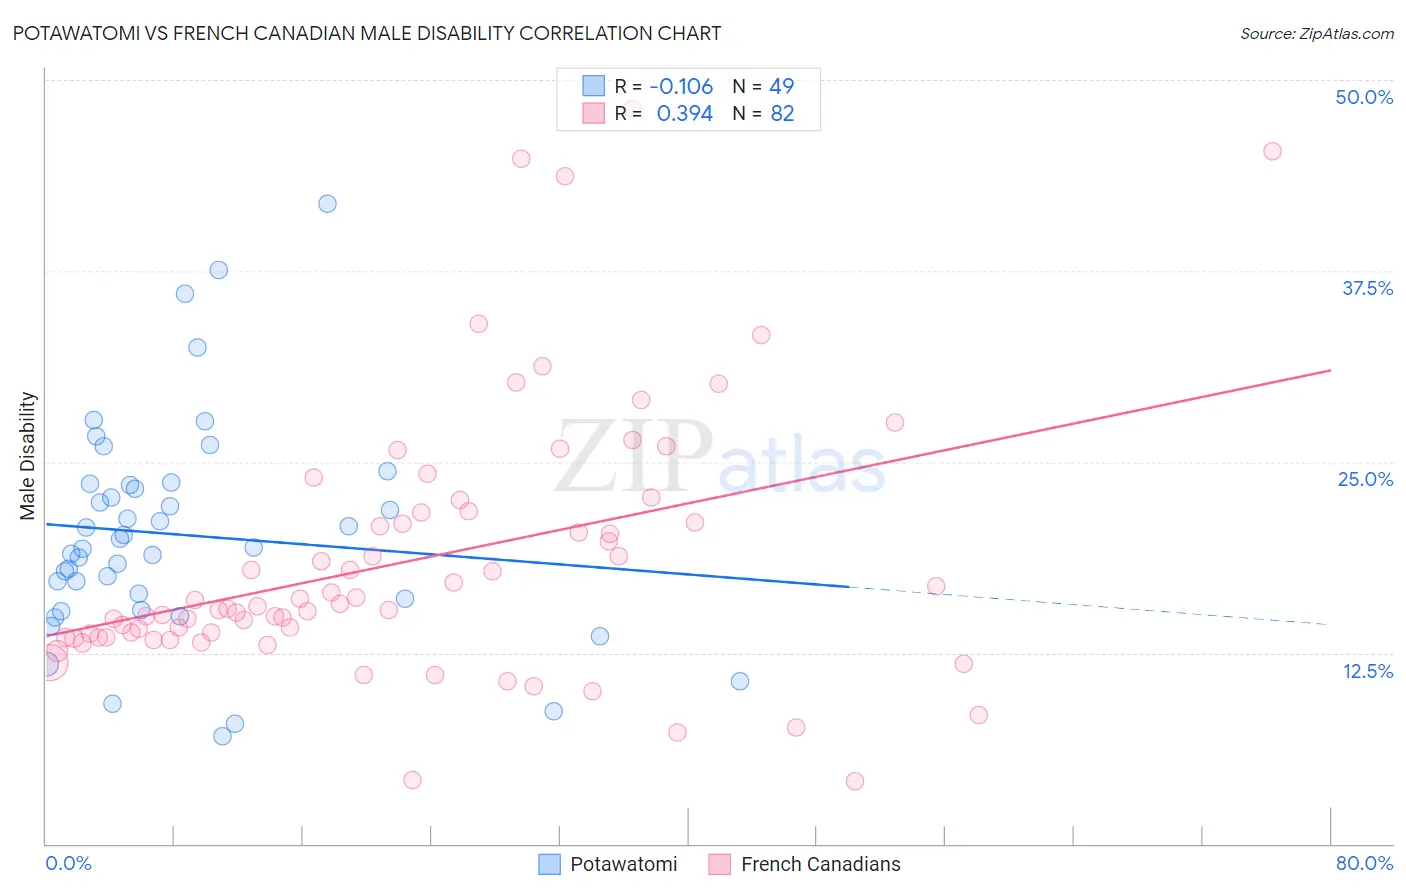
Potawatomi vs French Canadian Male Disability Correlation Chart
The statistical analysis conducted on geographies consisting of 117,764,083 people shows a poor negative correlation between the proportion of Potawatomi and percentage of males with a disability in the United States with a correlation coefficient (R) of -0.106 and weighted average of 14.2%. Similarly, the statistical analysis conducted on geographies consisting of 502,511,439 people shows a mild positive correlation between the proportion of French Canadians and percentage of males with a disability in the United States with a correlation coefficient (R) of 0.394 and weighted average of 13.3%, a difference of 7.0%.
Male Disability Correlation Summary
| Measurement | Potawatomi | French Canadian |
| Minimum | 7.0% | 4.1% |
| Maximum | 41.9% | 48.1% |
| Range | 34.9% | 44.0% |
| Mean | 20.2% | 18.5% |
| Median | 19.4% | 15.5% |
| Interquartile 25% (IQ1) | 15.7% | 13.5% |
| Interquartile 75% (IQ3) | 23.5% | 21.7% |
| Interquartile Range (IQR) | 7.8% | 8.2% |
| Standard Deviation (Sample) | 7.2% | 8.7% |
| Standard Deviation (Population) | 7.1% | 8.7% |
Similar Demographics by Male Disability
Demographics Similar to Potawatomi by Male Disability
In terms of male disability, the demographic groups most similar to Potawatomi are Native/Alaskan (14.2%, a difference of 0.10%), Chippewa (14.3%, a difference of 0.43%), Cajun (14.4%, a difference of 1.0%), Ottawa (14.1%, a difference of 1.1%), and Comanche (14.1%, a difference of 1.1%).
| Demographics | Rating | Rank | Male Disability |
| Tlingit-Haida | 0.0 /100 | #320 | Tragic 13.8% |
| Shoshone | 0.0 /100 | #321 | Tragic 13.8% |
| Apache | 0.0 /100 | #322 | Tragic 14.0% |
| Osage | 0.0 /100 | #323 | Tragic 14.0% |
| Comanche | 0.0 /100 | #324 | Tragic 14.1% |
| Ottawa | 0.0 /100 | #325 | Tragic 14.1% |
| Natives/Alaskans | 0.0 /100 | #326 | Tragic 14.2% |
| Potawatomi | 0.0 /100 | #327 | Tragic 14.2% |
| Chippewa | 0.0 /100 | #328 | Tragic 14.3% |
| Cajuns | 0.0 /100 | #329 | Tragic 14.4% |
| Navajo | 0.0 /100 | #330 | Tragic 14.4% |
| Tohono O'odham | 0.0 /100 | #331 | Tragic 14.6% |
| Seminole | 0.0 /100 | #332 | Tragic 14.7% |
| Yuman | 0.0 /100 | #333 | Tragic 14.7% |
| Cherokee | 0.0 /100 | #334 | Tragic 14.8% |
Demographics Similar to French Canadians by Male Disability
In terms of male disability, the demographic groups most similar to French Canadians are Spanish American (13.3%, a difference of 0.20%), Black/African American (13.2%, a difference of 0.41%), Arapaho (13.3%, a difference of 0.42%), French American Indian (13.4%, a difference of 0.58%), and Scotch-Irish (13.2%, a difference of 0.74%).
| Demographics | Rating | Rank | Male Disability |
| Pennsylvania Germans | 0.0 /100 | #298 | Tragic 13.0% |
| Celtics | 0.0 /100 | #299 | Tragic 13.0% |
| Cheyenne | 0.0 /100 | #300 | Tragic 13.0% |
| French | 0.0 /100 | #301 | Tragic 13.0% |
| Crow | 0.0 /100 | #302 | Tragic 13.1% |
| Scotch-Irish | 0.0 /100 | #303 | Tragic 13.2% |
| Blacks/African Americans | 0.0 /100 | #304 | Tragic 13.2% |
| French Canadians | 0.0 /100 | #305 | Tragic 13.3% |
| Spanish Americans | 0.0 /100 | #306 | Tragic 13.3% |
| Arapaho | 0.0 /100 | #307 | Tragic 13.3% |
| French American Indians | 0.0 /100 | #308 | Tragic 13.4% |
| Blackfeet | 0.0 /100 | #309 | Tragic 13.4% |
| Immigrants | Azores | 0.0 /100 | #310 | Tragic 13.4% |
| Delaware | 0.0 /100 | #311 | Tragic 13.5% |
| Yakama | 0.0 /100 | #312 | Tragic 13.5% |