Winslow, AZ
Winslow Map
Winslow Overview
8,943
TOTAL POPULATION
5,261
MALE POPULATION
3,682
FEMALE POPULATION
142.88
MALES / 100 FEMALES
69.99
FEMALES / 100 MALES
33.4
MEDIAN AGE
3.6
AVG FAMILY SIZE
2.8
AVG HOUSEHOLD SIZE
$17,339
PER CAPITA INCOME
$57,205
AVG FAMILY INCOME
$43,918
AVG HOUSEHOLD INCOME
8.4%
WAGE / INCOME GAP [ % ]
91.6¢/ $1
WAGE / INCOME GAP [ $ ]
$12,457
FAMILY INCOME DEFICIT
0.46
INEQUALITY / GINI INDEX
3,345
LABOR FORCE [ PEOPLE ]
49.7%
PERCENT IN LABOR FORCE
9.6%
UNEMPLOYMENT RATE
Winslow Zip Codes
Winslow Area Codes
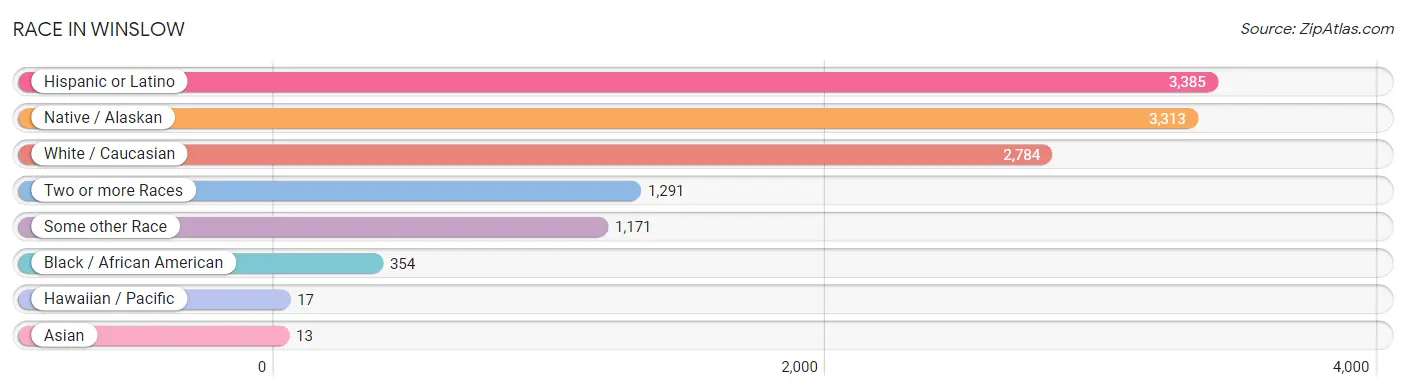
Race in Winslow
The most populous races in Winslow are Hispanic or Latino (3,385 | 37.9%), Native / Alaskan (3,313 | 37.0%), and White / Caucasian (2,784 | 31.1%).
| Race | # Population | % Population |
| Asian | 13 | 0.2% |
| Black / African American | 354 | 4.0% |
| Hawaiian / Pacific | 17 | 0.2% |
| Hispanic or Latino | 3,385 | 37.9% |
| Native / Alaskan | 3,313 | 37.0% |
| White / Caucasian | 2,784 | 31.1% |
| Two or more Races | 1,291 | 14.4% |
| Some other Race | 1,171 | 13.1% |
| Total | 8,943 | 100.0% |
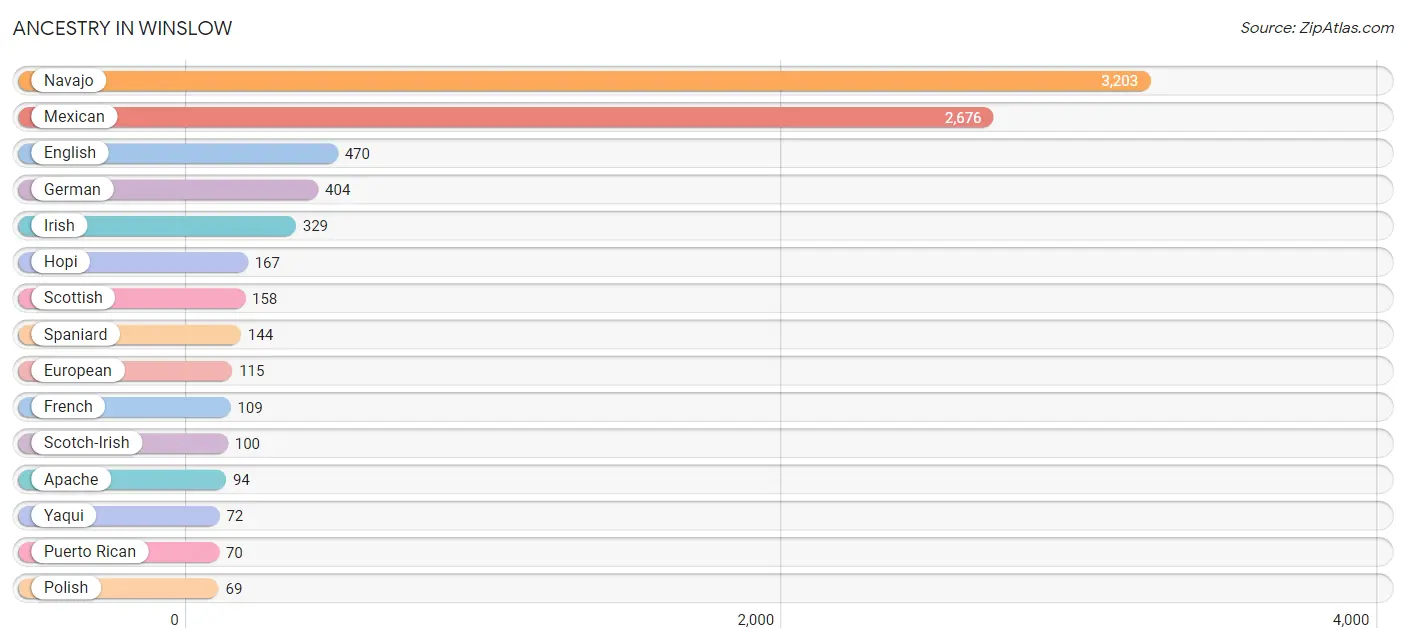
Ancestry in Winslow
The most populous ancestries reported in Winslow are Navajo (3,203 | 35.8%), Mexican (2,676 | 29.9%), English (470 | 5.3%), German (404 | 4.5%), and Irish (329 | 3.7%), together accounting for 79.2% of all Winslow residents.
| Ancestry | # Population | % Population |
| African | 15 | 0.2% |
| American | 66 | 0.7% |
| Apache | 94 | 1.1% |
| Arab | 30 | 0.3% |
| Belgian | 16 | 0.2% |
| Blackfeet | 7 | 0.1% |
| Canadian | 4 | 0.0% |
| Celtic | 7 | 0.1% |
| Central American | 12 | 0.1% |
| Cherokee | 26 | 0.3% |
| Choctaw | 28 | 0.3% |
| Creek | 34 | 0.4% |
| Czechoslovakian | 8 | 0.1% |
| Dutch | 48 | 0.5% |
| Egyptian | 21 | 0.2% |
| English | 470 | 5.3% |
| European | 115 | 1.3% |
| Finnish | 5 | 0.1% |
| French | 109 | 1.2% |
| French Canadian | 25 | 0.3% |
| German | 404 | 4.5% |
| Honduran | 12 | 0.1% |
| Hopi | 167 | 1.9% |
| Indian (Asian) | 27 | 0.3% |
| Iranian | 5 | 0.1% |
| Irish | 329 | 3.7% |
| Italian | 20 | 0.2% |
| Korean | 8 | 0.1% |
| Lithuanian | 9 | 0.1% |
| Mexican | 2,676 | 29.9% |
| Mexican American Indian | 2 | 0.0% |
| Navajo | 3,203 | 35.8% |
| Norwegian | 36 | 0.4% |
| Pennsylvania German | 23 | 0.3% |
| Pima | 10 | 0.1% |
| Polish | 69 | 0.8% |
| Pueblo | 51 | 0.6% |
| Puerto Rican | 70 | 0.8% |
| Russian | 36 | 0.4% |
| Scotch-Irish | 100 | 1.1% |
| Scottish | 158 | 1.8% |
| Spaniard | 144 | 1.6% |
| Spanish | 10 | 0.1% |
| Subsaharan African | 15 | 0.2% |
| Swedish | 37 | 0.4% |
| Tohono O'Odham | 8 | 0.1% |
| Turkish | 9 | 0.1% |
| Welsh | 9 | 0.1% |
| Yaqui | 72 | 0.8% | View All 49 Rows |
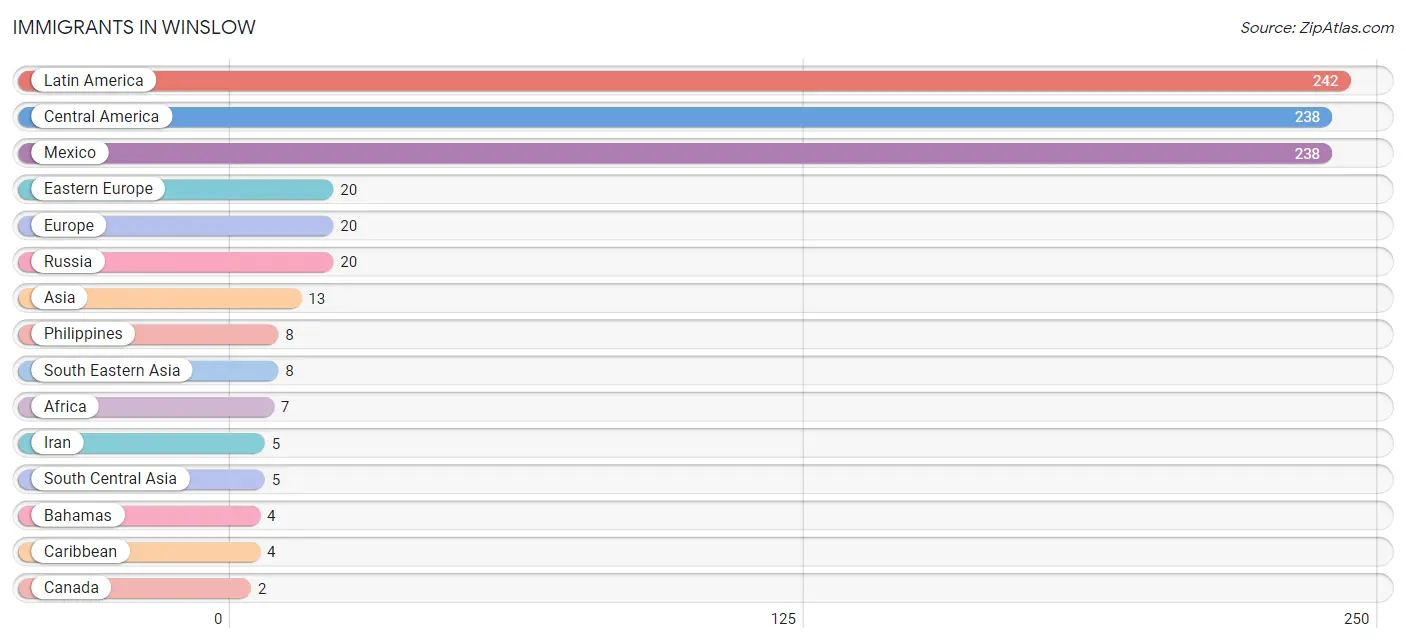
Immigrants in Winslow
The most numerous immigrant groups reported in Winslow came from Latin America (242 | 2.7%), Central America (238 | 2.7%), Mexico (238 | 2.7%), Eastern Europe (20 | 0.2%), and Europe (20 | 0.2%), together accounting for 8.5% of all Winslow residents.
| Immigration Origin | # Population | % Population |
| Africa | 7 | 0.1% |
| Asia | 13 | 0.2% |
| Bahamas | 4 | 0.0% |
| Canada | 2 | 0.0% |
| Caribbean | 4 | 0.0% |
| Central America | 238 | 2.7% |
| Eastern Europe | 20 | 0.2% |
| Europe | 20 | 0.2% |
| Iran | 5 | 0.1% |
| Latin America | 242 | 2.7% |
| Mexico | 238 | 2.7% |
| Philippines | 8 | 0.1% |
| Russia | 20 | 0.2% |
| South Central Asia | 5 | 0.1% |
| South Eastern Asia | 8 | 0.1% | View All 15 Rows |
Sex and Age in Winslow
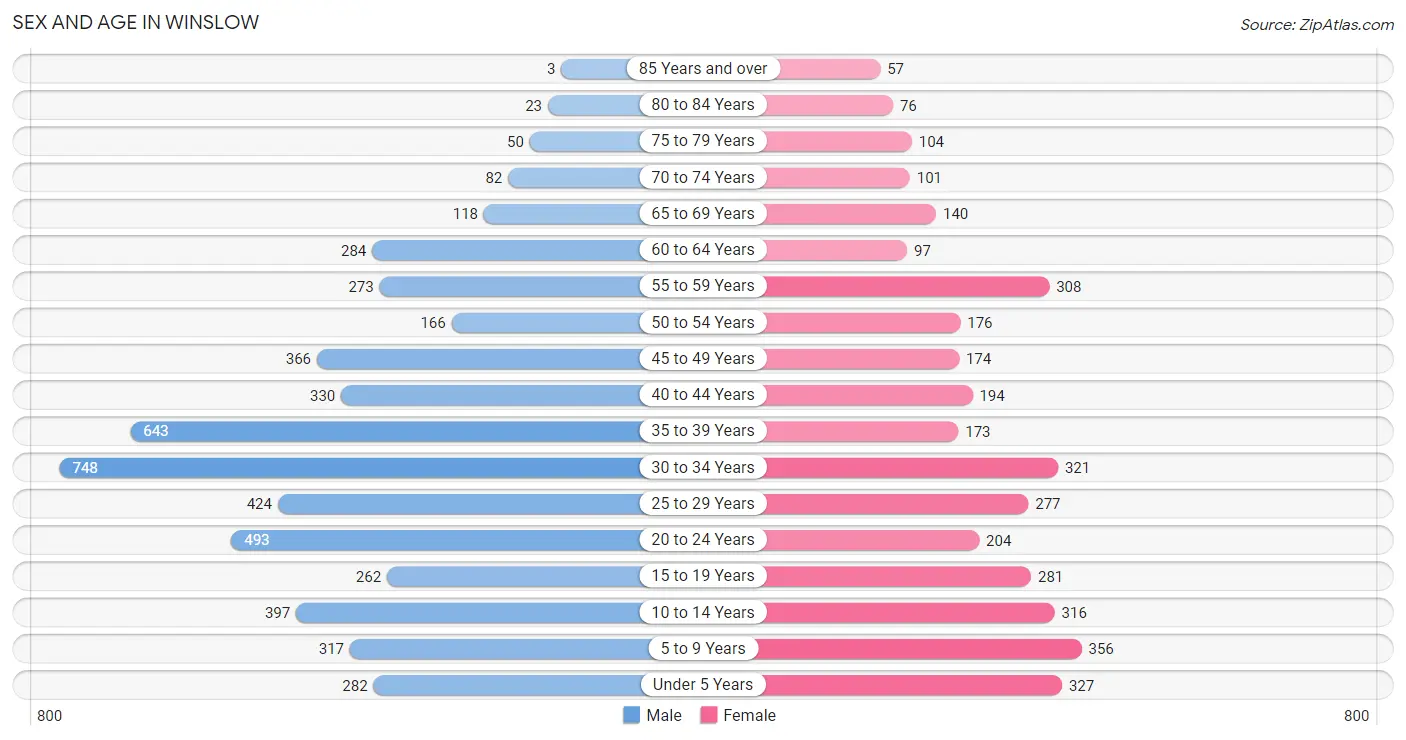
Sex and Age in Winslow
The most populous age groups in Winslow are 30 to 34 Years (748 | 14.2%) for men and 5 to 9 Years (356 | 9.7%) for women.
| Age Bracket | Male | Female |
| Under 5 Years | 282 (5.4%) | 327 (8.9%) |
| 5 to 9 Years | 317 (6.0%) | 356 (9.7%) |
| 10 to 14 Years | 397 (7.5%) | 316 (8.6%) |
| 15 to 19 Years | 262 (5.0%) | 281 (7.6%) |
| 20 to 24 Years | 493 (9.4%) | 204 (5.5%) |
| 25 to 29 Years | 424 (8.1%) | 277 (7.5%) |
| 30 to 34 Years | 748 (14.2%) | 321 (8.7%) |
| 35 to 39 Years | 643 (12.2%) | 173 (4.7%) |
| 40 to 44 Years | 330 (6.3%) | 194 (5.3%) |
| 45 to 49 Years | 366 (7.0%) | 174 (4.7%) |
| 50 to 54 Years | 166 (3.2%) | 176 (4.8%) |
| 55 to 59 Years | 273 (5.2%) | 308 (8.4%) |
| 60 to 64 Years | 284 (5.4%) | 97 (2.6%) |
| 65 to 69 Years | 118 (2.2%) | 140 (3.8%) |
| 70 to 74 Years | 82 (1.6%) | 101 (2.7%) |
| 75 to 79 Years | 50 (0.9%) | 104 (2.8%) |
| 80 to 84 Years | 23 (0.4%) | 76 (2.1%) |
| 85 Years and over | 3 (0.1%) | 57 (1.5%) |
| Total | 5,261 (100.0%) | 3,682 (100.0%) |
Families and Households in Winslow
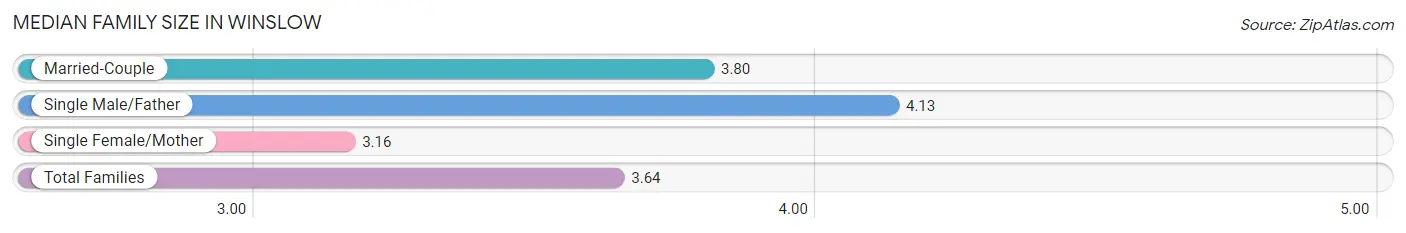
Median Family Size in Winslow
The median family size in Winslow is 3.64 persons per family, with single male/father families (251 | 14.9%) accounting for the largest median family size of 4.13 persons per family. On the other hand, single female/mother families (538 | 32.0%) represent the smallest median family size with 3.16 persons per family.
| Family Type | # Families | Family Size |
| Married-Couple | 890 (53.0%) | 3.80 |
| Single Male/Father | 251 (14.9%) | 4.13 |
| Single Female/Mother | 538 (32.0%) | 3.16 |
| Total Families | 1,679 (100.0%) | 3.64 |
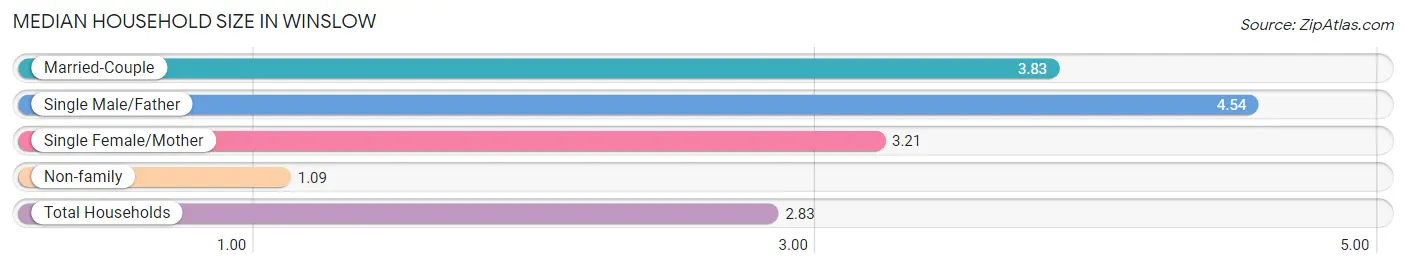
Median Household Size in Winslow
The median household size in Winslow is 2.83 persons per household, with single male/father households (251 | 9.9%) accounting for the largest median household size of 4.54 persons per household. non-family households (870 | 34.1%) represent the smallest median household size with 1.09 persons per household.
| Household Type | # Households | Household Size |
| Married-Couple | 890 (34.9%) | 3.83 |
| Single Male/Father | 251 (9.9%) | 4.54 |
| Single Female/Mother | 538 (21.1%) | 3.21 |
| Non-family | 870 (34.1%) | 1.09 |
| Total Households | 2,549 (100.0%) | 2.83 |
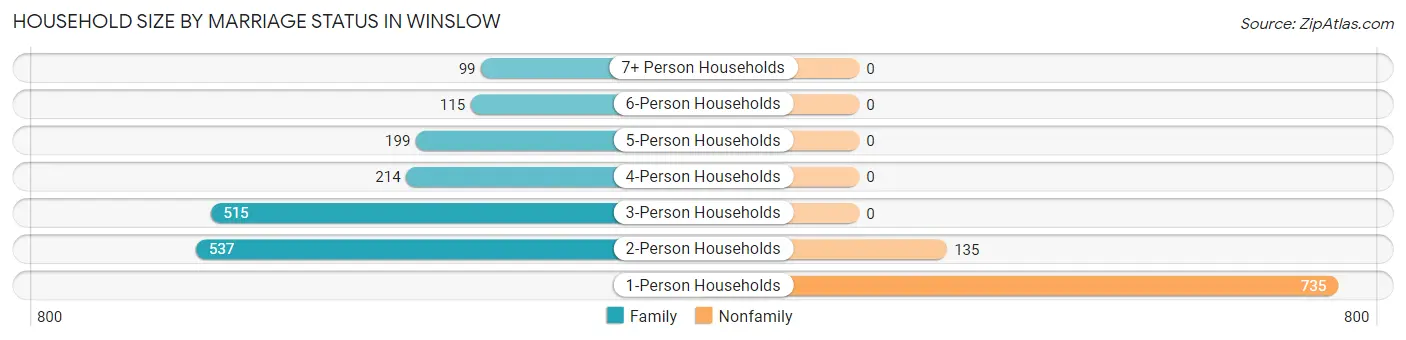
Household Size by Marriage Status in Winslow
Out of a total of 2,549 households in Winslow, 1,679 (65.9%) are family households, while 870 (34.1%) are nonfamily households. The most numerous type of family households are 2-person households, comprising 537, and the most common type of nonfamily households are 1-person households, comprising 735.
| Household Size | Family Households | Nonfamily Households |
| 1-Person Households | - | 735 (28.8%) |
| 2-Person Households | 537 (21.1%) | 135 (5.3%) |
| 3-Person Households | 515 (20.2%) | 0 (0.0%) |
| 4-Person Households | 214 (8.4%) | 0 (0.0%) |
| 5-Person Households | 199 (7.8%) | 0 (0.0%) |
| 6-Person Households | 115 (4.5%) | 0 (0.0%) |
| 7+ Person Households | 99 (3.9%) | 0 (0.0%) |
| Total | 1,679 (65.9%) | 870 (34.1%) |
Female Fertility in Winslow
Fertility by Age in Winslow
Average fertility rate in Winslow is 41.0 births per 1,000 women. Women in the age bracket of 20 to 34 years have the highest fertility rate with 61.0 births per 1,000 women. Women in the age bracket of 20 to 34 years acount for 71.0% of all women with births.
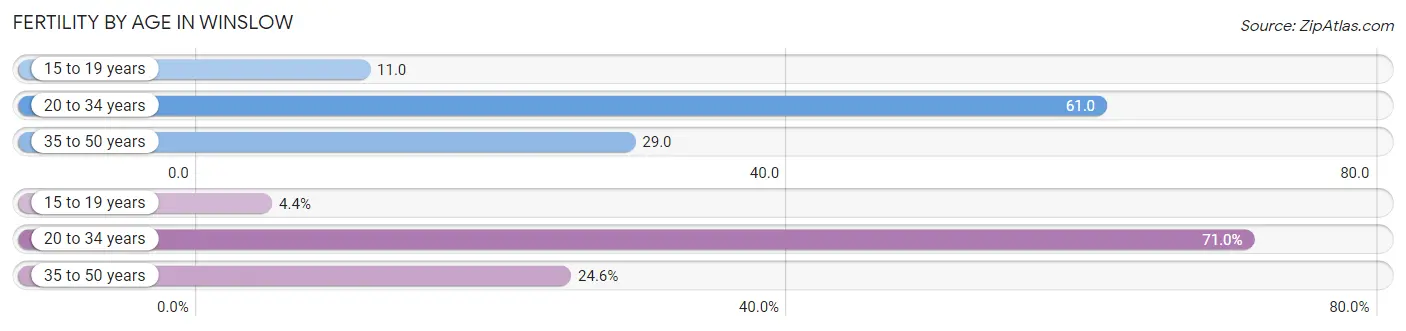
| Age Bracket | Women with Births | Births / 1,000 Women |
| 15 to 19 years | 3 (4.3%) | 11.0 |
| 20 to 34 years | 49 (71.0%) | 61.0 |
| 35 to 50 years | 17 (24.6%) | 29.0 |
| Total | 69 (100.0%) | 41.0 |
Fertility by Age by Marriage Status in Winslow
24.6% of women with births (69) in Winslow are married. The highest percentage of unmarried women with births falls into 15 to 19 years age bracket with 100.0% of them unmarried at the time of birth, while the lowest percentage of unmarried women with births belong to 20 to 34 years age bracket with 65.3% of them unmarried.
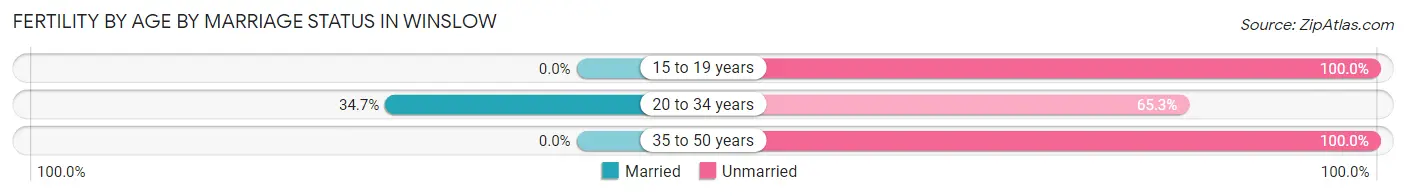
| Age Bracket | Married | Unmarried |
| 15 to 19 years | 0 (0.0%) | 3 (100.0%) |
| 20 to 34 years | 17 (34.7%) | 32 (65.3%) |
| 35 to 50 years | 0 (0.0%) | 17 (100.0%) |
| Total | 17 (24.6%) | 52 (75.4%) |
Fertility by Education in Winslow
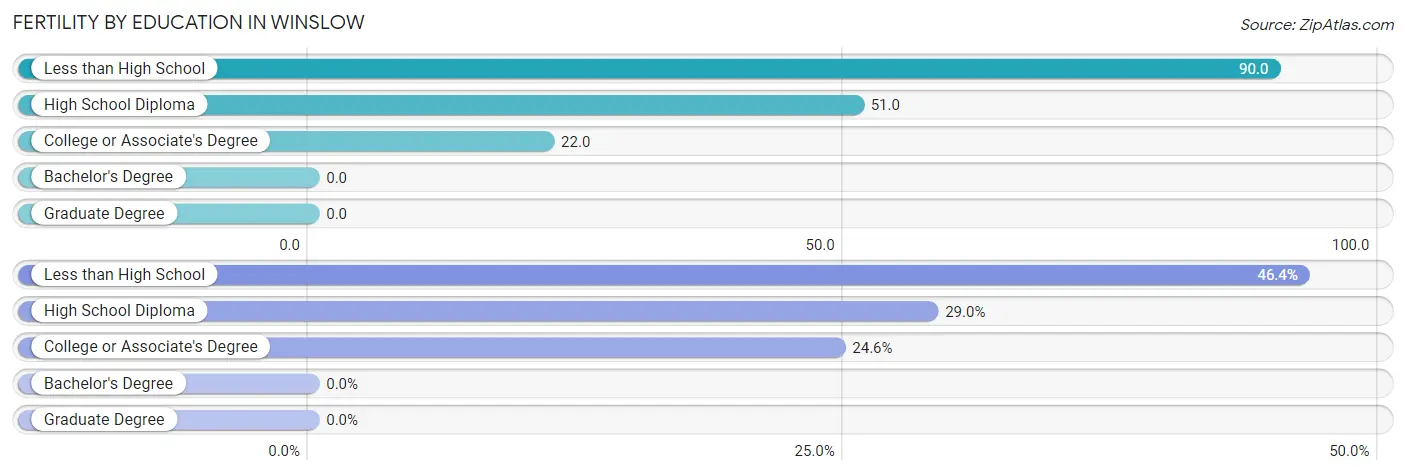
| Educational Attainment | Women with Births | Births / 1,000 Women |
| Less than High School | 32 (46.4%) | 90.0 |
| High School Diploma | 20 (29.0%) | 51.0 |
| College or Associate's Degree | 17 (24.6%) | 22.0 |
| Bachelor's Degree | 0 (0.0%) | 0.0 |
| Graduate Degree | 0 (0.0%) | 0.0 |
| Total | 69 (100.0%) | 41.0 |
Fertility by Education by Marriage Status in Winslow
75.4% of women with births in Winslow are unmarried. Women with the educational attainment of college or associate's degree are most likely to be married with 100.0% of them married at childbirth, while women with the educational attainment of less than high school are least likely to be married with 100.0% of them unmarried at childbirth.
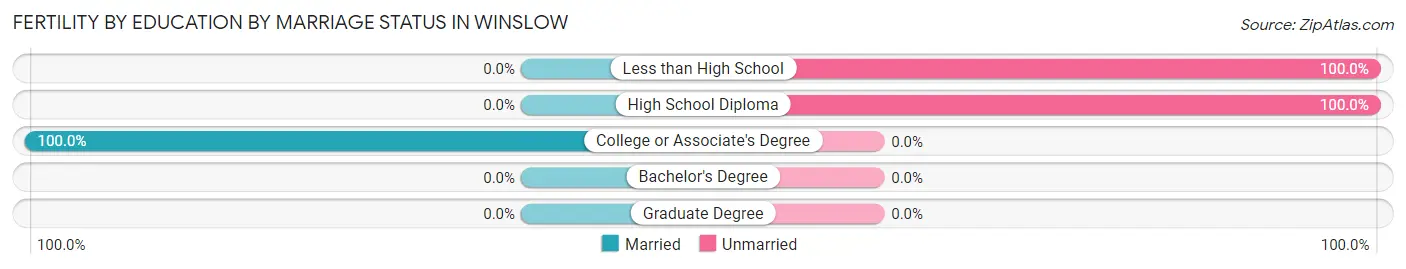
| Educational Attainment | Married | Unmarried |
| Less than High School | 0 (0.0%) | 32 (100.0%) |
| High School Diploma | 0 (0.0%) | 20 (100.0%) |
| College or Associate's Degree | 17 (100.0%) | 0 (0.0%) |
| Bachelor's Degree | 0 (0.0%) | 0 (0.0%) |
| Graduate Degree | 0 (0.0%) | 0 (0.0%) |
| Total | 17 (24.6%) | 52 (75.4%) |
Income in Winslow
Income Overview in Winslow
Per Capita Income in Winslow is $17,339, while median incomes of families and households are $57,205 and $43,918 respectively.
| Characteristic | Number | Measure |
| Per Capita Income | 8,943 | $17,339 |
| Median Family Income | 1,679 | $57,205 |
| Mean Family Income | 1,679 | $67,646 |
| Median Household Income | 2,549 | $43,918 |
| Mean Household Income | 2,549 | $57,000 |
| Income Deficit | 1,679 | $12,457 |
| Wage / Income Gap (%) | 8,943 | 8.38% |
| Wage / Income Gap ($) | 8,943 | 91.62¢ per $1 |
| Gini / Inequality Index | 8,943 | 0.46 |
Earnings by Sex in Winslow
Average Earnings in Winslow are $25,486, $26,317 for men and $24,111 for women, a difference of 8.4%.
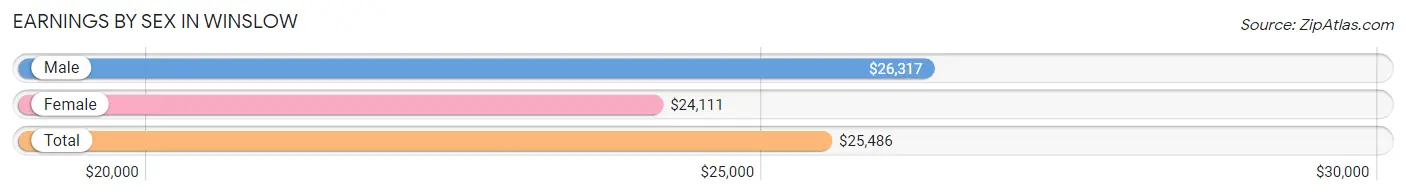
| Sex | Number | Average Earnings |
| Male | 2,024 (57.0%) | $26,317 |
| Female | 1,530 (43.0%) | $24,111 |
| Total | 3,554 (100.0%) | $25,486 |
Earnings by Sex by Income Bracket in Winslow
The most common earnings brackets in Winslow are $5,000 to $7,499 for men (217 | 10.7%) and $25,000 to $29,999 for women (200 | 13.1%).
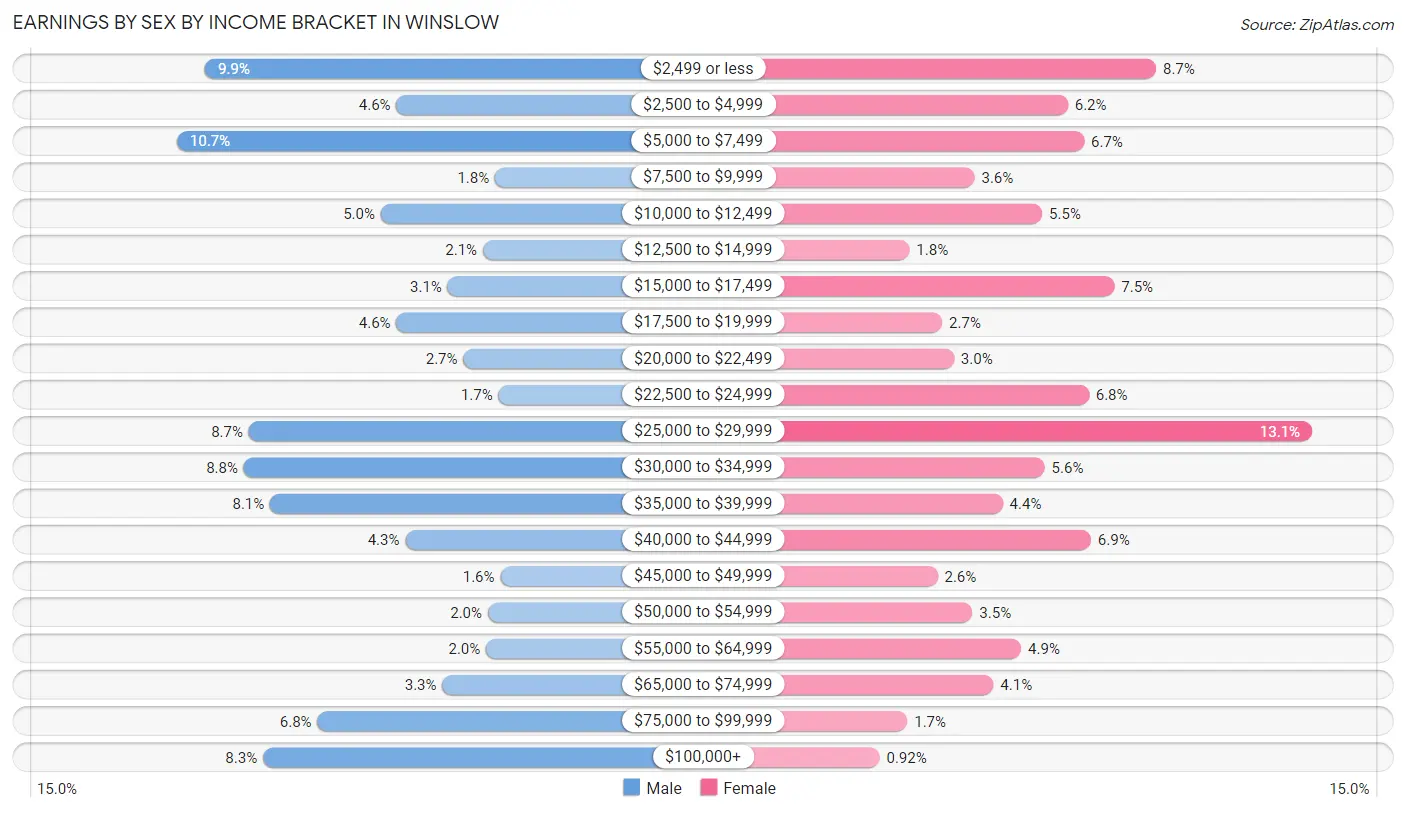
| Income | Male | Female |
| $2,499 or less | 201 (9.9%) | 133 (8.7%) |
| $2,500 to $4,999 | 92 (4.5%) | 95 (6.2%) |
| $5,000 to $7,499 | 217 (10.7%) | 102 (6.7%) |
| $7,500 to $9,999 | 36 (1.8%) | 55 (3.6%) |
| $10,000 to $12,499 | 101 (5.0%) | 84 (5.5%) |
| $12,500 to $14,999 | 43 (2.1%) | 27 (1.8%) |
| $15,000 to $17,499 | 63 (3.1%) | 115 (7.5%) |
| $17,500 to $19,999 | 92 (4.5%) | 41 (2.7%) |
| $20,000 to $22,499 | 54 (2.7%) | 46 (3.0%) |
| $22,500 to $24,999 | 34 (1.7%) | 104 (6.8%) |
| $25,000 to $29,999 | 176 (8.7%) | 200 (13.1%) |
| $30,000 to $34,999 | 179 (8.8%) | 85 (5.6%) |
| $35,000 to $39,999 | 164 (8.1%) | 67 (4.4%) |
| $40,000 to $44,999 | 87 (4.3%) | 105 (6.9%) |
| $45,000 to $49,999 | 33 (1.6%) | 39 (2.5%) |
| $50,000 to $54,999 | 40 (2.0%) | 54 (3.5%) |
| $55,000 to $64,999 | 41 (2.0%) | 75 (4.9%) |
| $65,000 to $74,999 | 66 (3.3%) | 63 (4.1%) |
| $75,000 to $99,999 | 137 (6.8%) | 26 (1.7%) |
| $100,000+ | 168 (8.3%) | 14 (0.9%) |
| Total | 2,024 (100.0%) | 1,530 (100.0%) |
Earnings by Sex by Educational Attainment in Winslow
Average earnings in Winslow are $28,510 for men and $26,326 for women, a difference of 7.7%. Men with an educational attainment of graduate degree enjoy the highest average annual earnings of $71,199, while those with high school diploma education earn the least with $24,205. Women with an educational attainment of graduate degree earn the most with the average annual earnings of $60,568, while those with high school diploma education have the smallest earnings of $23,661.
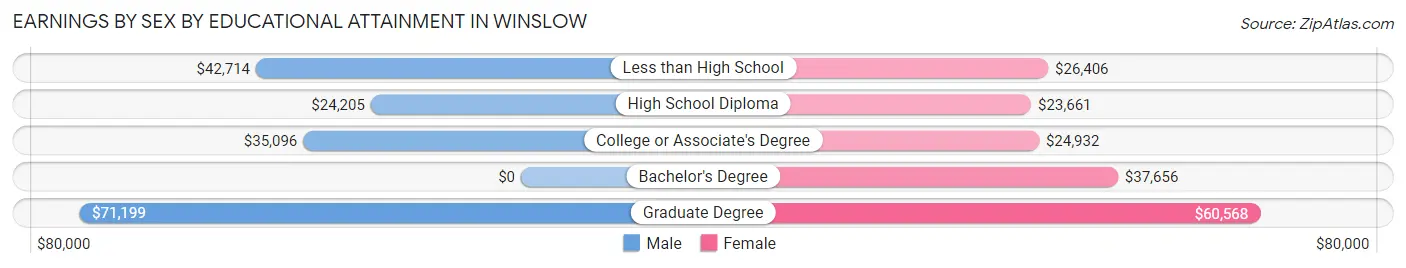
| Educational Attainment | Male Income | Female Income |
| Less than High School | $42,714 | $26,406 |
| High School Diploma | $24,205 | $23,661 |
| College or Associate's Degree | $35,096 | $24,932 |
| Bachelor's Degree | - | - |
| Graduate Degree | $71,199 | $60,568 |
| Total | $28,510 | $26,326 |
Family Income in Winslow
Family Income Brackets in Winslow
According to the Winslow family income data, there are 344 families falling into the $100,000 to $149,999 income range, which is the most common income bracket and makes up 20.5% of all families. Conversely, the $200,000+ income bracket is the least frequent group with only 7 families (0.4%) belonging to this category.
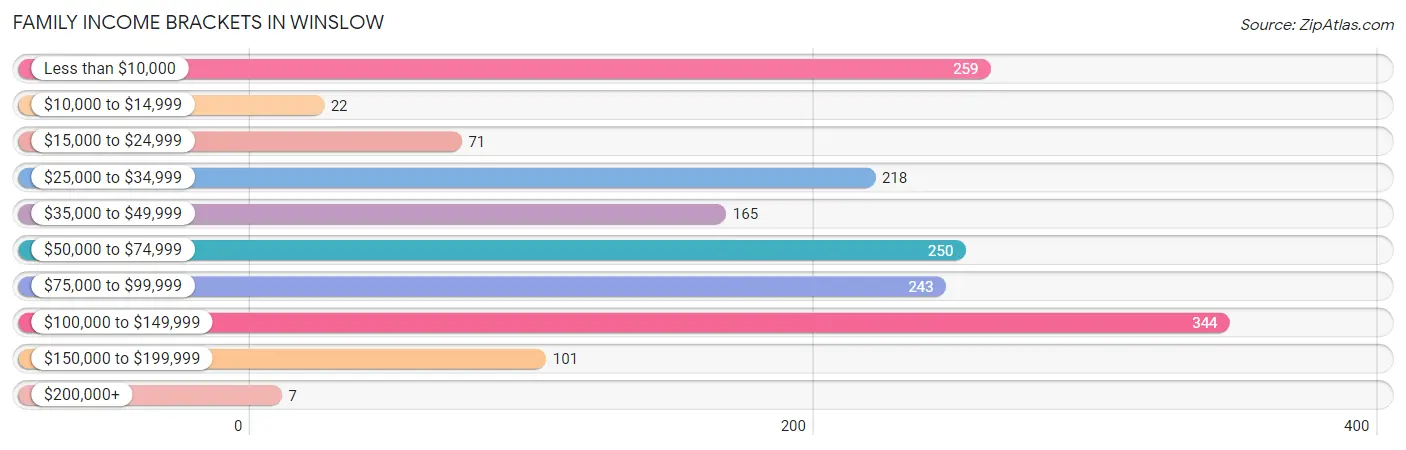
| Income Bracket | # Families | % Families |
| Less than $10,000 | 259 | 15.4% |
| $10,000 to $14,999 | 22 | 1.3% |
| $15,000 to $24,999 | 71 | 4.2% |
| $25,000 to $34,999 | 218 | 13.0% |
| $35,000 to $49,999 | 165 | 9.8% |
| $50,000 to $74,999 | 250 | 14.9% |
| $75,000 to $99,999 | 243 | 14.5% |
| $100,000 to $149,999 | 344 | 20.5% |
| $150,000 to $199,999 | 101 | 6.0% |
| $200,000+ | 7 | 0.4% |
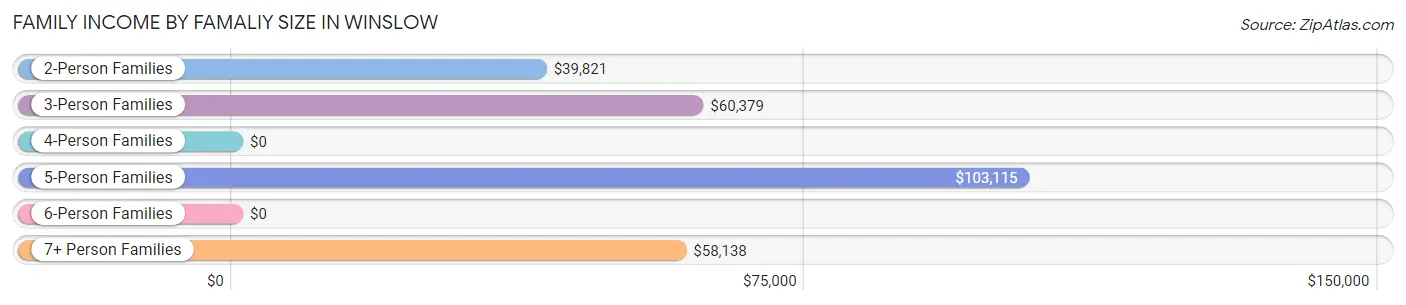
Family Income by Famaliy Size in Winslow
5-person families (174 | 10.4%) account for the highest median family income in Winslow with $103,115 per family, while 5-person families (174 | 10.4%) have the highest median income of $20,623 per family member.
| Income Bracket | # Families | Median Income |
| 2-Person Families | 598 (35.6%) | $39,821 |
| 3-Person Families | 492 (29.3%) | $60,379 |
| 4-Person Families | 201 (12.0%) | $0 |
| 5-Person Families | 174 (10.4%) | $103,115 |
| 6-Person Families | 115 (6.9%) | $0 |
| 7+ Person Families | 99 (5.9%) | $58,138 |
| Total | 1,679 (100.0%) | $57,205 |
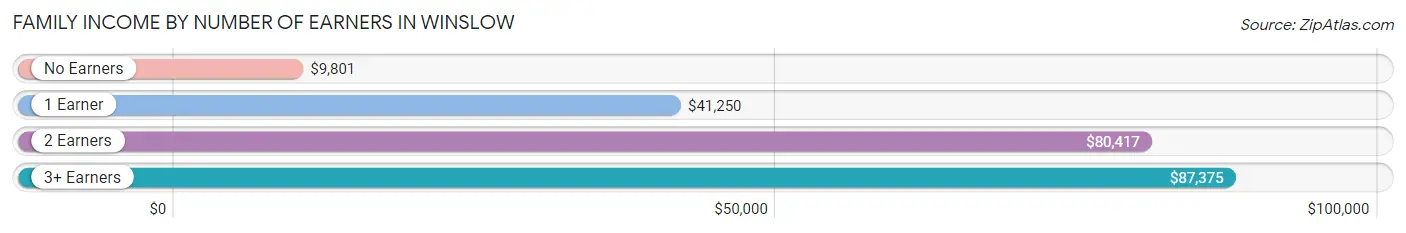
Family Income by Number of Earners in Winslow
The median family income in Winslow is $57,205, with families comprising 3+ earners (373) having the highest median family income of $87,375, while families with no earners (285) have the lowest median family income of $9,801, accounting for 22.2% and 17.0% of families, respectively.
| Number of Earners | # Families | Median Income |
| No Earners | 285 (17.0%) | $9,801 |
| 1 Earner | 583 (34.7%) | $41,250 |
| 2 Earners | 438 (26.1%) | $80,417 |
| 3+ Earners | 373 (22.2%) | $87,375 |
| Total | 1,679 (100.0%) | $57,205 |
Household Income in Winslow
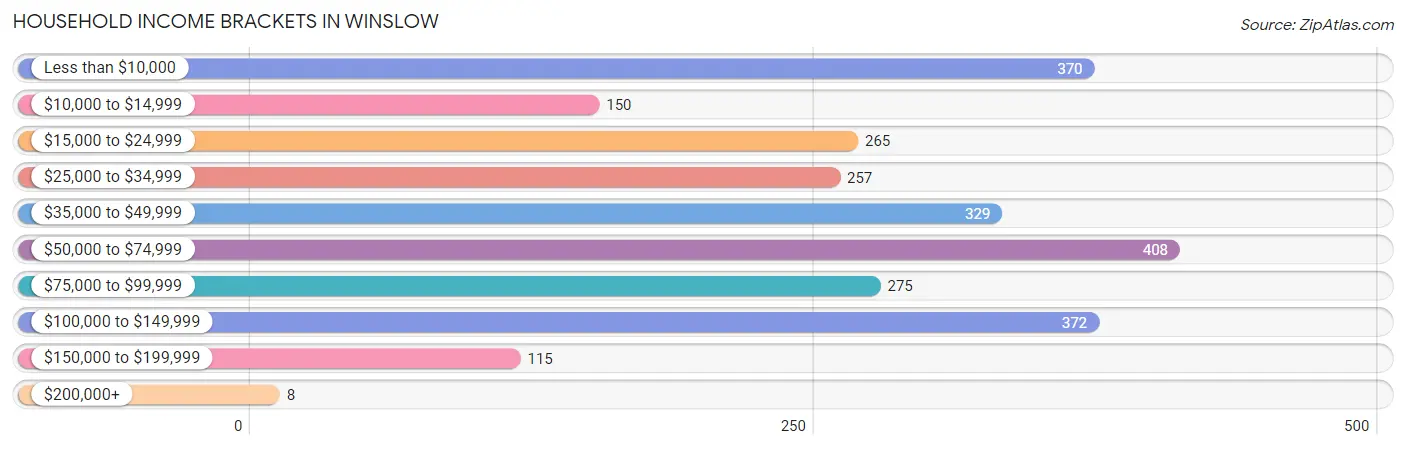
Household Income Brackets in Winslow
With 408 households falling in the category, the $50,000 to $74,999 income range is the most frequent in Winslow, accounting for 16.0% of all households. In contrast, only 8 households (0.3%) fall into the $200,000+ income bracket, making it the least populous group.
| Income Bracket | # Households | % Households |
| Less than $10,000 | 370 | 14.5% |
| $10,000 to $14,999 | 150 | 5.9% |
| $15,000 to $24,999 | 265 | 10.4% |
| $25,000 to $34,999 | 257 | 10.1% |
| $35,000 to $49,999 | 329 | 12.9% |
| $50,000 to $74,999 | 408 | 16.0% |
| $75,000 to $99,999 | 275 | 10.8% |
| $100,000 to $149,999 | 372 | 14.6% |
| $150,000 to $199,999 | 115 | 4.5% |
| $200,000+ | 8 | 0.3% |
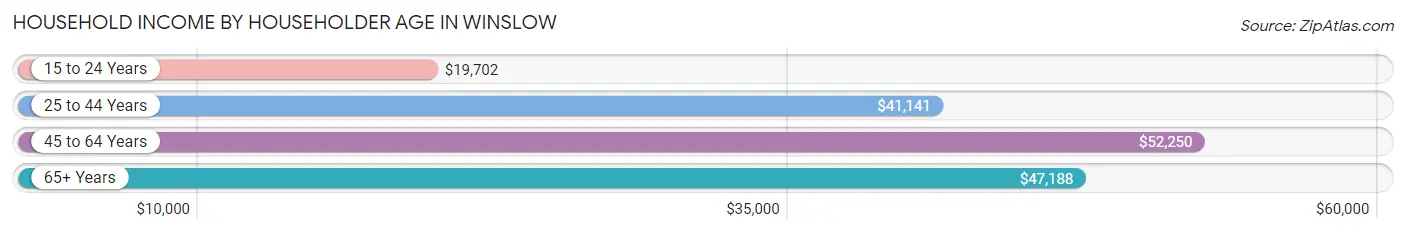
Household Income by Householder Age in Winslow
The median household income in Winslow is $43,918, with the highest median household income of $52,250 found in the 45 to 64 years age bracket for the primary householder. A total of 977 households (38.3%) fall into this category. Meanwhile, the 15 to 24 years age bracket for the primary householder has the lowest median household income of $19,702, with 130 households (5.1%) in this group.
| Income Bracket | # Households | Median Income |
| 15 to 24 Years | 130 (5.1%) | $19,702 |
| 25 to 44 Years | 986 (38.7%) | $41,141 |
| 45 to 64 Years | 977 (38.3%) | $52,250 |
| 65+ Years | 456 (17.9%) | $47,188 |
| Total | 2,549 (100.0%) | $43,918 |
Poverty in Winslow
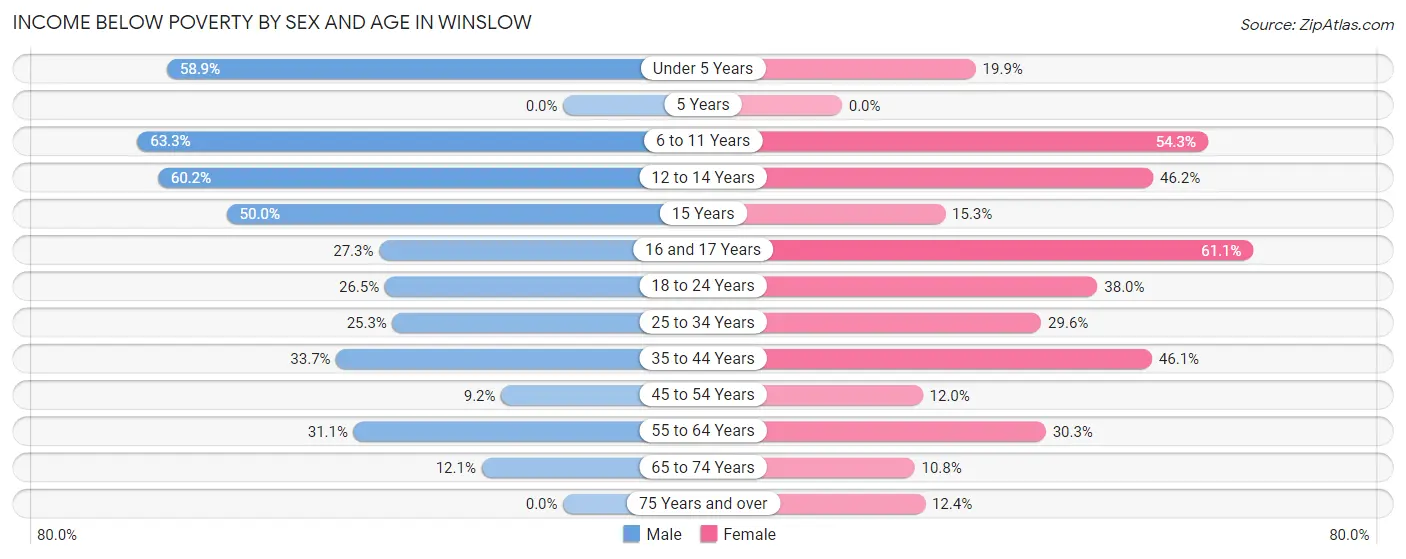
Income Below Poverty by Sex and Age in Winslow
With 32.8% poverty level for males and 30.3% for females among the residents of Winslow, 6 to 11 year old males and 16 and 17 year old females are the most vulnerable to poverty, with 260 males (63.3%) and 44 females (61.1%) in their respective age groups living below the poverty level.
| Age Bracket | Male | Female |
| Under 5 Years | 166 (58.9%) | 65 (19.9%) |
| 5 Years | 0 (0.0%) | 0 (0.0%) |
| 6 to 11 Years | 260 (63.3%) | 194 (54.3%) |
| 12 to 14 Years | 112 (60.2%) | 116 (46.2%) |
| 15 Years | 14 (50.0%) | 29 (15.3%) |
| 16 and 17 Years | 47 (27.3%) | 44 (61.1%) |
| 18 to 24 Years | 116 (26.5%) | 85 (38.0%) |
| 25 to 34 Years | 130 (25.3%) | 177 (29.6%) |
| 35 to 44 Years | 153 (33.7%) | 169 (46.1%) |
| 45 to 54 Years | 30 (9.2%) | 42 (12.0%) |
| 55 to 64 Years | 150 (31.1%) | 119 (30.3%) |
| 65 to 74 Years | 20 (12.1%) | 23 (10.8%) |
| 75 Years and over | 0 (0.0%) | 21 (12.3%) |
| Total | 1,198 (32.8%) | 1,084 (30.3%) |
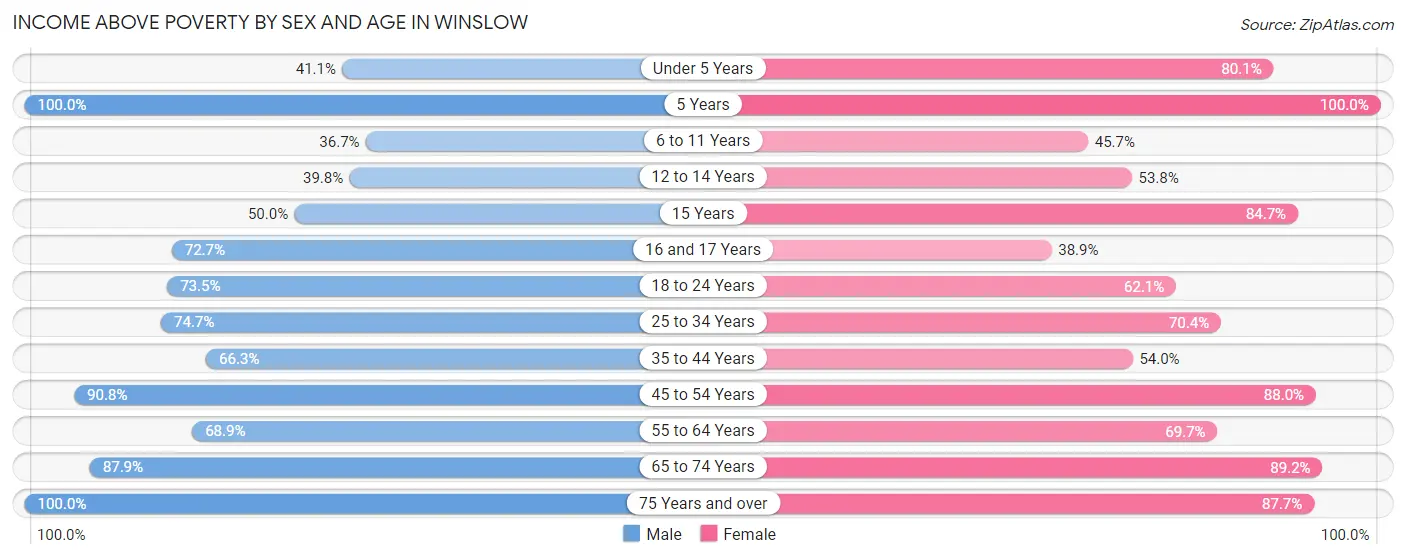
Income Above Poverty by Sex and Age in Winslow
According to the poverty statistics in Winslow, males aged 5 years and females aged 5 years are the age groups that are most secure financially, with 100.0% of males and 100.0% of females in these age groups living above the poverty line.
| Age Bracket | Male | Female |
| Under 5 Years | 116 (41.1%) | 262 (80.1%) |
| 5 Years | 117 (100.0%) | 64 (100.0%) |
| 6 to 11 Years | 151 (36.7%) | 163 (45.7%) |
| 12 to 14 Years | 74 (39.8%) | 135 (53.8%) |
| 15 Years | 14 (50.0%) | 160 (84.7%) |
| 16 and 17 Years | 125 (72.7%) | 28 (38.9%) |
| 18 to 24 Years | 322 (73.5%) | 139 (62.1%) |
| 25 to 34 Years | 383 (74.7%) | 421 (70.4%) |
| 35 to 44 Years | 301 (66.3%) | 198 (53.9%) |
| 45 to 54 Years | 296 (90.8%) | 308 (88.0%) |
| 55 to 64 Years | 332 (68.9%) | 274 (69.7%) |
| 65 to 74 Years | 145 (87.9%) | 190 (89.2%) |
| 75 Years and over | 76 (100.0%) | 149 (87.6%) |
| Total | 2,452 (67.2%) | 2,491 (69.7%) |
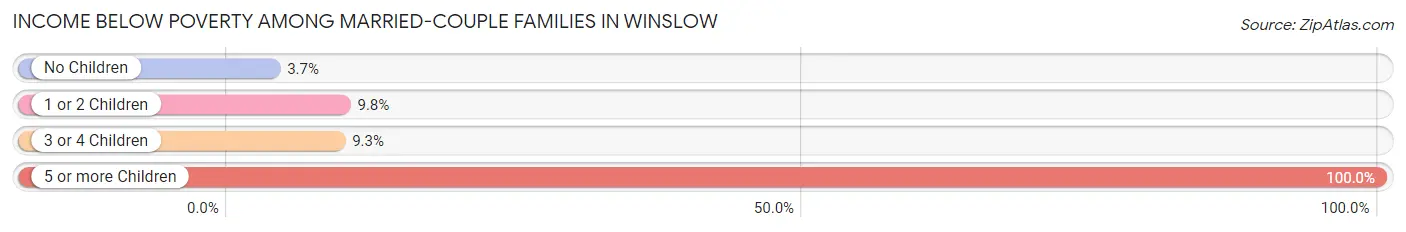
Income Below Poverty Among Married-Couple Families in Winslow
The poverty statistics for married-couple families in Winslow show that 9.3% or 83 of the total 890 families live below the poverty line. Families with 5 or more children have the highest poverty rate of 100.0%, comprising of 22 families. On the other hand, families with no children have the lowest poverty rate of 3.7%, which includes 14 families.
| Children | Above Poverty | Below Poverty |
| No Children | 367 (96.3%) | 14 (3.7%) |
| 1 or 2 Children | 304 (90.2%) | 33 (9.8%) |
| 3 or 4 Children | 136 (90.7%) | 14 (9.3%) |
| 5 or more Children | 0 (0.0%) | 22 (100.0%) |
| Total | 807 (90.7%) | 83 (9.3%) |
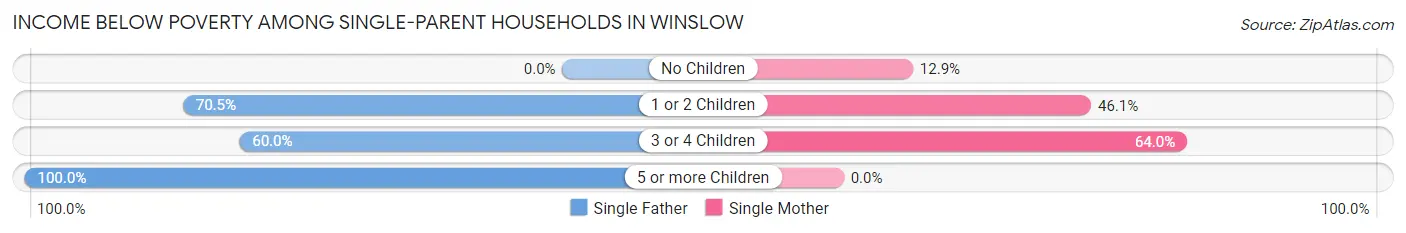
Income Below Poverty Among Single-Parent Households in Winslow
According to the poverty data in Winslow, 51.0% or 128 single-father households and 47.0% or 253 single-mother households are living below the poverty line. Among single-father households, those with 5 or more children have the highest poverty rate, with 49 households (100.0%) experiencing poverty. Likewise, among single-mother households, those with 3 or 4 children have the highest poverty rate, with 55 households (63.9%) falling below the poverty line.
| Children | Single Father | Single Mother |
| No Children | 0 (0.0%) | 4 (12.9%) |
| 1 or 2 Children | 67 (70.5%) | 194 (46.1%) |
| 3 or 4 Children | 12 (60.0%) | 55 (63.9%) |
| 5 or more Children | 49 (100.0%) | 0 (0.0%) |
| Total | 128 (51.0%) | 253 (47.0%) |
Income Below Poverty Among Married-Couple vs Single-Parent Households in Winslow
The poverty data for Winslow shows that 83 of the married-couple family households (9.3%) and 381 of the single-parent households (48.3%) are living below the poverty level. Within the married-couple family households, those with 5 or more children have the highest poverty rate, with 22 households (100.0%) falling below the poverty line. Among the single-parent households, those with 5 or more children have the highest poverty rate, with 49 household (100.0%) living below poverty.
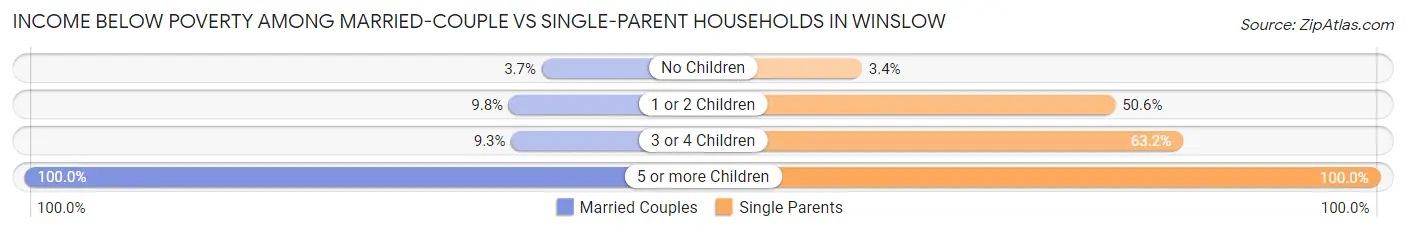
| Children | Married-Couple Families | Single-Parent Households |
| No Children | 14 (3.7%) | 4 (3.4%) |
| 1 or 2 Children | 33 (9.8%) | 261 (50.6%) |
| 3 or 4 Children | 14 (9.3%) | 67 (63.2%) |
| 5 or more Children | 22 (100.0%) | 49 (100.0%) |
| Total | 83 (9.3%) | 381 (48.3%) |
Employment Characteristics in Winslow
Employment by Class of Employer in Winslow
Among the 2,914 employed individuals in Winslow, private company employees (1,591 | 54.6%), local government employees (528 | 18.1%), and not-for-profit organizations (272 | 9.3%) make up the most common classes of employment.
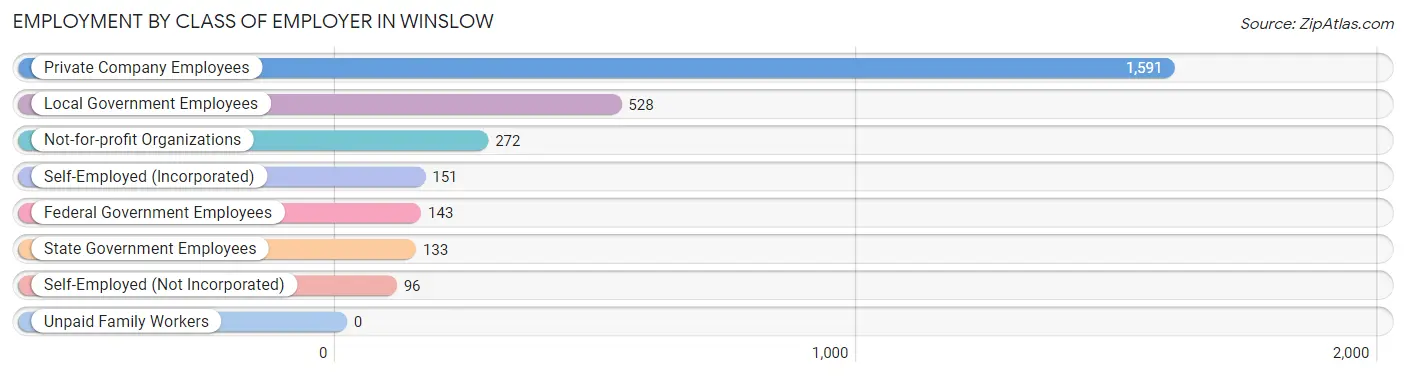
| Employer Class | # Employees | % Employees |
| Private Company Employees | 1,591 | 54.6% |
| Self-Employed (Incorporated) | 151 | 5.2% |
| Self-Employed (Not Incorporated) | 96 | 3.3% |
| Not-for-profit Organizations | 272 | 9.3% |
| Local Government Employees | 528 | 18.1% |
| State Government Employees | 133 | 4.6% |
| Federal Government Employees | 143 | 4.9% |
| Unpaid Family Workers | 0 | 0.0% |
| Total | 2,914 | 100.0% |
Employment Status by Age in Winslow
According to the labor force statistics for Winslow, out of the total population over 16 years of age (6,731), 49.7% or 3,345 individuals are in the labor force, with 9.6% or 321 of them unemployed. The age group with the highest labor force participation rate is 20 to 24 years, with 66.4% or 463 individuals in the labor force. Within the labor force, the 16 to 19 years age range has the highest percentage of unemployed individuals, with 41.9% or 52 of them being unemployed.
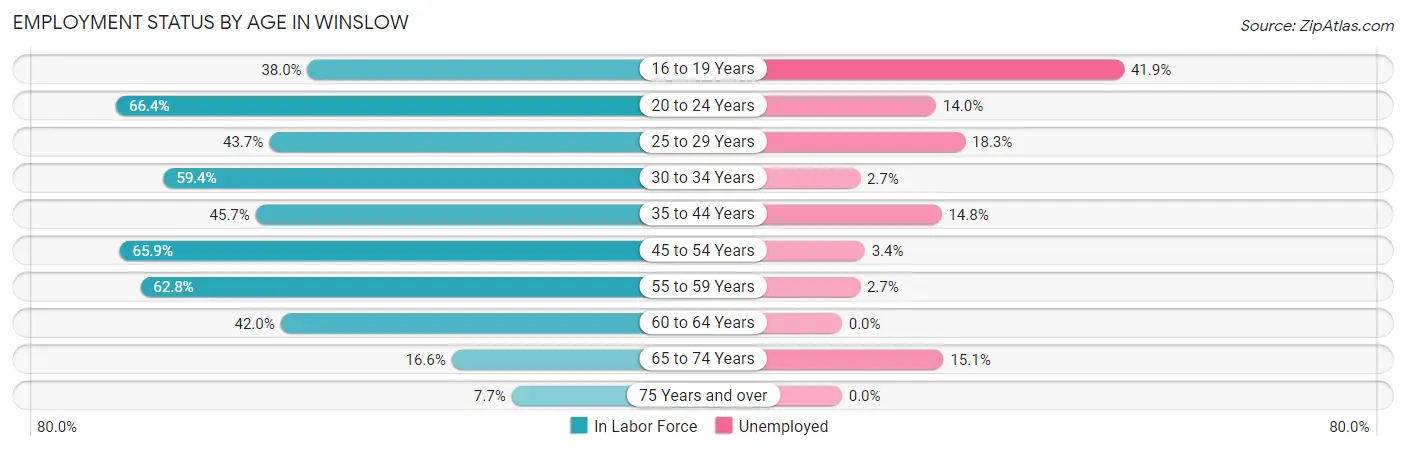
| Age Bracket | In Labor Force | Unemployed |
| 16 to 19 Years | 124 (38.0%) | 52 (41.9%) |
| 20 to 24 Years | 463 (66.4%) | 65 (14.0%) |
| 25 to 29 Years | 306 (43.7%) | 56 (18.3%) |
| 30 to 34 Years | 635 (59.4%) | 17 (2.7%) |
| 35 to 44 Years | 612 (45.7%) | 91 (14.8%) |
| 45 to 54 Years | 581 (65.9%) | 20 (3.4%) |
| 55 to 59 Years | 365 (62.8%) | 10 (2.7%) |
| 60 to 64 Years | 160 (42.0%) | 0 (0.0%) |
| 65 to 74 Years | 73 (16.6%) | 11 (15.1%) |
| 75 Years and over | 24 (7.7%) | 0 (0.0%) |
| Total | 3,345 (49.7%) | 321 (9.6%) |
Employment Status by Educational Attainment in Winslow
According to labor force statistics for Winslow, 53.7% of individuals (2,660) out of the total population between 25 and 64 years of age (4,954) are in the labor force, with 7.3% or 194 of them being unemployed. The group with the highest labor force participation rate are those with the educational attainment of bachelor's degree or higher, with 90.6% or 288 individuals in the labor force. Within the labor force, individuals with high school diploma education have the highest percentage of unemployment, with 10.5% or 95 of them being unemployed.
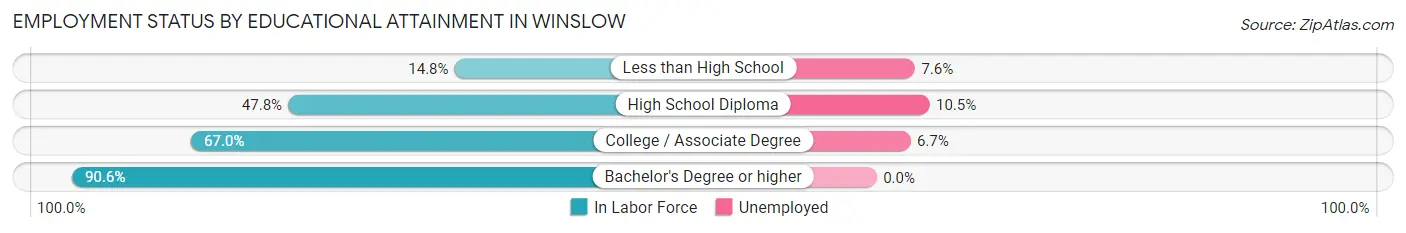
| Educational Attainment | In Labor Force | Unemployed |
| Less than High School | 105 (14.8%) | 54 (7.6%) |
| High School Diploma | 904 (47.8%) | 199 (10.5%) |
| College / Associate Degree | 1,365 (67.0%) | 136 (6.7%) |
| Bachelor's Degree or higher | 288 (90.6%) | 0 (0.0%) |
| Total | 2,660 (53.7%) | 362 (7.3%) |
Employment Occupations by Sex in Winslow
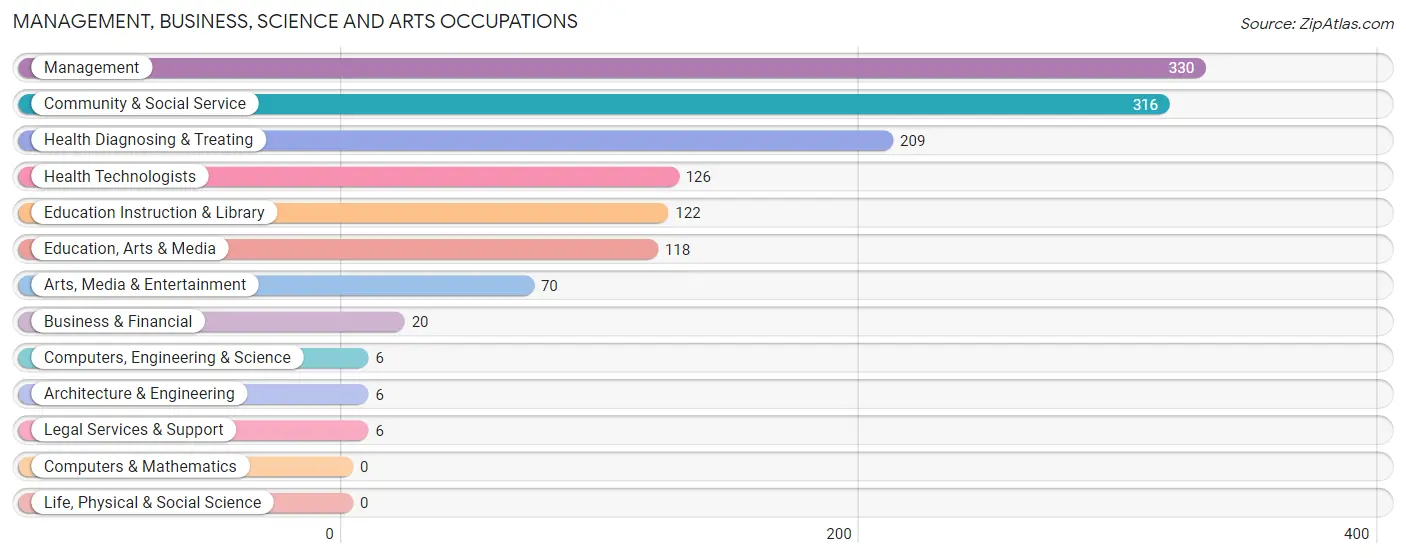
Management, Business, Science and Arts Occupations
The most common Management, Business, Science and Arts occupations in Winslow are Management (330 | 10.9%), Community & Social Service (316 | 10.5%), Health Diagnosing & Treating (209 | 6.9%), Health Technologists (126 | 4.2%), and Education Instruction & Library (122 | 4.0%).
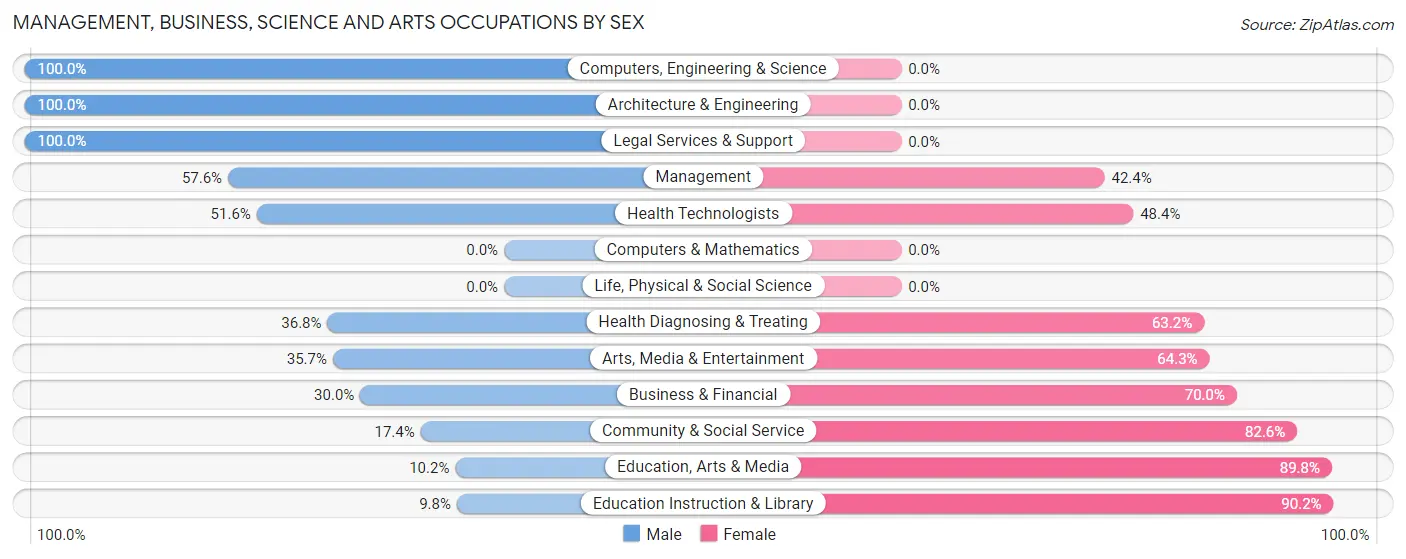
Management, Business, Science and Arts Occupations by Sex
Within the Management, Business, Science and Arts occupations in Winslow, the most male-oriented occupations are Computers, Engineering & Science (100.0%), Architecture & Engineering (100.0%), and Legal Services & Support (100.0%), while the most female-oriented occupations are Education Instruction & Library (90.2%), Education, Arts & Media (89.8%), and Community & Social Service (82.6%).
| Occupation | Male | Female |
| Management | 190 (57.6%) | 140 (42.4%) |
| Business & Financial | 6 (30.0%) | 14 (70.0%) |
| Computers, Engineering & Science | 6 (100.0%) | 0 (0.0%) |
| Computers & Mathematics | 0 (0.0%) | 0 (0.0%) |
| Architecture & Engineering | 6 (100.0%) | 0 (0.0%) |
| Life, Physical & Social Science | 0 (0.0%) | 0 (0.0%) |
| Community & Social Service | 55 (17.4%) | 261 (82.6%) |
| Education, Arts & Media | 12 (10.2%) | 106 (89.8%) |
| Legal Services & Support | 6 (100.0%) | 0 (0.0%) |
| Education Instruction & Library | 12 (9.8%) | 110 (90.2%) |
| Arts, Media & Entertainment | 25 (35.7%) | 45 (64.3%) |
| Health Diagnosing & Treating | 77 (36.8%) | 132 (63.2%) |
| Health Technologists | 65 (51.6%) | 61 (48.4%) |
| Total (Category) | 334 (37.9%) | 547 (62.1%) |
| Total (Overall) | 1,581 (52.3%) | 1,441 (47.7%) |
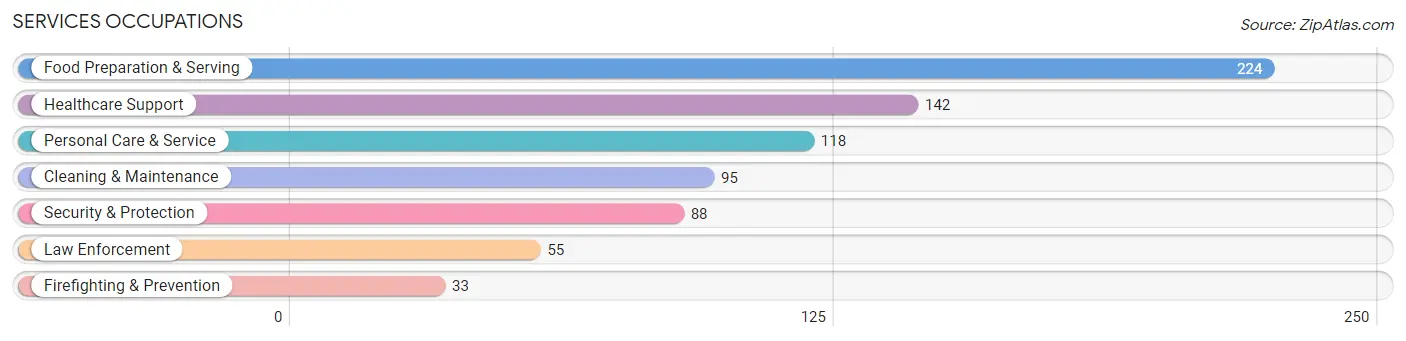
Services Occupations
The most common Services occupations in Winslow are Food Preparation & Serving (224 | 7.4%), Healthcare Support (142 | 4.7%), Personal Care & Service (118 | 3.9%), Cleaning & Maintenance (95 | 3.1%), and Security & Protection (88 | 2.9%).
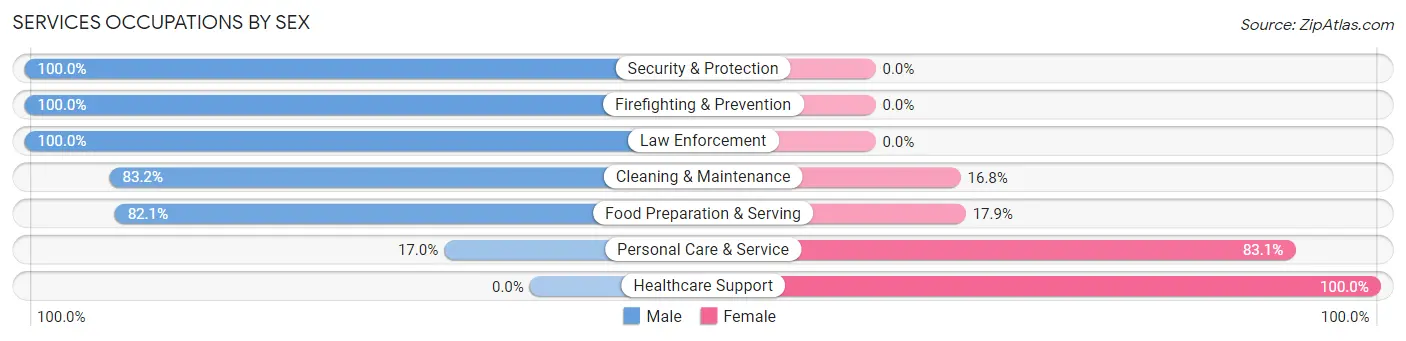
Services Occupations by Sex
Within the Services occupations in Winslow, the most male-oriented occupations are Security & Protection (100.0%), Firefighting & Prevention (100.0%), and Law Enforcement (100.0%), while the most female-oriented occupations are Healthcare Support (100.0%), Personal Care & Service (83.1%), and Food Preparation & Serving (17.9%).
| Occupation | Male | Female |
| Healthcare Support | 0 (0.0%) | 142 (100.0%) |
| Security & Protection | 88 (100.0%) | 0 (0.0%) |
| Firefighting & Prevention | 33 (100.0%) | 0 (0.0%) |
| Law Enforcement | 55 (100.0%) | 0 (0.0%) |
| Food Preparation & Serving | 184 (82.1%) | 40 (17.9%) |
| Cleaning & Maintenance | 79 (83.2%) | 16 (16.8%) |
| Personal Care & Service | 20 (17.0%) | 98 (83.1%) |
| Total (Category) | 371 (55.6%) | 296 (44.4%) |
| Total (Overall) | 1,581 (52.3%) | 1,441 (47.7%) |
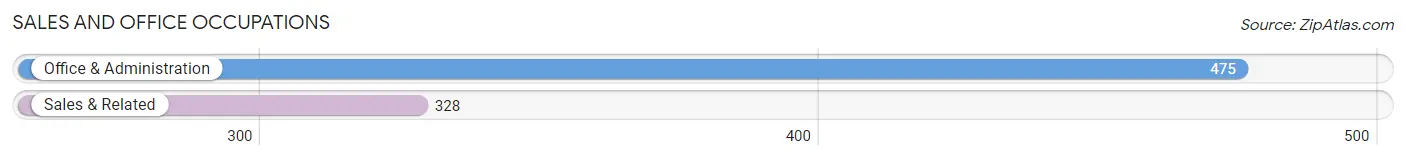
Sales and Office Occupations
The most common Sales and Office occupations in Winslow are Office & Administration (475 | 15.7%), and Sales & Related (328 | 10.8%).
Sales and Office Occupations by Sex
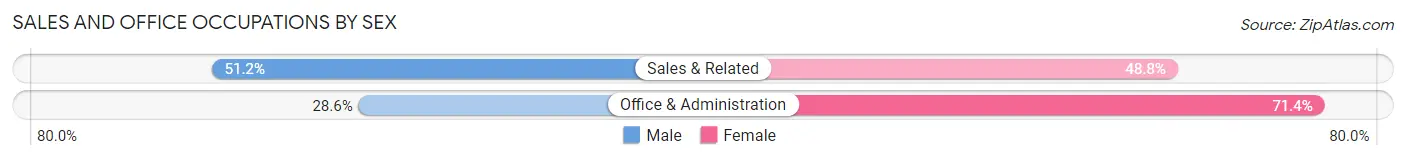
| Occupation | Male | Female |
| Sales & Related | 168 (51.2%) | 160 (48.8%) |
| Office & Administration | 136 (28.6%) | 339 (71.4%) |
| Total (Category) | 304 (37.9%) | 499 (62.1%) |
| Total (Overall) | 1,581 (52.3%) | 1,441 (47.7%) |
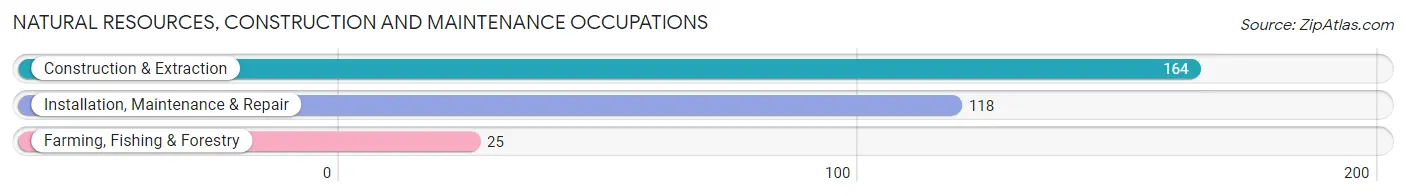
Natural Resources, Construction and Maintenance Occupations
The most common Natural Resources, Construction and Maintenance occupations in Winslow are Construction & Extraction (164 | 5.4%), Installation, Maintenance & Repair (118 | 3.9%), and Farming, Fishing & Forestry (25 | 0.8%).
Natural Resources, Construction and Maintenance Occupations by Sex
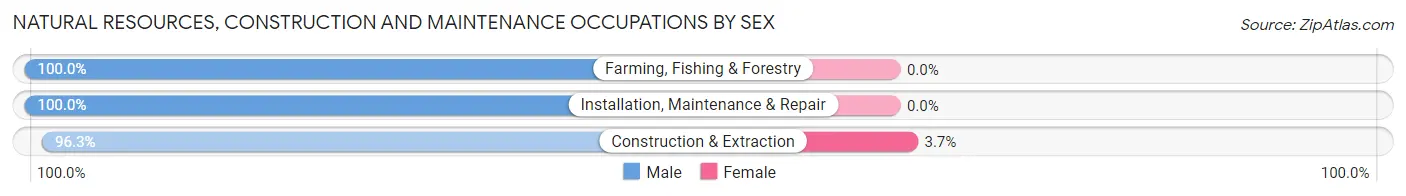
| Occupation | Male | Female |
| Farming, Fishing & Forestry | 25 (100.0%) | 0 (0.0%) |
| Construction & Extraction | 158 (96.3%) | 6 (3.7%) |
| Installation, Maintenance & Repair | 118 (100.0%) | 0 (0.0%) |
| Total (Category) | 301 (98.1%) | 6 (1.9%) |
| Total (Overall) | 1,581 (52.3%) | 1,441 (47.7%) |
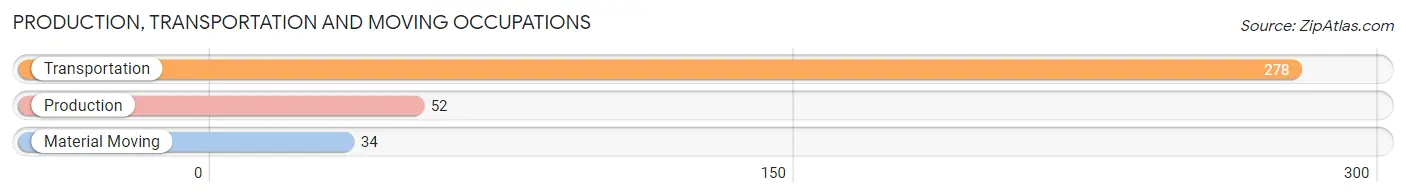
Production, Transportation and Moving Occupations
The most common Production, Transportation and Moving occupations in Winslow are Transportation (278 | 9.2%), Production (52 | 1.7%), and Material Moving (34 | 1.1%).
Production, Transportation and Moving Occupations by Sex
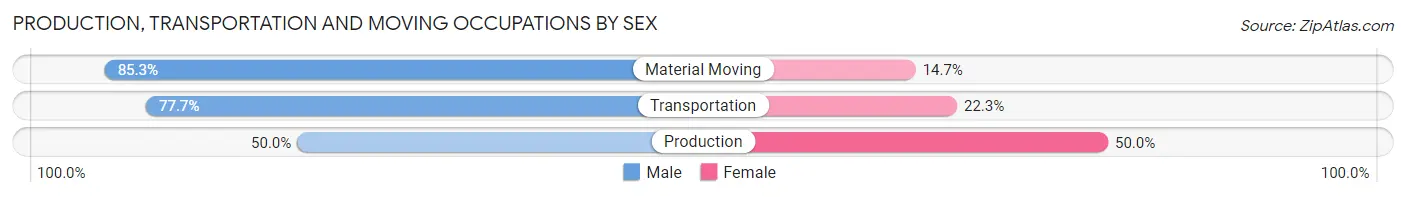
| Occupation | Male | Female |
| Production | 26 (50.0%) | 26 (50.0%) |
| Transportation | 216 (77.7%) | 62 (22.3%) |
| Material Moving | 29 (85.3%) | 5 (14.7%) |
| Total (Category) | 271 (74.5%) | 93 (25.6%) |
| Total (Overall) | 1,581 (52.3%) | 1,441 (47.7%) |
Employment Industries by Sex in Winslow
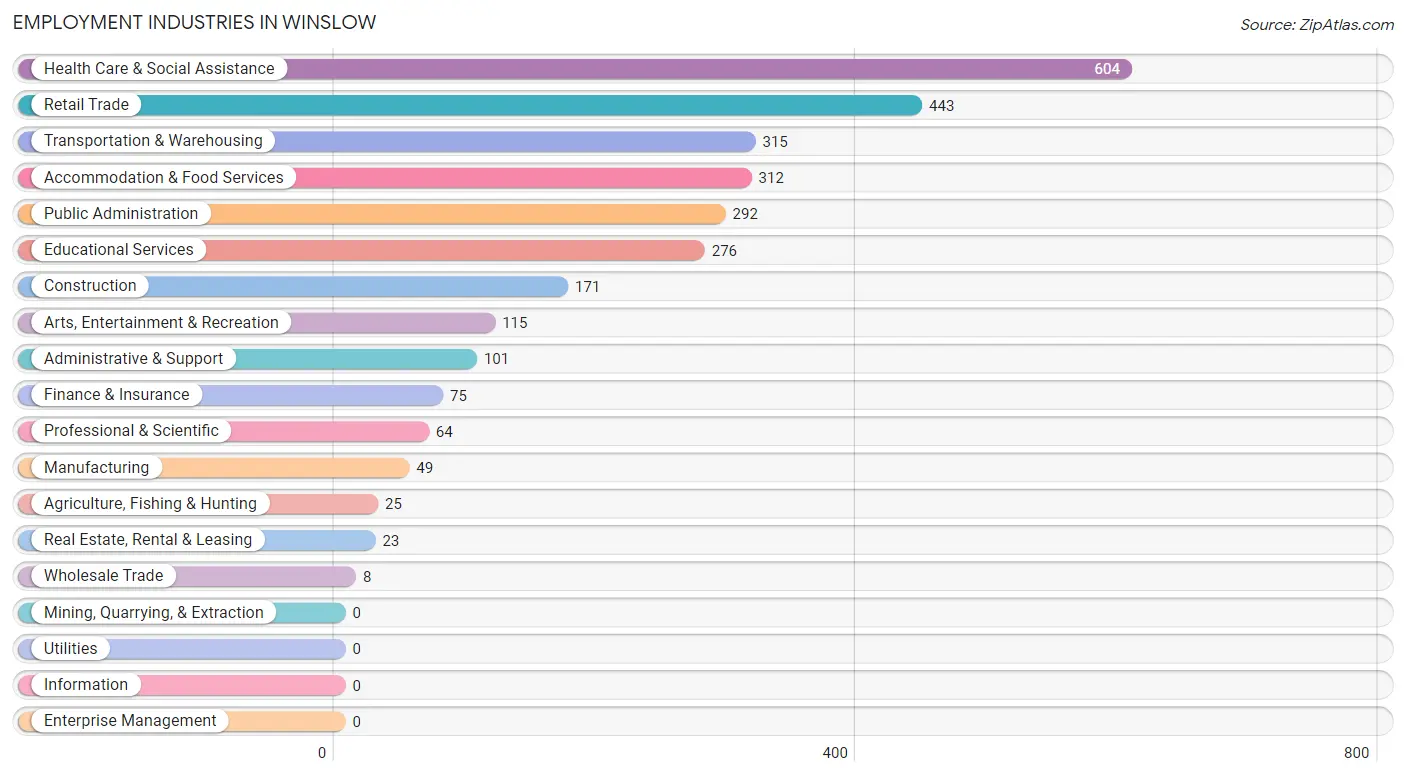
Employment Industries in Winslow
The major employment industries in Winslow include Health Care & Social Assistance (604 | 20.0%), Retail Trade (443 | 14.7%), Transportation & Warehousing (315 | 10.4%), Accommodation & Food Services (312 | 10.3%), and Public Administration (292 | 9.7%).
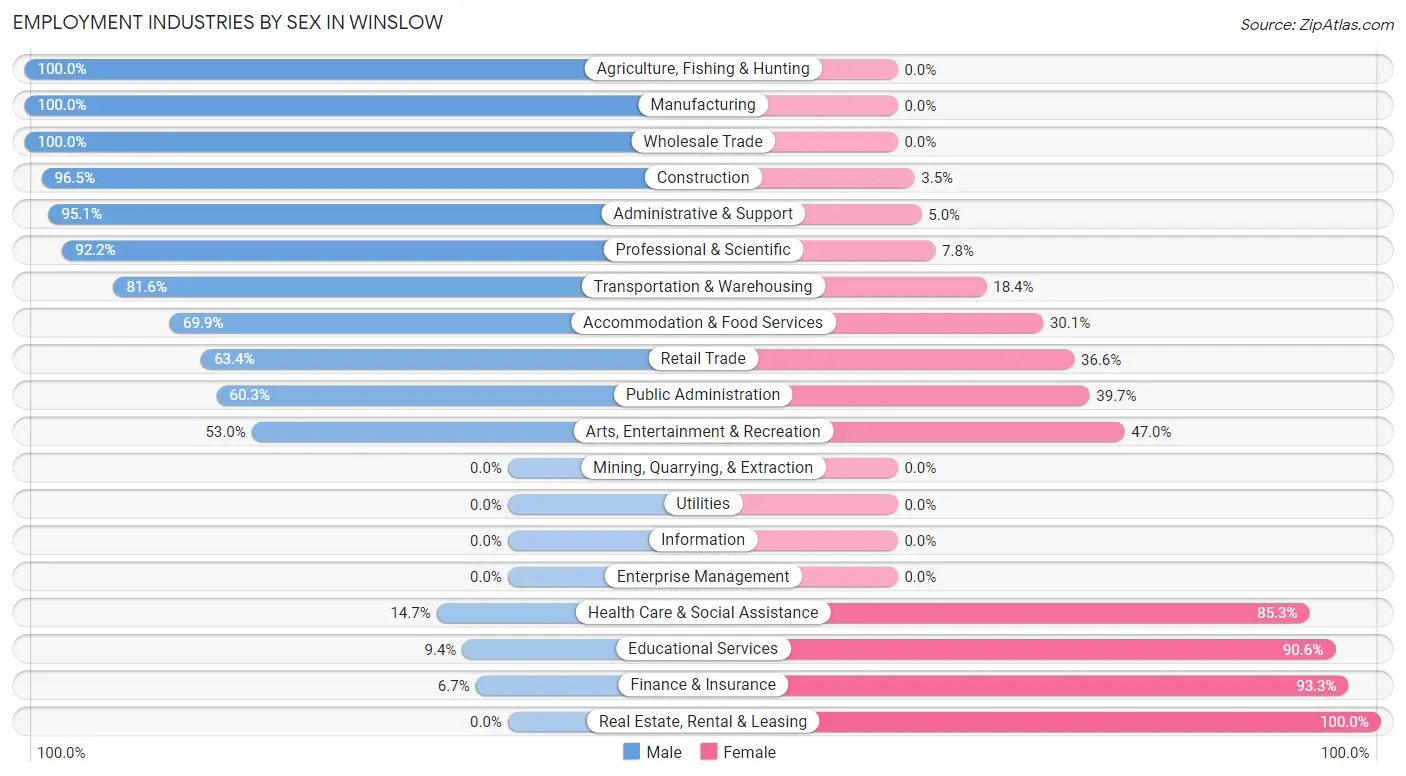
Employment Industries by Sex in Winslow
The Winslow industries that see more men than women are Agriculture, Fishing & Hunting (100.0%), Manufacturing (100.0%), and Wholesale Trade (100.0%), whereas the industries that tend to have a higher number of women are Real Estate, Rental & Leasing (100.0%), Finance & Insurance (93.3%), and Educational Services (90.6%).
| Industry | Male | Female |
| Agriculture, Fishing & Hunting | 25 (100.0%) | 0 (0.0%) |
| Mining, Quarrying, & Extraction | 0 (0.0%) | 0 (0.0%) |
| Construction | 165 (96.5%) | 6 (3.5%) |
| Manufacturing | 49 (100.0%) | 0 (0.0%) |
| Wholesale Trade | 8 (100.0%) | 0 (0.0%) |
| Retail Trade | 281 (63.4%) | 162 (36.6%) |
| Transportation & Warehousing | 257 (81.6%) | 58 (18.4%) |
| Utilities | 0 (0.0%) | 0 (0.0%) |
| Information | 0 (0.0%) | 0 (0.0%) |
| Finance & Insurance | 5 (6.7%) | 70 (93.3%) |
| Real Estate, Rental & Leasing | 0 (0.0%) | 23 (100.0%) |
| Professional & Scientific | 59 (92.2%) | 5 (7.8%) |
| Enterprise Management | 0 (0.0%) | 0 (0.0%) |
| Administrative & Support | 96 (95.1%) | 5 (5.0%) |
| Educational Services | 26 (9.4%) | 250 (90.6%) |
| Health Care & Social Assistance | 89 (14.7%) | 515 (85.3%) |
| Arts, Entertainment & Recreation | 61 (53.0%) | 54 (47.0%) |
| Accommodation & Food Services | 218 (69.9%) | 94 (30.1%) |
| Public Administration | 176 (60.3%) | 116 (39.7%) |
| Total | 1,581 (52.3%) | 1,441 (47.7%) |
Education in Winslow
School Enrollment in Winslow
The most common levels of schooling among the 2,183 students in Winslow are middle school (636 | 29.1%), high school (589 | 27.0%), and elementary school (437 | 20.0%).
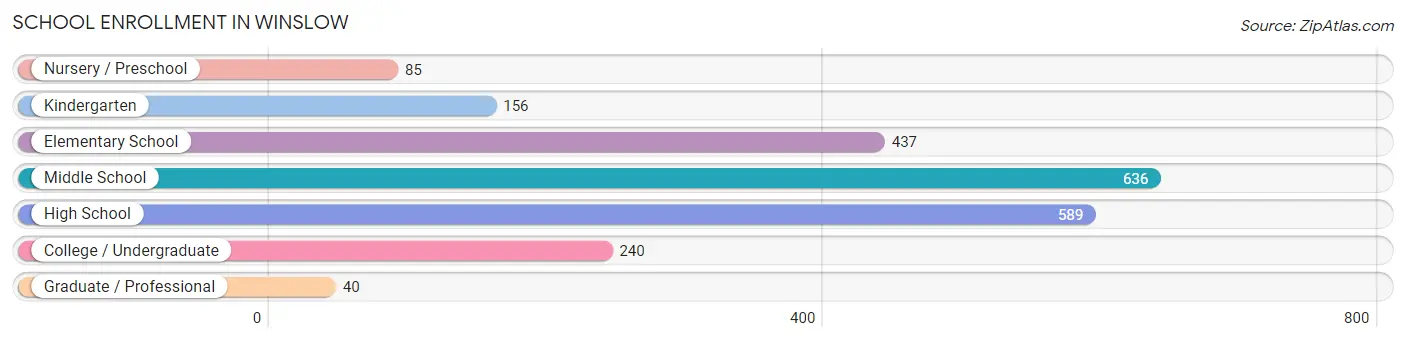
| School Level | # Students | % Students |
| Nursery / Preschool | 85 | 3.9% |
| Kindergarten | 156 | 7.1% |
| Elementary School | 437 | 20.0% |
| Middle School | 636 | 29.1% |
| High School | 589 | 27.0% |
| College / Undergraduate | 240 | 11.0% |
| Graduate / Professional | 40 | 1.8% |
| Total | 2,183 | 100.0% |
School Enrollment by Age by Funding Source in Winslow
Out of a total of 2,183 students who are enrolled in schools in Winslow, 183 (8.4%) attend a private institution, while the remaining 2,000 (91.6%) are enrolled in public schools. The age group of 3 to 4 year olds has the highest likelihood of being enrolled in private schools, with 24 (36.9% in the age bracket) enrolled. Conversely, the age group of 20 to 24 year olds has the lowest likelihood of being enrolled in a private school, with 99 (100.0% in the age bracket) attending a public institution.
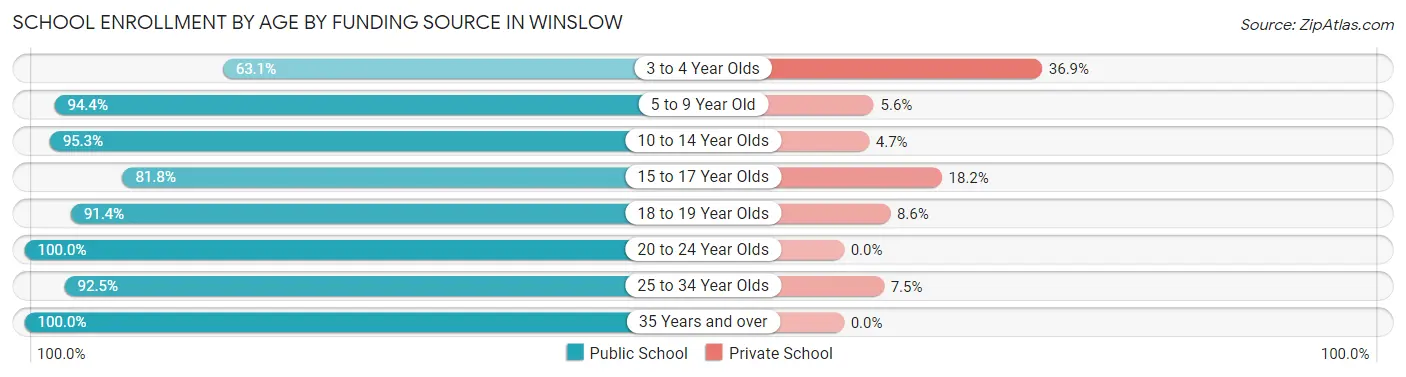
| Age Bracket | Public School | Private School |
| 3 to 4 Year Olds | 41 (63.1%) | 24 (36.9%) |
| 5 to 9 Year Old | 541 (94.4%) | 32 (5.6%) |
| 10 to 14 Year Olds | 670 (95.3%) | 33 (4.7%) |
| 15 to 17 Year Olds | 354 (81.8%) | 79 (18.2%) |
| 18 to 19 Year Olds | 53 (91.4%) | 5 (8.6%) |
| 20 to 24 Year Olds | 99 (100.0%) | 0 (0.0%) |
| 25 to 34 Year Olds | 124 (92.5%) | 10 (7.5%) |
| 35 Years and over | 118 (100.0%) | 0 (0.0%) |
| Total | 2,000 (91.6%) | 183 (8.4%) |
Educational Attainment by Field of Study in Winslow
Education (205 | 37.3%), business (76 | 13.8%), visual & performing arts (48 | 8.7%), bio, nature & agricultural (42 | 7.6%), and psychology (41 | 7.4%) are the most common fields of study among 550 individuals in Winslow who have obtained a bachelor's degree or higher.
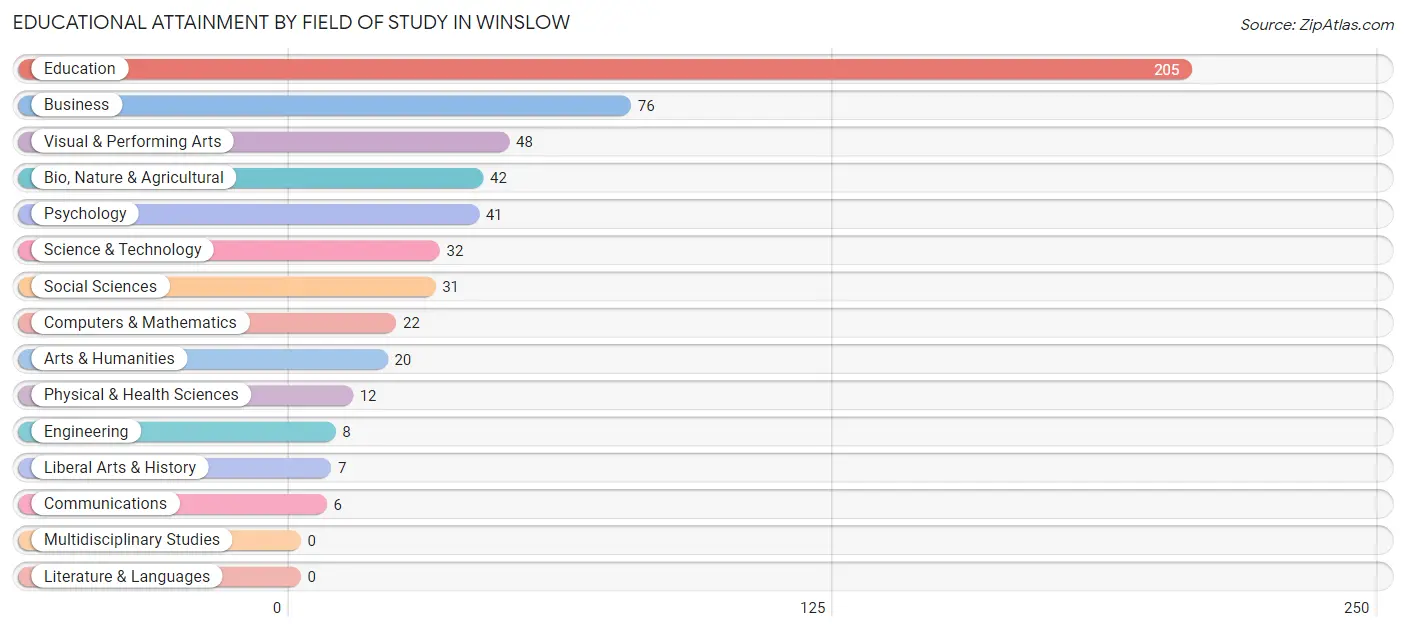
| Field of Study | # Graduates | % Graduates |
| Computers & Mathematics | 22 | 4.0% |
| Bio, Nature & Agricultural | 42 | 7.6% |
| Physical & Health Sciences | 12 | 2.2% |
| Psychology | 41 | 7.4% |
| Social Sciences | 31 | 5.6% |
| Engineering | 8 | 1.5% |
| Multidisciplinary Studies | 0 | 0.0% |
| Science & Technology | 32 | 5.8% |
| Business | 76 | 13.8% |
| Education | 205 | 37.3% |
| Literature & Languages | 0 | 0.0% |
| Liberal Arts & History | 7 | 1.3% |
| Visual & Performing Arts | 48 | 8.7% |
| Communications | 6 | 1.1% |
| Arts & Humanities | 20 | 3.6% |
| Total | 550 | 100.0% |
Transportation & Commute in Winslow
Vehicle Availability by Sex in Winslow
The most prevalent vehicle ownership categories in Winslow are males with 2 vehicles (476, accounting for 30.8%) and females with 2 vehicles (424, making up 34.8%).
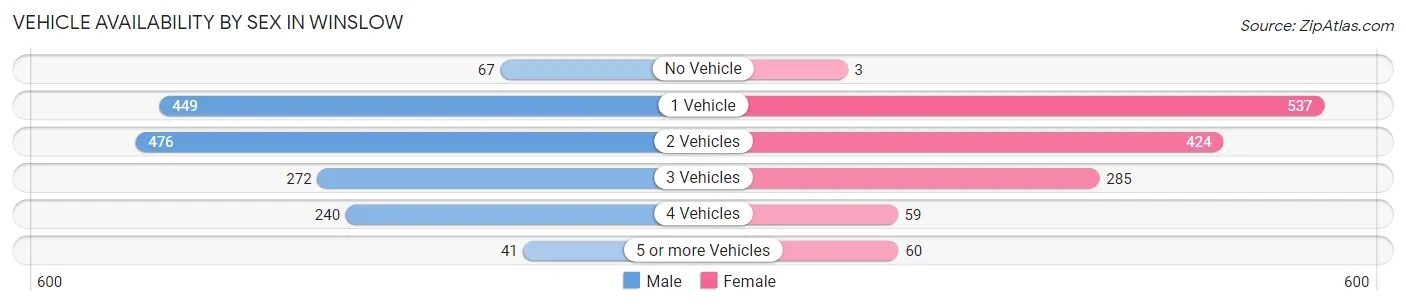
| Vehicles Available | Male | Female |
| No Vehicle | 67 (4.3%) | 3 (0.2%) |
| 1 Vehicle | 449 (29.1%) | 537 (39.3%) |
| 2 Vehicles | 476 (30.8%) | 424 (31.0%) |
| 3 Vehicles | 272 (17.6%) | 285 (20.8%) |
| 4 Vehicles | 240 (15.5%) | 59 (4.3%) |
| 5 or more Vehicles | 41 (2.6%) | 60 (4.4%) |
| Total | 1,545 (100.0%) | 1,368 (100.0%) |
Commute Time in Winslow
The most frequently occuring commute durations in Winslow are 5 to 9 minutes (941 commuters, 34.2%), 10 to 14 minutes (837 commuters, 30.4%), and less than 5 minutes (264 commuters, 9.6%).
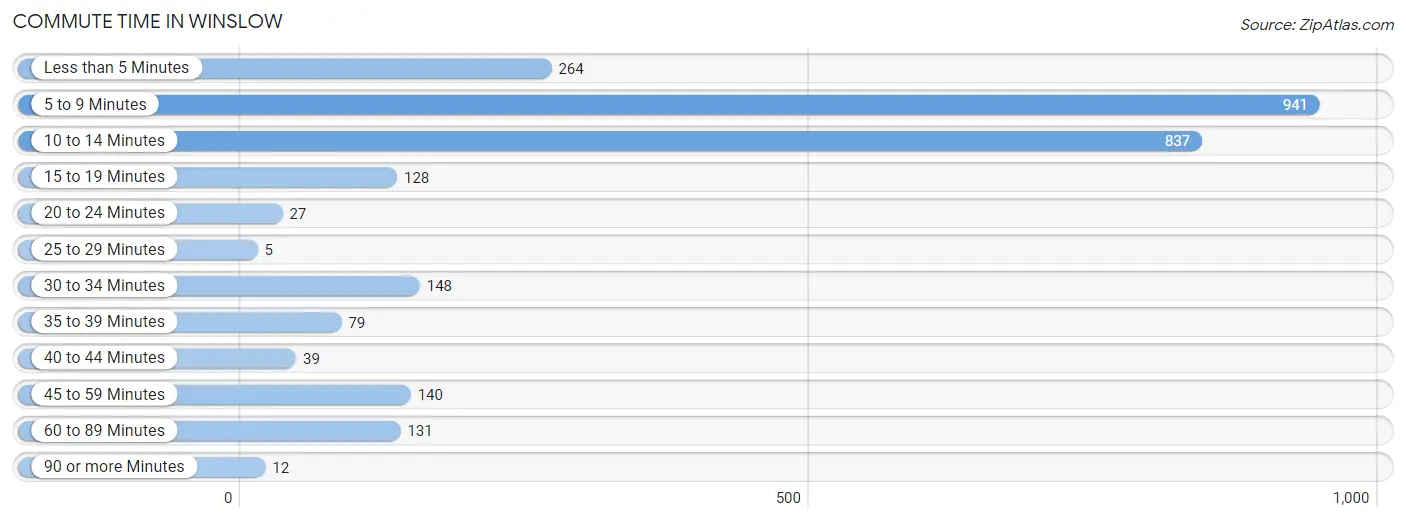
| Commute Time | # Commuters | % Commuters |
| Less than 5 Minutes | 264 | 9.6% |
| 5 to 9 Minutes | 941 | 34.2% |
| 10 to 14 Minutes | 837 | 30.4% |
| 15 to 19 Minutes | 128 | 4.6% |
| 20 to 24 Minutes | 27 | 1.0% |
| 25 to 29 Minutes | 5 | 0.2% |
| 30 to 34 Minutes | 148 | 5.4% |
| 35 to 39 Minutes | 79 | 2.9% |
| 40 to 44 Minutes | 39 | 1.4% |
| 45 to 59 Minutes | 140 | 5.1% |
| 60 to 89 Minutes | 131 | 4.8% |
| 90 or more Minutes | 12 | 0.4% |
Commute Time by Sex in Winslow
The most common commute times in Winslow are 5 to 9 minutes (509 commuters, 36.0%) for males and 5 to 9 minutes (432 commuters, 32.3%) for females.
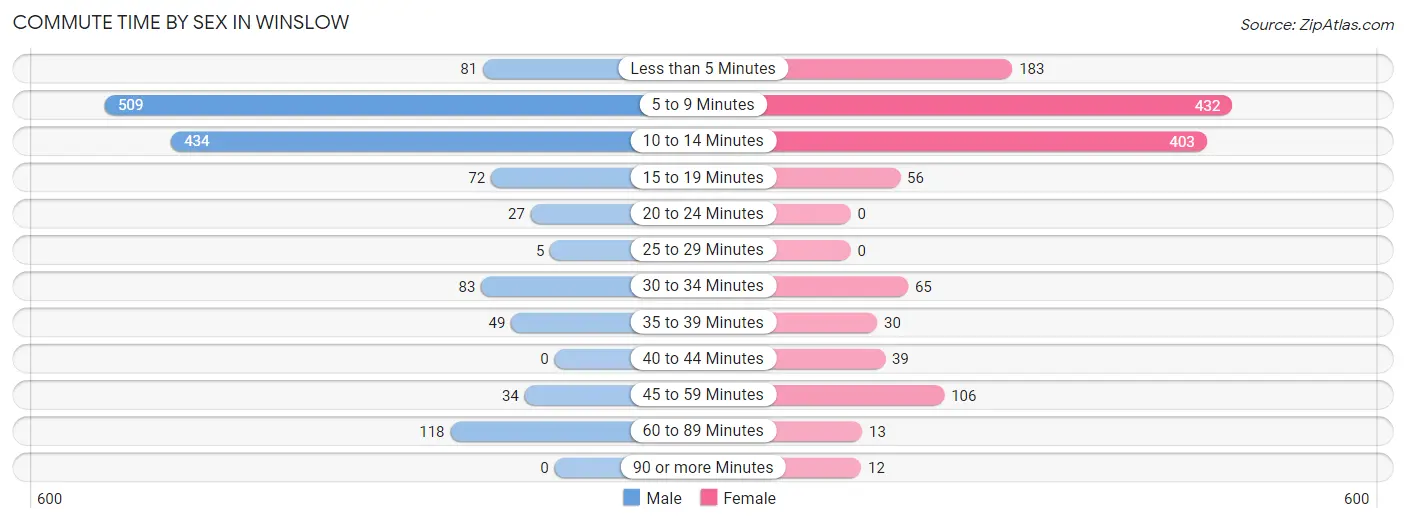
| Commute Time | Male | Female |
| Less than 5 Minutes | 81 (5.7%) | 183 (13.7%) |
| 5 to 9 Minutes | 509 (36.0%) | 432 (32.3%) |
| 10 to 14 Minutes | 434 (30.7%) | 403 (30.1%) |
| 15 to 19 Minutes | 72 (5.1%) | 56 (4.2%) |
| 20 to 24 Minutes | 27 (1.9%) | 0 (0.0%) |
| 25 to 29 Minutes | 5 (0.4%) | 0 (0.0%) |
| 30 to 34 Minutes | 83 (5.9%) | 65 (4.9%) |
| 35 to 39 Minutes | 49 (3.5%) | 30 (2.2%) |
| 40 to 44 Minutes | 0 (0.0%) | 39 (2.9%) |
| 45 to 59 Minutes | 34 (2.4%) | 106 (7.9%) |
| 60 to 89 Minutes | 118 (8.4%) | 13 (1.0%) |
| 90 or more Minutes | 0 (0.0%) | 12 (0.9%) |
Time of Departure to Work by Sex in Winslow
The most frequent times of departure to work in Winslow are 12:00 AM to 4:59 AM (345, 24.4%) for males and 7:00 AM to 7:29 AM (230, 17.2%) for females.
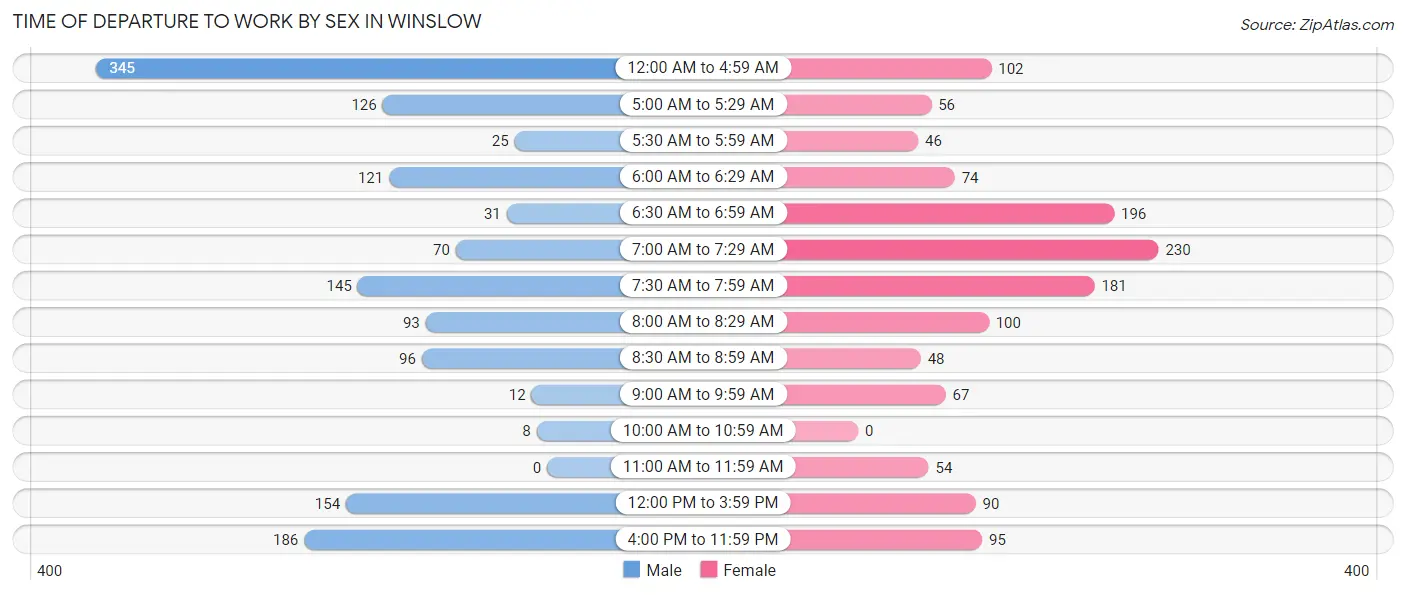
| Time of Departure | Male | Female |
| 12:00 AM to 4:59 AM | 345 (24.4%) | 102 (7.6%) |
| 5:00 AM to 5:29 AM | 126 (8.9%) | 56 (4.2%) |
| 5:30 AM to 5:59 AM | 25 (1.8%) | 46 (3.4%) |
| 6:00 AM to 6:29 AM | 121 (8.6%) | 74 (5.5%) |
| 6:30 AM to 6:59 AM | 31 (2.2%) | 196 (14.6%) |
| 7:00 AM to 7:29 AM | 70 (5.0%) | 230 (17.2%) |
| 7:30 AM to 7:59 AM | 145 (10.3%) | 181 (13.5%) |
| 8:00 AM to 8:29 AM | 93 (6.6%) | 100 (7.5%) |
| 8:30 AM to 8:59 AM | 96 (6.8%) | 48 (3.6%) |
| 9:00 AM to 9:59 AM | 12 (0.9%) | 67 (5.0%) |
| 10:00 AM to 10:59 AM | 8 (0.6%) | 0 (0.0%) |
| 11:00 AM to 11:59 AM | 0 (0.0%) | 54 (4.0%) |
| 12:00 PM to 3:59 PM | 154 (10.9%) | 90 (6.7%) |
| 4:00 PM to 11:59 PM | 186 (13.2%) | 95 (7.1%) |
| Total | 1,412 (100.0%) | 1,339 (100.0%) |
Housing Occupancy in Winslow
Occupancy by Ownership in Winslow
Of the total 2,549 dwellings in Winslow, owner-occupied units account for 1,297 (50.9%), while renter-occupied units make up 1,252 (49.1%).
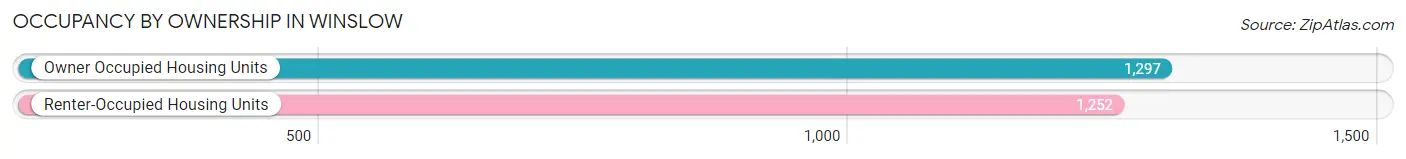
| Occupancy | # Housing Units | % Housing Units |
| Owner Occupied Housing Units | 1,297 | 50.9% |
| Renter-Occupied Housing Units | 1,252 | 49.1% |
| Total Occupied Housing Units | 2,549 | 100.0% |
Occupancy by Household Size in Winslow
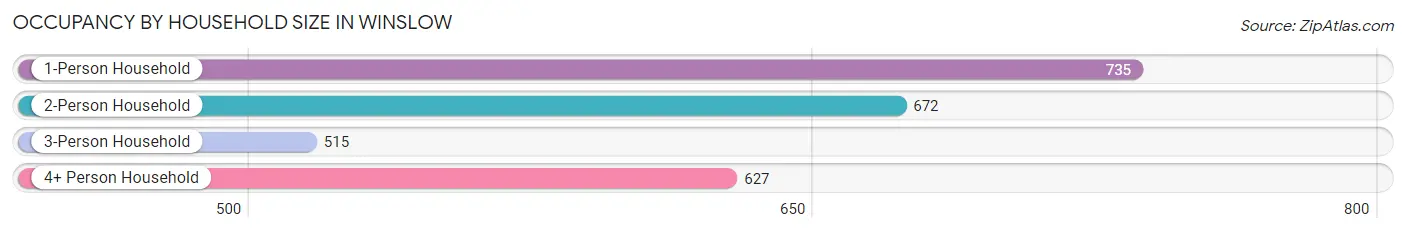
| Household Size | # Housing Units | % Housing Units |
| 1-Person Household | 735 | 28.8% |
| 2-Person Household | 672 | 26.4% |
| 3-Person Household | 515 | 20.2% |
| 4+ Person Household | 627 | 24.6% |
| Total Housing Units | 2,549 | 100.0% |
Occupancy by Ownership by Household Size in Winslow
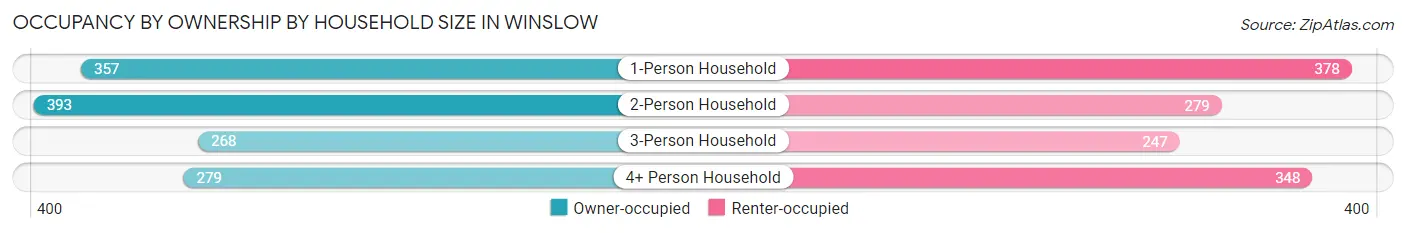
| Household Size | Owner-occupied | Renter-occupied |
| 1-Person Household | 357 (48.6%) | 378 (51.4%) |
| 2-Person Household | 393 (58.5%) | 279 (41.5%) |
| 3-Person Household | 268 (52.0%) | 247 (48.0%) |
| 4+ Person Household | 279 (44.5%) | 348 (55.5%) |
| Total Housing Units | 1,297 (50.9%) | 1,252 (49.1%) |
Occupancy by Educational Attainment in Winslow
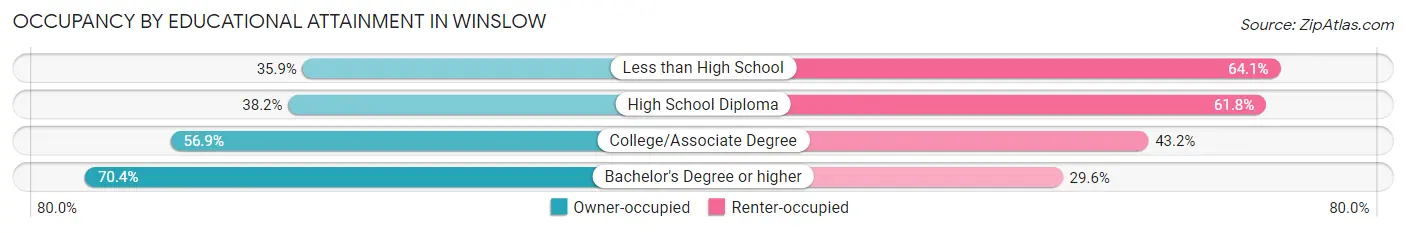
| Household Size | Owner-occupied | Renter-occupied |
| Less than High School | 103 (35.9%) | 184 (64.1%) |
| High School Diploma | 274 (38.2%) | 444 (61.8%) |
| College/Associate Degree | 701 (56.9%) | 532 (43.1%) |
| Bachelor's Degree or higher | 219 (70.4%) | 92 (29.6%) |
Occupancy by Age of Householder in Winslow
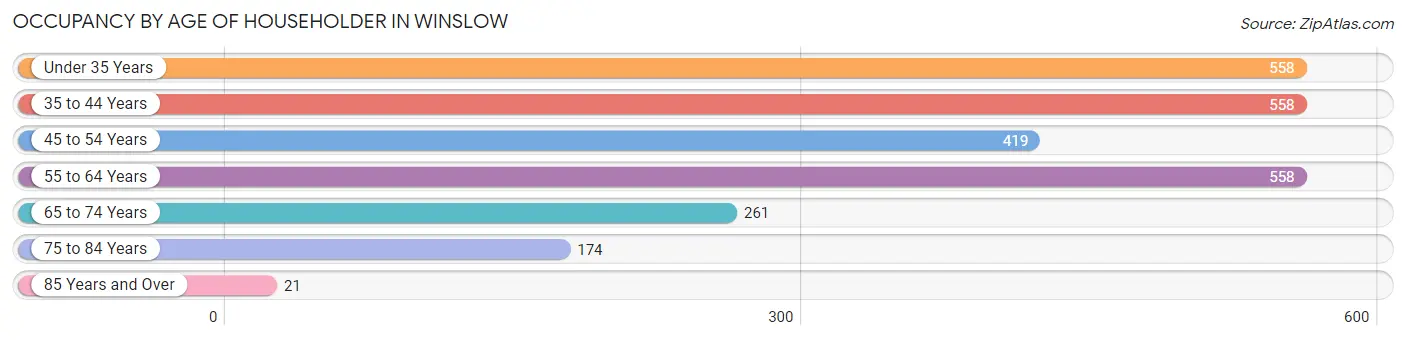
| Age Bracket | # Households | % Households |
| Under 35 Years | 558 | 21.9% |
| 35 to 44 Years | 558 | 21.9% |
| 45 to 54 Years | 419 | 16.4% |
| 55 to 64 Years | 558 | 21.9% |
| 65 to 74 Years | 261 | 10.2% |
| 75 to 84 Years | 174 | 6.8% |
| 85 Years and Over | 21 | 0.8% |
| Total | 2,549 | 100.0% |
Housing Finances in Winslow
Median Income by Occupancy in Winslow
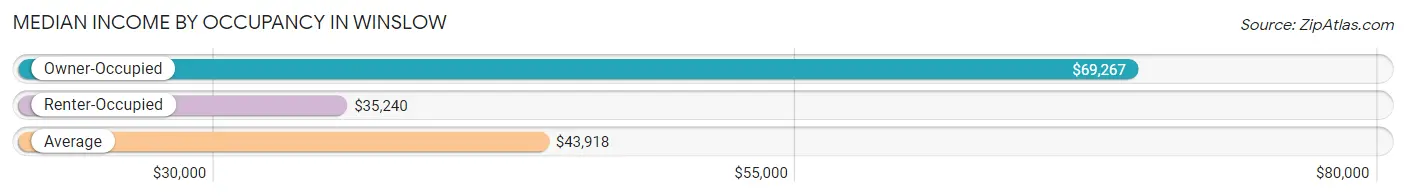
| Occupancy Type | # Households | Median Income |
| Owner-Occupied | 1,297 (50.9%) | $69,267 |
| Renter-Occupied | 1,252 (49.1%) | $35,240 |
| Average | 2,549 (100.0%) | $43,918 |
Occupancy by Householder Income Bracket in Winslow
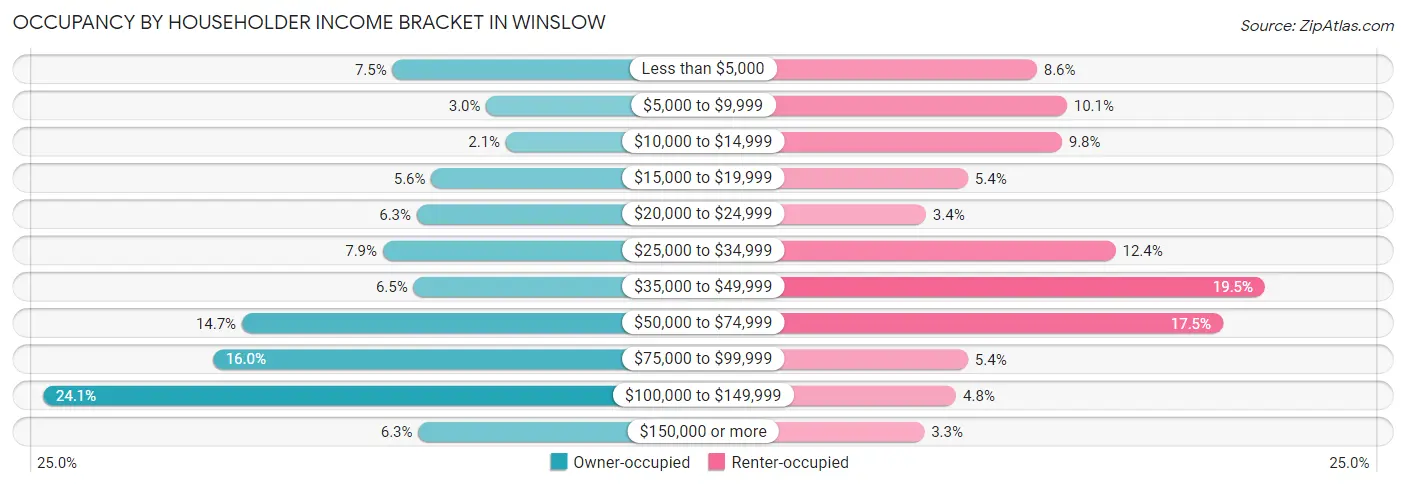
| Income Bracket | Owner-occupied | Renter-occupied |
| Less than $5,000 | 97 (7.5%) | 108 (8.6%) |
| $5,000 to $9,999 | 39 (3.0%) | 126 (10.1%) |
| $10,000 to $14,999 | 27 (2.1%) | 123 (9.8%) |
| $15,000 to $19,999 | 73 (5.6%) | 67 (5.3%) |
| $20,000 to $24,999 | 82 (6.3%) | 42 (3.4%) |
| $25,000 to $34,999 | 103 (7.9%) | 155 (12.4%) |
| $35,000 to $49,999 | 84 (6.5%) | 244 (19.5%) |
| $50,000 to $74,999 | 190 (14.6%) | 219 (17.5%) |
| $75,000 to $99,999 | 208 (16.0%) | 67 (5.3%) |
| $100,000 to $149,999 | 313 (24.1%) | 60 (4.8%) |
| $150,000 or more | 81 (6.2%) | 41 (3.3%) |
| Total | 1,297 (100.0%) | 1,252 (100.0%) |
Monthly Housing Cost Tiers in Winslow
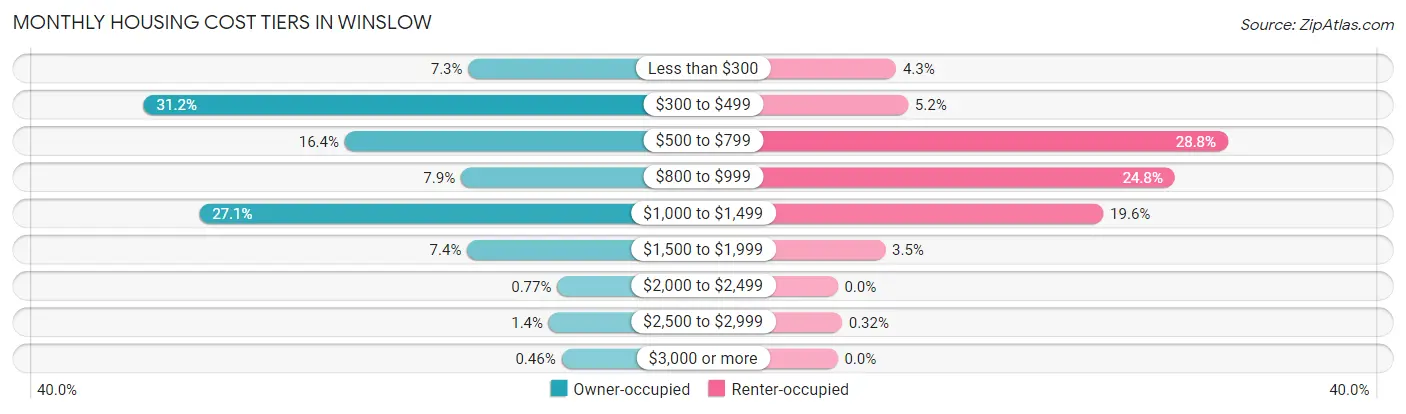
| Monthly Cost | Owner-occupied | Renter-occupied |
| Less than $300 | 95 (7.3%) | 54 (4.3%) |
| $300 to $499 | 405 (31.2%) | 65 (5.2%) |
| $500 to $799 | 213 (16.4%) | 360 (28.7%) |
| $800 to $999 | 102 (7.9%) | 311 (24.8%) |
| $1,000 to $1,499 | 352 (27.1%) | 245 (19.6%) |
| $1,500 to $1,999 | 96 (7.4%) | 44 (3.5%) |
| $2,000 to $2,499 | 10 (0.8%) | 0 (0.0%) |
| $2,500 to $2,999 | 18 (1.4%) | 4 (0.3%) |
| $3,000 or more | 6 (0.5%) | 0 (0.0%) |
| Total | 1,297 (100.0%) | 1,252 (100.0%) |
Physical Housing Characteristics in Winslow
Housing Structures in Winslow
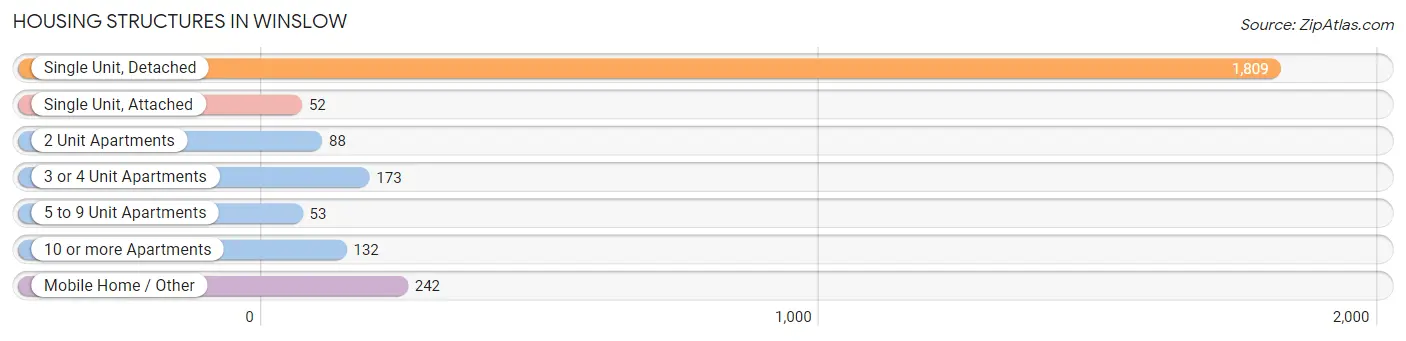
| Structure Type | # Housing Units | % Housing Units |
| Single Unit, Detached | 1,809 | 71.0% |
| Single Unit, Attached | 52 | 2.0% |
| 2 Unit Apartments | 88 | 3.5% |
| 3 or 4 Unit Apartments | 173 | 6.8% |
| 5 to 9 Unit Apartments | 53 | 2.1% |
| 10 or more Apartments | 132 | 5.2% |
| Mobile Home / Other | 242 | 9.5% |
| Total | 2,549 | 100.0% |
Housing Structures by Occupancy in Winslow
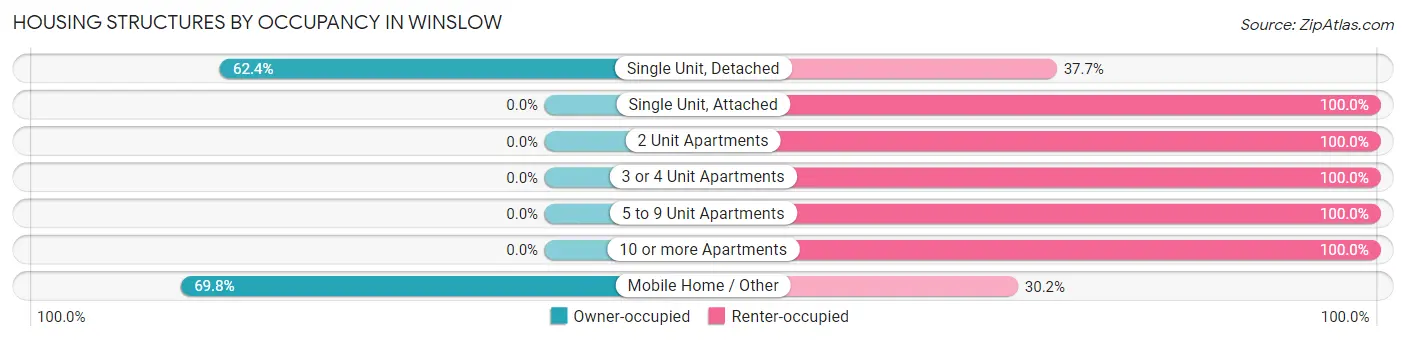
| Structure Type | Owner-occupied | Renter-occupied |
| Single Unit, Detached | 1,128 (62.4%) | 681 (37.7%) |
| Single Unit, Attached | 0 (0.0%) | 52 (100.0%) |
| 2 Unit Apartments | 0 (0.0%) | 88 (100.0%) |
| 3 or 4 Unit Apartments | 0 (0.0%) | 173 (100.0%) |
| 5 to 9 Unit Apartments | 0 (0.0%) | 53 (100.0%) |
| 10 or more Apartments | 0 (0.0%) | 132 (100.0%) |
| Mobile Home / Other | 169 (69.8%) | 73 (30.2%) |
| Total | 1,297 (50.9%) | 1,252 (49.1%) |
Housing Structures by Number of Rooms in Winslow
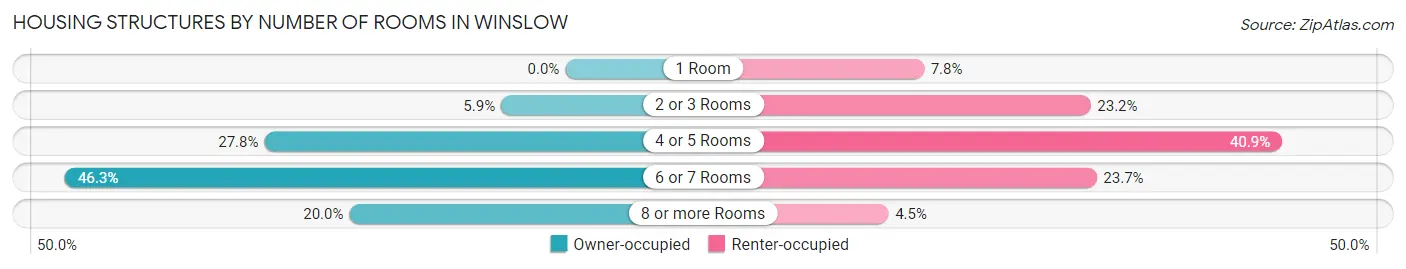
| Number of Rooms | Owner-occupied | Renter-occupied |
| 1 Room | 0 (0.0%) | 97 (7.7%) |
| 2 or 3 Rooms | 77 (5.9%) | 290 (23.2%) |
| 4 or 5 Rooms | 361 (27.8%) | 512 (40.9%) |
| 6 or 7 Rooms | 600 (46.3%) | 297 (23.7%) |
| 8 or more Rooms | 259 (20.0%) | 56 (4.5%) |
| Total | 1,297 (100.0%) | 1,252 (100.0%) |
Housing Structure by Heating Type in Winslow
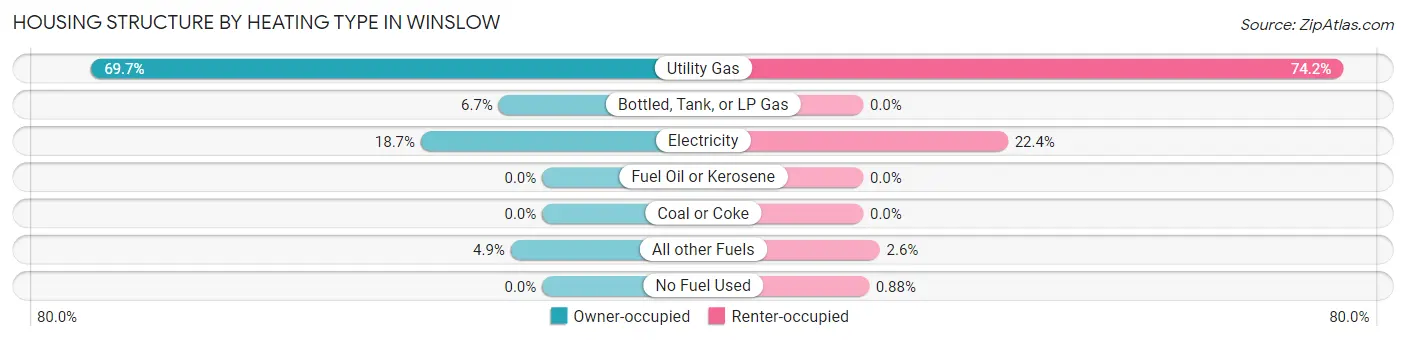
| Heating Type | Owner-occupied | Renter-occupied |
| Utility Gas | 904 (69.7%) | 929 (74.2%) |
| Bottled, Tank, or LP Gas | 87 (6.7%) | 0 (0.0%) |
| Electricity | 243 (18.7%) | 280 (22.4%) |
| Fuel Oil or Kerosene | 0 (0.0%) | 0 (0.0%) |
| Coal or Coke | 0 (0.0%) | 0 (0.0%) |
| All other Fuels | 63 (4.9%) | 32 (2.6%) |
| No Fuel Used | 0 (0.0%) | 11 (0.9%) |
| Total | 1,297 (100.0%) | 1,252 (100.0%) |
Household Vehicle Usage in Winslow
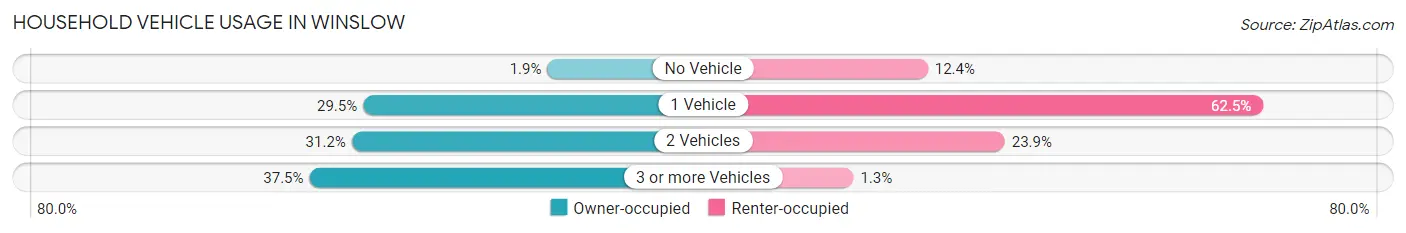
| Vehicles per Household | Owner-occupied | Renter-occupied |
| No Vehicle | 25 (1.9%) | 155 (12.4%) |
| 1 Vehicle | 382 (29.4%) | 782 (62.5%) |
| 2 Vehicles | 404 (31.1%) | 299 (23.9%) |
| 3 or more Vehicles | 486 (37.5%) | 16 (1.3%) |
| Total | 1,297 (100.0%) | 1,252 (100.0%) |
Real Estate & Mortgages in Winslow
Real Estate and Mortgage Overview in Winslow
| Characteristic | Without Mortgage | With Mortgage |
| Housing Units | 663 | 634 |
| Median Property Value | $82,600 | $159,500 |
| Median Household Income | $42,019 | $51 |
| Monthly Housing Costs | $399 | $6 |
| Real Estate Taxes | $592 | $6 |
Property Value by Mortgage Status in Winslow
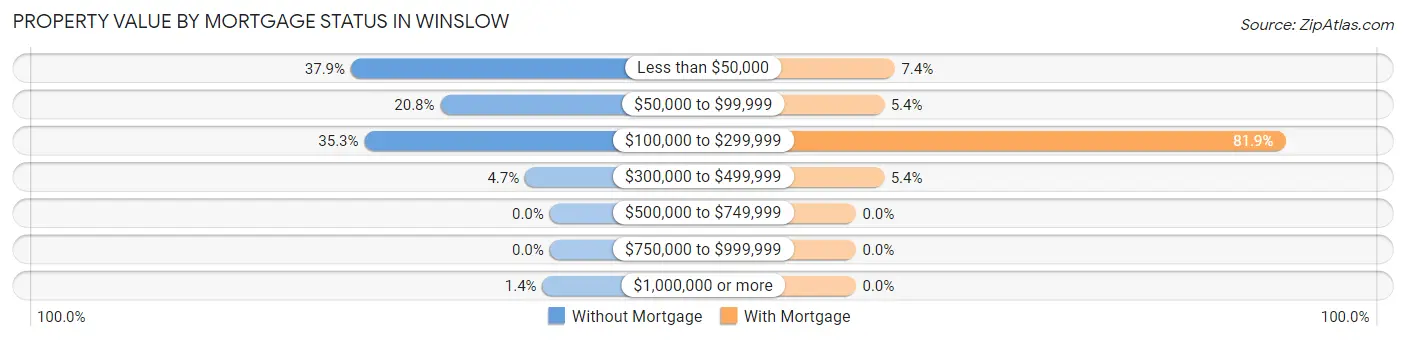
| Property Value | Without Mortgage | With Mortgage |
| Less than $50,000 | 251 (37.9%) | 47 (7.4%) |
| $50,000 to $99,999 | 138 (20.8%) | 34 (5.4%) |
| $100,000 to $299,999 | 234 (35.3%) | 519 (81.9%) |
| $300,000 to $499,999 | 31 (4.7%) | 34 (5.4%) |
| $500,000 to $749,999 | 0 (0.0%) | 0 (0.0%) |
| $750,000 to $999,999 | 0 (0.0%) | 0 (0.0%) |
| $1,000,000 or more | 9 (1.4%) | 0 (0.0%) |
| Total | 663 (100.0%) | 634 (100.0%) |
Household Income by Mortgage Status in Winslow
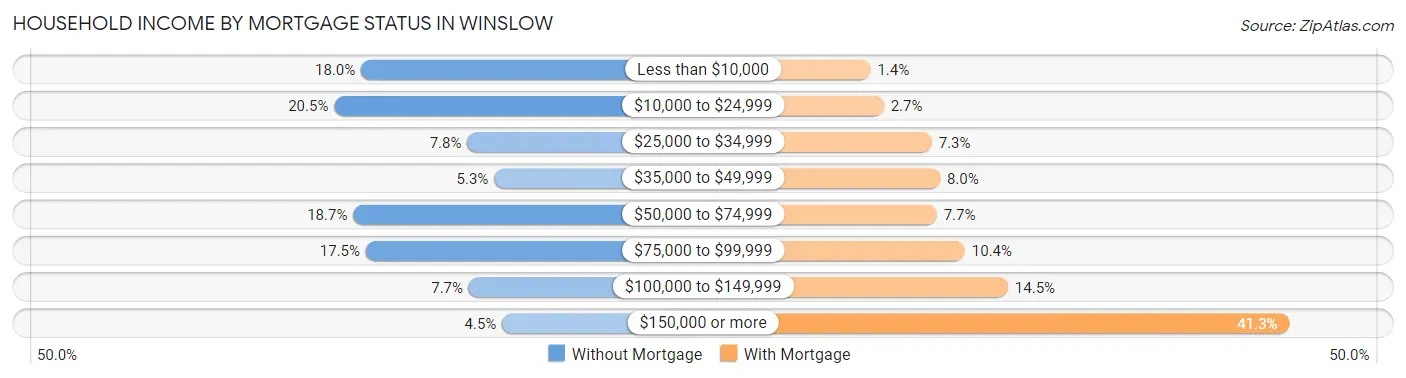
| Household Income | Without Mortgage | With Mortgage |
| Less than $10,000 | 119 (17.9%) | 9 (1.4%) |
| $10,000 to $24,999 | 136 (20.5%) | 17 (2.7%) |
| $25,000 to $34,999 | 52 (7.8%) | 46 (7.3%) |
| $35,000 to $49,999 | 35 (5.3%) | 51 (8.0%) |
| $50,000 to $74,999 | 124 (18.7%) | 49 (7.7%) |
| $75,000 to $99,999 | 116 (17.5%) | 66 (10.4%) |
| $100,000 to $149,999 | 51 (7.7%) | 92 (14.5%) |
| $150,000 or more | 30 (4.5%) | 262 (41.3%) |
| Total | 663 (100.0%) | 634 (100.0%) |
Property Value to Household Income Ratio in Winslow
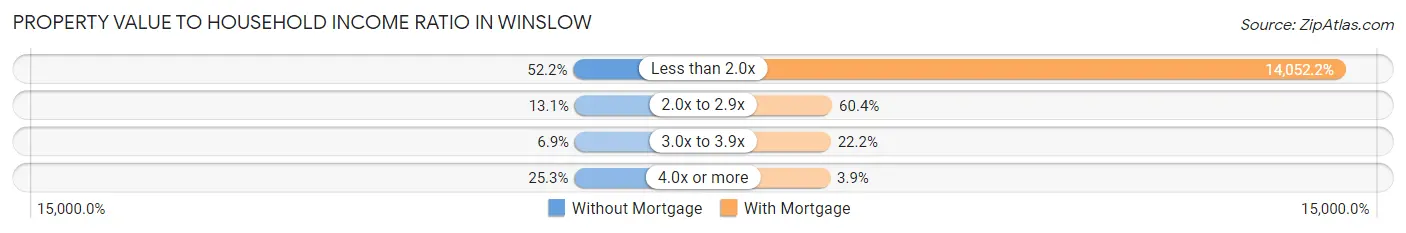
| Value-to-Income Ratio | Without Mortgage | With Mortgage |
| Less than 2.0x | 346 (52.2%) | 89,091 (14,052.2%) |
| 2.0x to 2.9x | 87 (13.1%) | 383 (60.4%) |
| 3.0x to 3.9x | 46 (6.9%) | 141 (22.2%) |
| 4.0x or more | 168 (25.3%) | 25 (3.9%) |
| Total | 663 (100.0%) | 634 (100.0%) |
Real Estate Taxes by Mortgage Status in Winslow
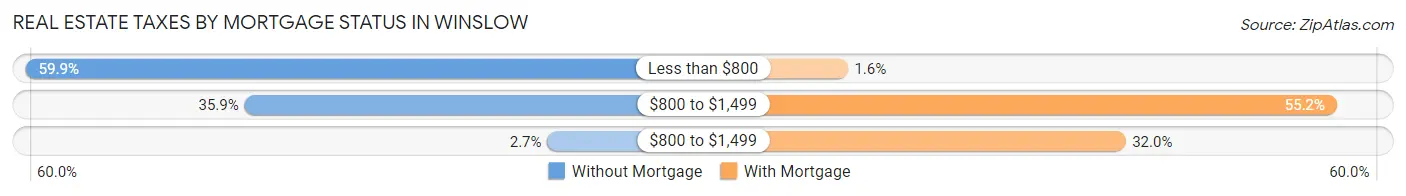
| Property Taxes | Without Mortgage | With Mortgage |
| Less than $800 | 397 (59.9%) | 10 (1.6%) |
| $800 to $1,499 | 238 (35.9%) | 350 (55.2%) |
| $800 to $1,499 | 18 (2.7%) | 203 (32.0%) |
| Total | 663 (100.0%) | 634 (100.0%) |
Health & Disability in Winslow
Health Insurance Coverage by Age in Winslow
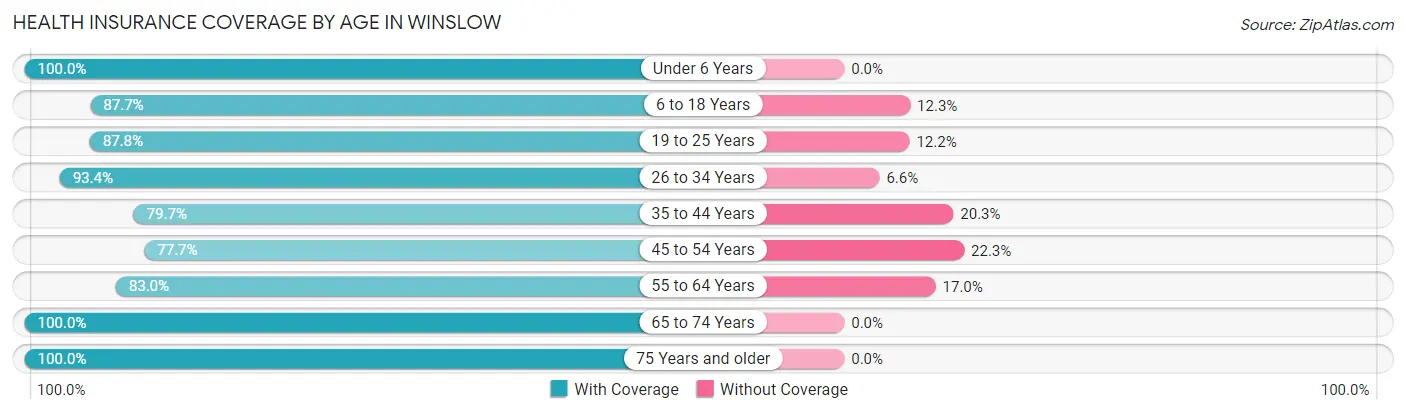
| Age Bracket | With Coverage | Without Coverage |
| Under 6 Years | 790 (100.0%) | 0 (0.0%) |
| 6 to 18 Years | 1,507 (87.7%) | 211 (12.3%) |
| 19 to 25 Years | 614 (87.8%) | 85 (12.2%) |
| 26 to 34 Years | 955 (93.4%) | 67 (6.6%) |
| 35 to 44 Years | 654 (79.7%) | 167 (20.3%) |
| 45 to 54 Years | 525 (77.7%) | 151 (22.3%) |
| 55 to 64 Years | 726 (83.0%) | 149 (17.0%) |
| 65 to 74 Years | 378 (100.0%) | 0 (0.0%) |
| 75 Years and older | 246 (100.0%) | 0 (0.0%) |
| Total | 6,395 (88.5%) | 830 (11.5%) |
Health Insurance Coverage by Citizenship Status in Winslow
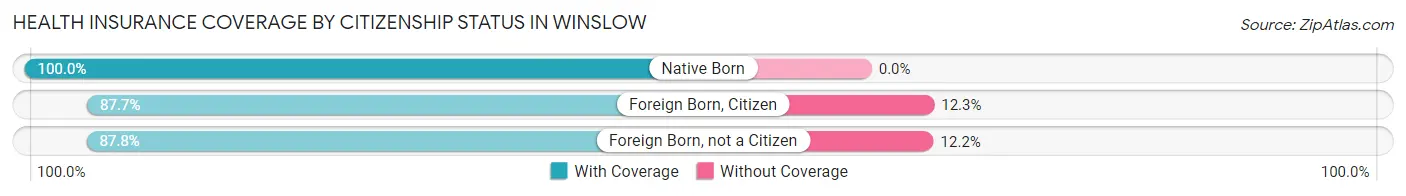
| Citizenship Status | With Coverage | Without Coverage |
| Native Born | 790 (100.0%) | 0 (0.0%) |
| Foreign Born, Citizen | 1,507 (87.7%) | 211 (12.3%) |
| Foreign Born, not a Citizen | 614 (87.8%) | 85 (12.2%) |
Health Insurance Coverage by Household Income in Winslow
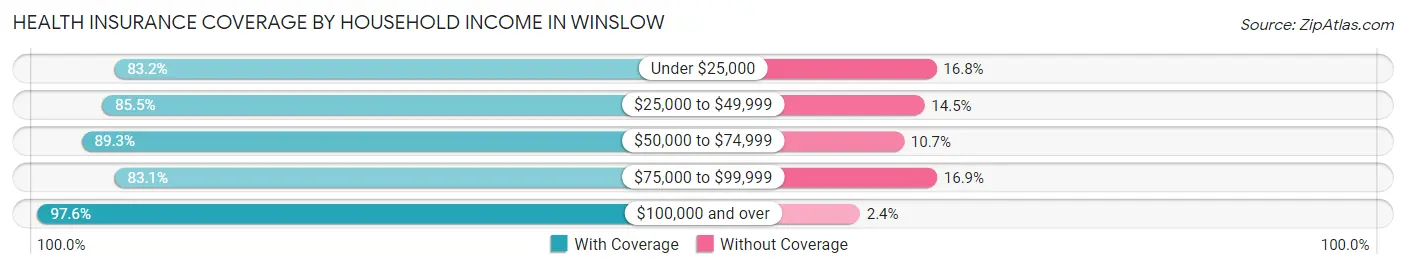
| Household Income | With Coverage | Without Coverage |
| Under $25,000 | 1,204 (83.2%) | 243 (16.8%) |
| $25,000 to $49,999 | 1,364 (85.5%) | 232 (14.5%) |
| $50,000 to $74,999 | 1,362 (89.3%) | 163 (10.7%) |
| $75,000 to $99,999 | 734 (83.1%) | 149 (16.9%) |
| $100,000 and over | 1,728 (97.6%) | 43 (2.4%) |
Public vs Private Health Insurance Coverage by Age in Winslow
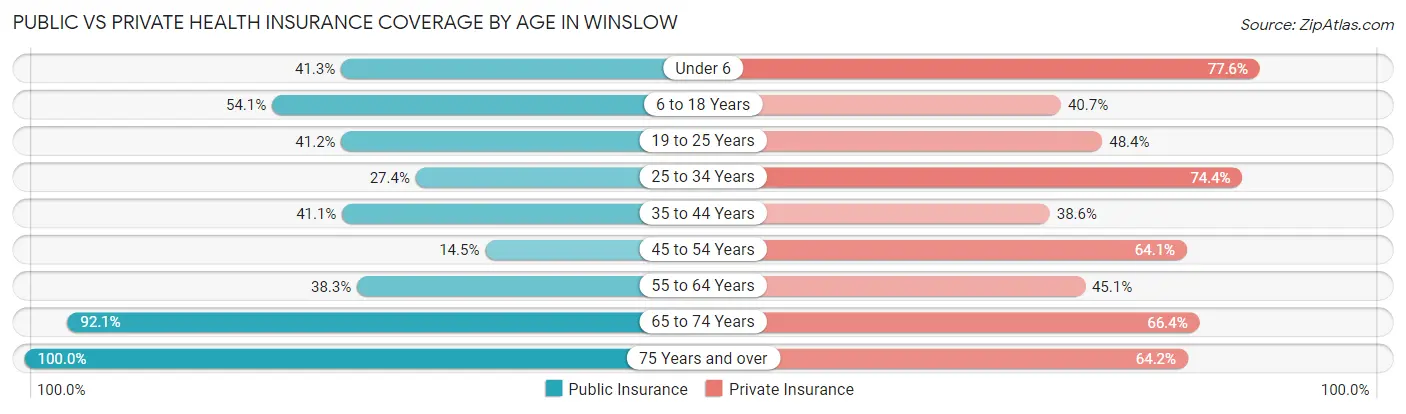
| Age Bracket | Public Insurance | Private Insurance |
| Under 6 | 326 (41.3%) | 613 (77.6%) |
| 6 to 18 Years | 929 (54.1%) | 699 (40.7%) |
| 19 to 25 Years | 288 (41.2%) | 338 (48.3%) |
| 25 to 34 Years | 280 (27.4%) | 760 (74.4%) |
| 35 to 44 Years | 337 (41.0%) | 317 (38.6%) |
| 45 to 54 Years | 98 (14.5%) | 433 (64.0%) |
| 55 to 64 Years | 335 (38.3%) | 395 (45.1%) |
| 65 to 74 Years | 348 (92.1%) | 251 (66.4%) |
| 75 Years and over | 246 (100.0%) | 158 (64.2%) |
| Total | 3,187 (44.1%) | 3,964 (54.9%) |
Disability Status by Sex by Age in Winslow
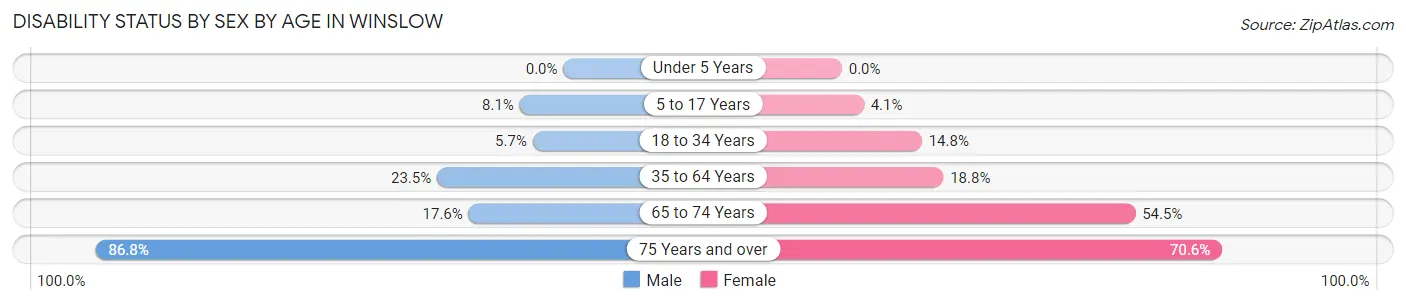
| Age Bracket | Male | Female |
| Under 5 Years | 0 (0.0%) | 0 (0.0%) |
| 5 to 17 Years | 74 (8.1%) | 38 (4.1%) |
| 18 to 34 Years | 54 (5.7%) | 122 (14.8%) |
| 35 to 64 Years | 296 (23.4%) | 209 (18.8%) |
| 65 to 74 Years | 29 (17.6%) | 116 (54.5%) |
| 75 Years and over | 66 (86.8%) | 120 (70.6%) |
Disability Class by Sex by Age in Winslow
Disability Class: Hearing Difficulty
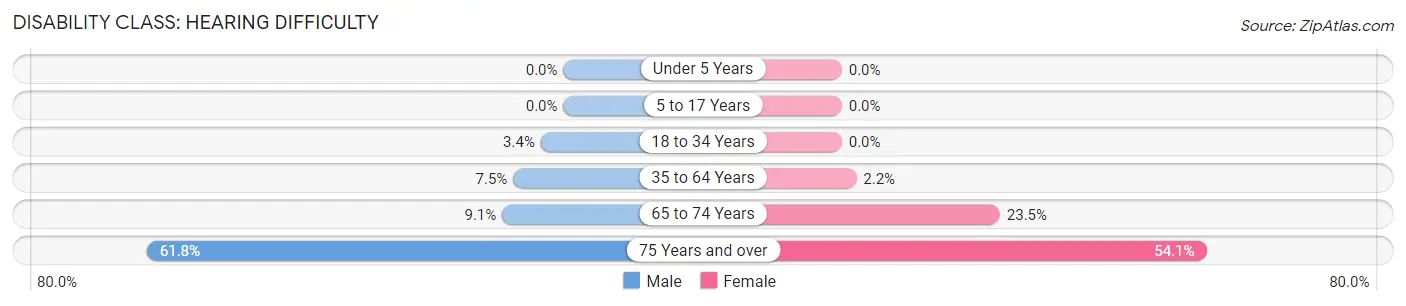
| Age Bracket | Male | Female |
| Under 5 Years | 0 (0.0%) | 0 (0.0%) |
| 5 to 17 Years | 0 (0.0%) | 0 (0.0%) |
| 18 to 34 Years | 32 (3.4%) | 0 (0.0%) |
| 35 to 64 Years | 94 (7.4%) | 24 (2.2%) |
| 65 to 74 Years | 15 (9.1%) | 50 (23.5%) |
| 75 Years and over | 47 (61.8%) | 92 (54.1%) |
Disability Class: Vision Difficulty
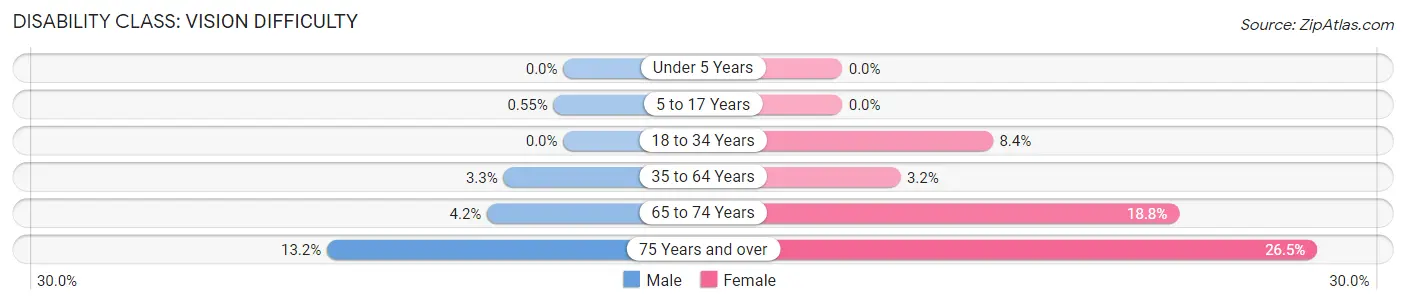
| Age Bracket | Male | Female |
| Under 5 Years | 0 (0.0%) | 0 (0.0%) |
| 5 to 17 Years | 5 (0.5%) | 0 (0.0%) |
| 18 to 34 Years | 0 (0.0%) | 69 (8.4%) |
| 35 to 64 Years | 42 (3.3%) | 36 (3.2%) |
| 65 to 74 Years | 7 (4.2%) | 40 (18.8%) |
| 75 Years and over | 10 (13.2%) | 45 (26.5%) |
Disability Class: Cognitive Difficulty
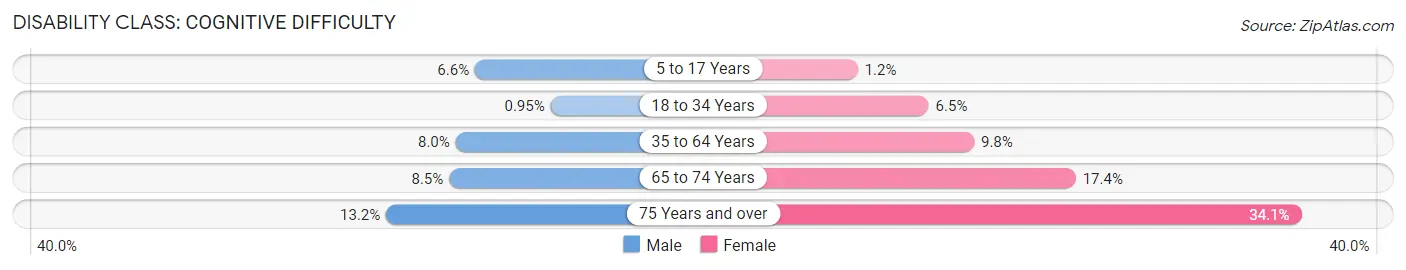
| Age Bracket | Male | Female |
| 5 to 17 Years | 60 (6.6%) | 11 (1.2%) |
| 18 to 34 Years | 9 (0.9%) | 53 (6.5%) |
| 35 to 64 Years | 101 (8.0%) | 109 (9.8%) |
| 65 to 74 Years | 14 (8.5%) | 37 (17.4%) |
| 75 Years and over | 10 (13.2%) | 58 (34.1%) |
Disability Class: Ambulatory Difficulty
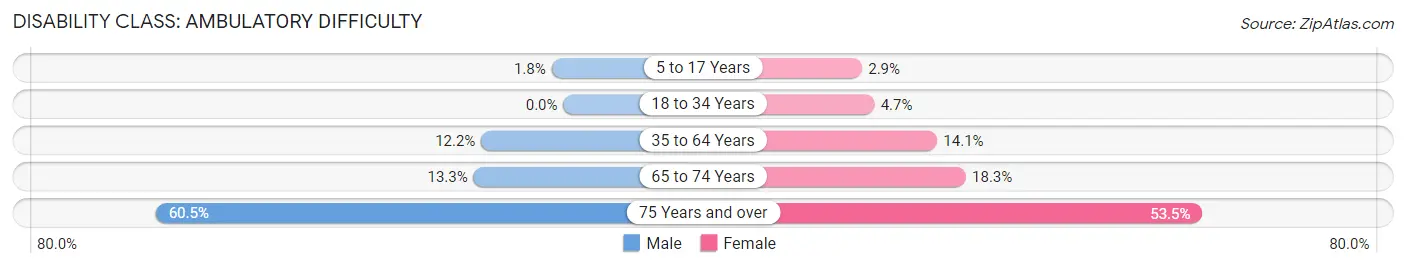
| Age Bracket | Male | Female |
| 5 to 17 Years | 16 (1.8%) | 27 (2.9%) |
| 18 to 34 Years | 0 (0.0%) | 39 (4.7%) |
| 35 to 64 Years | 154 (12.2%) | 156 (14.1%) |
| 65 to 74 Years | 22 (13.3%) | 39 (18.3%) |
| 75 Years and over | 46 (60.5%) | 91 (53.5%) |
Disability Class: Self-Care Difficulty
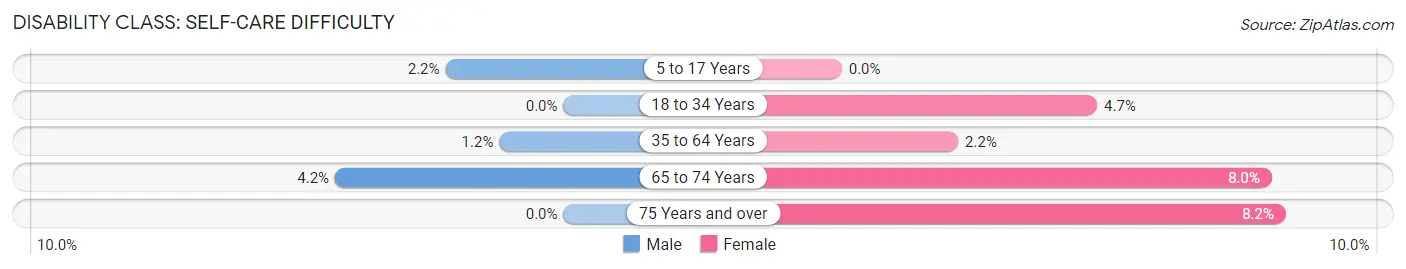
| Age Bracket | Male | Female |
| 5 to 17 Years | 20 (2.2%) | 0 (0.0%) |
| 18 to 34 Years | 0 (0.0%) | 39 (4.7%) |
| 35 to 64 Years | 15 (1.2%) | 24 (2.2%) |
| 65 to 74 Years | 7 (4.2%) | 17 (8.0%) |
| 75 Years and over | 0 (0.0%) | 14 (8.2%) |
Technology Access in Winslow
Computing Device Access in Winslow
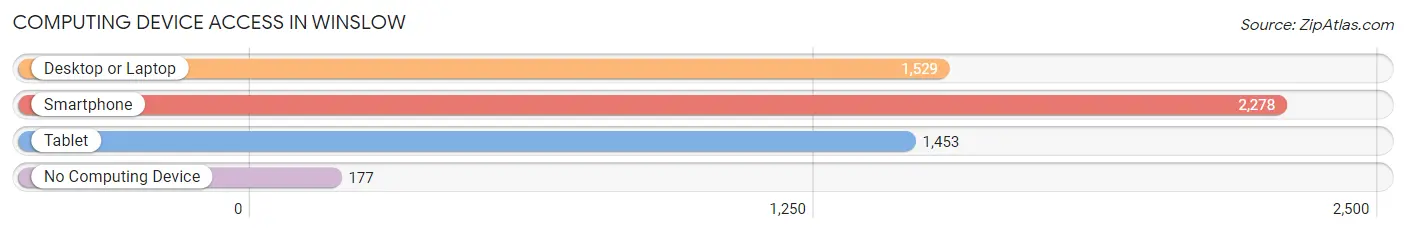
| Device Type | # Households | % Households |
| Desktop or Laptop | 1,529 | 60.0% |
| Smartphone | 2,278 | 89.4% |
| Tablet | 1,453 | 57.0% |
| No Computing Device | 177 | 6.9% |
| Total | 2,549 | 100.0% |
Internet Access in Winslow
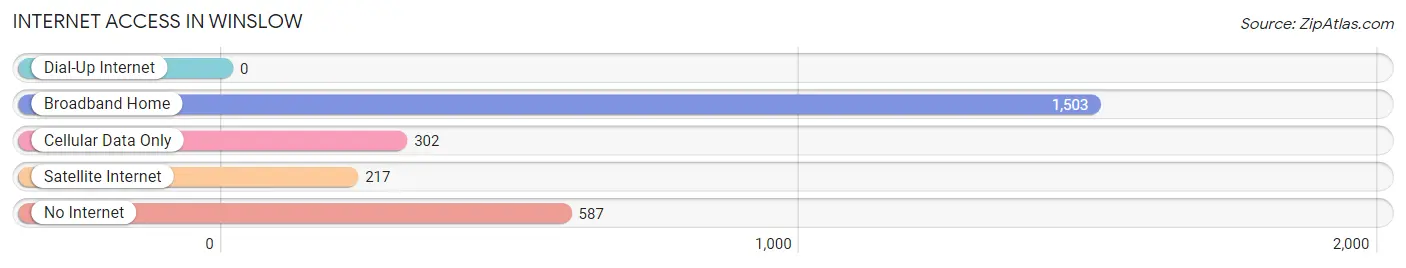
| Internet Type | # Households | % Households |
| Dial-Up Internet | 0 | 0.0% |
| Broadband Home | 1,503 | 59.0% |
| Cellular Data Only | 302 | 11.8% |
| Satellite Internet | 217 | 8.5% |
| No Internet | 587 | 23.0% |
| Total | 2,549 | 100.0% |
Winslow Summary
Winslow, Arizona is a small city located in Navajo County in the northeastern part of the state. It is situated along the historic Route 66 and is the county seat of Navajo County. The city is located at an elevation of 4,735 feet and has a population of 9,655 as of the 2010 census.
History
The area that is now Winslow was first inhabited by the Anasazi people, who lived in the area from about 1000 BC to 1300 AD. The area was later inhabited by the Navajo people, who were the dominant tribe in the area until the late 19th century.
In 1882, the Atlantic and Pacific Railroad (later the Santa Fe Railroad) built a rail line through the area, and the town of Winslow was established in 1882. The town was named after Edward F. Winslow, a railroad official. The town quickly grew and by 1900, it had a population of 1,000.
In the early 20th century, Winslow became a major stop on the famous Route 66. The town was also home to a number of businesses, including a hotel, a bank, a movie theater, and a number of stores.
Geography
Winslow is located in the northeastern part of Arizona, in Navajo County. It is situated along the historic Route 66 and is the county seat of Navajo County. The city is located at an elevation of 4,735 feet and has a total area of 8.2 square miles.
The city is located in the high desert region of Arizona, and the climate is semi-arid. The average temperature in the summer is around 90 degrees Fahrenheit, and the average temperature in the winter is around 40 degrees Fahrenheit.
Economy
The economy of Winslow is largely based on tourism, as the city is located along the historic Route 66. The city is also home to a number of businesses, including a hotel, a bank, a movie theater, and a number of stores.
The city is also home to a number of manufacturing companies, including a steel mill, a lumber mill, and a number of other industrial businesses. The city is also home to a number of government agencies, including the Navajo County Sheriff's Office, the Navajo County Courthouse, and the Winslow Police Department.
Demographics
As of the 2010 census, the population of Winslow was 9,655. The racial makeup of the city was 73.3% White, 0.9% African American, 1.7% Native American, 0.3% Asian, 0.1% Pacific Islander, 20.2% from other races, and 3.5% from two or more races. Hispanic or Latino of any race were 37.2% of the population.
The median income for a household in the city was $30,938, and the median income for a family was $35,938. The per capita income for the city was $15,938. About 20.2% of families and 24.2% of the population were below the poverty line, including 33.3% of those under age 18 and 11.2% of those age 65 or over.
Common Questions
What is the Total Population of Winslow?
Total Population of Winslow is 8,943.
What is the Total Male Population of Winslow?
Total Male Population of Winslow is 5,261.
What is the Total Female Population of Winslow?
Total Female Population of Winslow is 3,682.
What is the Ratio of Males per 100 Females in Winslow?
There are 142.88 Males per 100 Females in Winslow.
What is the Ratio of Females per 100 Males in Winslow?
There are 69.99 Females per 100 Males in Winslow.
What is the Median Population Age in Winslow?
Median Population Age in Winslow is 33.4 Years.
What is the Average Family Size in Winslow
Average Family Size in Winslow is 3.6 People.
What is the Average Household Size in Winslow
Average Household Size in Winslow is 2.8 People.
What is Per Capita Income in Winslow?
Per Capita income in Winslow is $17,339.
What is the Median Family Income in Winslow?
Median Family Income in Winslow is $57,205.
What is the Median Household income in Winslow?
Median Household Income in Winslow is $43,918.
What is Income or Wage Gap in Winslow?
Income or Wage Gap in Winslow is 8.4%.
Women in Winslow earn 91.6 cents for every dollar earned by a man.
What is Family Income Deficit in Winslow?
Family Income Deficit in Winslow is $12,457.
Families that are below poverty line in Winslow earn $12,457 less on average than the poverty threshold level.
What is Inequality or Gini Index in Winslow?
Inequality or Gini Index in Winslow is 0.46.
How Large is the Labor Force in Winslow?
There are 3,345 People in the Labor Forcein in Winslow.
What is the Percentage of People in the Labor Force in Winslow?
49.7% of People are in the Labor Force in Winslow.
What is the Unemployment Rate in Winslow?
Unemployment Rate in Winslow is 9.6%.