Bancroft, WV
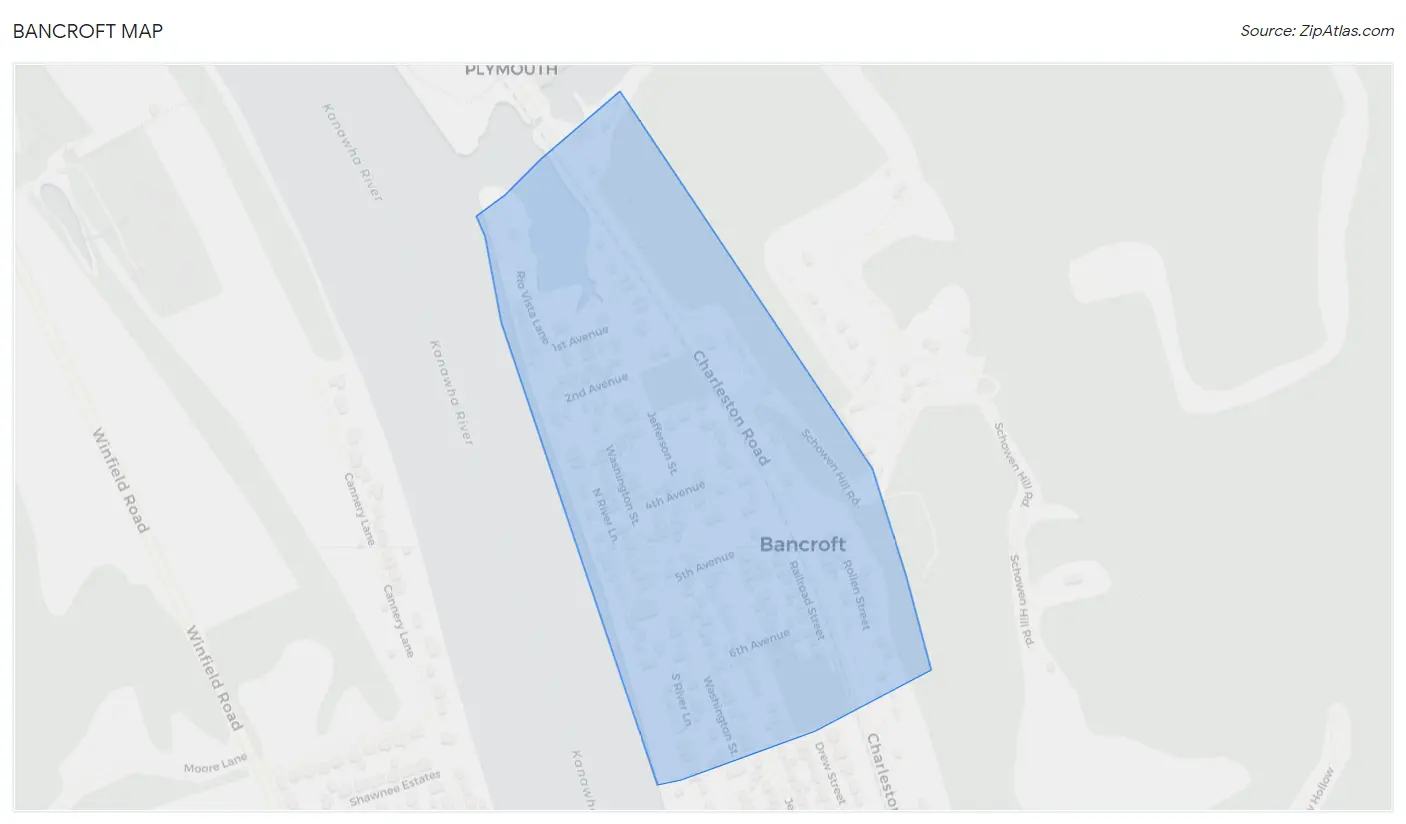
Bancroft Map
Bancroft Overview
466
TOTAL POPULATION
282
MALE POPULATION
184
FEMALE POPULATION
153.26
MALES / 100 FEMALES
65.25
FEMALES / 100 MALES
29.8
MEDIAN AGE
2.7
AVG FAMILY SIZE
2.4
AVG HOUSEHOLD SIZE
$38,877
PER CAPITA INCOME
$80,417
AVG HOUSEHOLD INCOME
51.5%
WAGE / INCOME GAP [ % ]
48.5¢/ $1
WAGE / INCOME GAP [ $ ]
0.32
INEQUALITY / GINI INDEX
260
LABOR FORCE [ PEOPLE ]
61.9%
PERCENT IN LABOR FORCE
0.4%
UNEMPLOYMENT RATE
Bancroft Zip Codes
Bancroft Area Codes
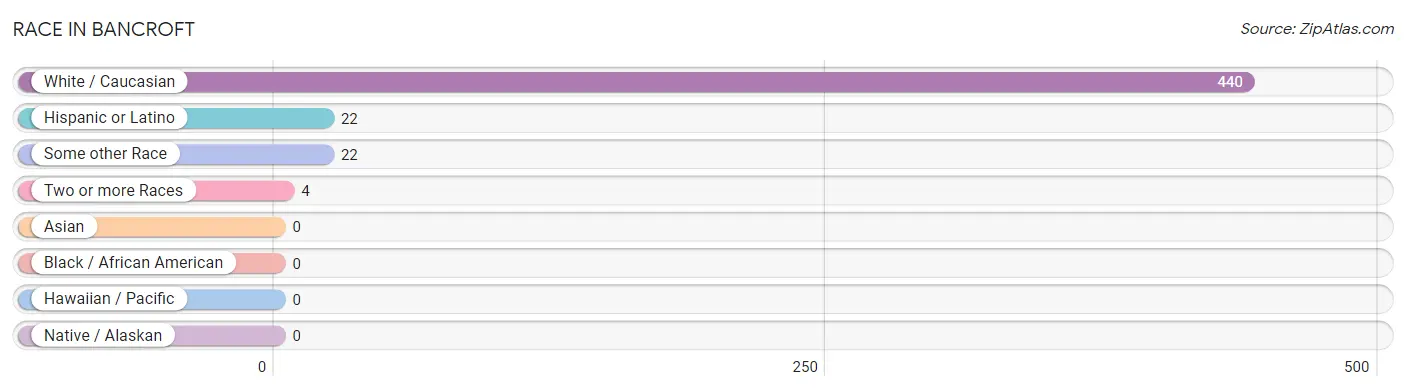
Race in Bancroft
The most populous races in Bancroft are White / Caucasian (440 | 94.4%), Hispanic or Latino (22 | 4.7%), and Some other Race (22 | 4.7%).
| Race | # Population | % Population |
| Asian | 0 | 0.0% |
| Black / African American | 0 | 0.0% |
| Hawaiian / Pacific | 0 | 0.0% |
| Hispanic or Latino | 22 | 4.7% |
| Native / Alaskan | 0 | 0.0% |
| White / Caucasian | 440 | 94.4% |
| Two or more Races | 4 | 0.9% |
| Some other Race | 22 | 4.7% |
| Total | 466 | 100.0% |
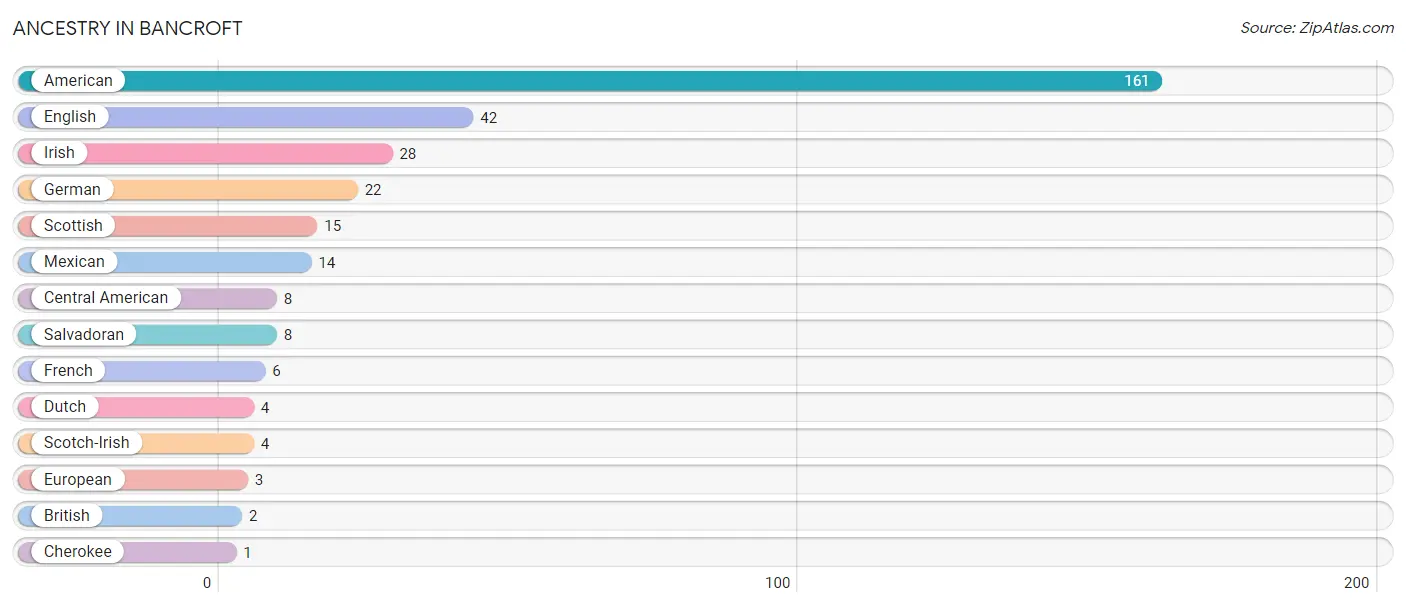
Ancestry in Bancroft
The most populous ancestries reported in Bancroft are American (161 | 34.5%), English (42 | 9.0%), Irish (28 | 6.0%), German (22 | 4.7%), and Scottish (15 | 3.2%), together accounting for 57.5% of all Bancroft residents.
| Ancestry | # Population | % Population |
| American | 161 | 34.5% |
| British | 2 | 0.4% |
| Central American | 8 | 1.7% |
| Cherokee | 1 | 0.2% |
| Dutch | 4 | 0.9% |
| English | 42 | 9.0% |
| European | 3 | 0.6% |
| French | 6 | 1.3% |
| German | 22 | 4.7% |
| Irish | 28 | 6.0% |
| Mexican | 14 | 3.0% |
| Salvadoran | 8 | 1.7% |
| Scotch-Irish | 4 | 0.9% |
| Scottish | 15 | 3.2% | View All 14 Rows |
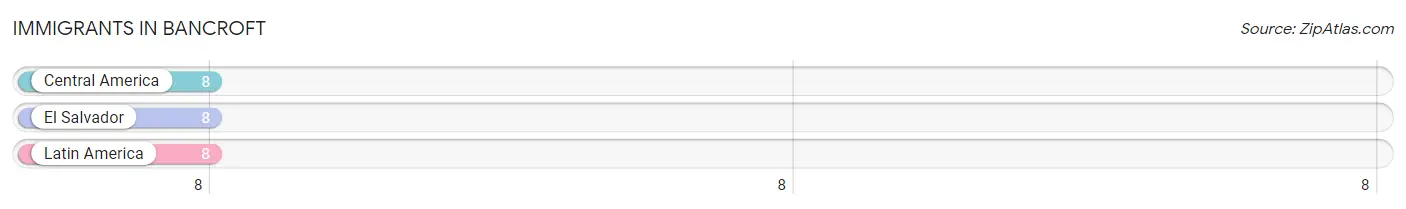
Immigrants in Bancroft
The most numerous immigrant groups reported in Bancroft came from Central America (8 | 1.7%), El Salvador (8 | 1.7%), and Latin America (8 | 1.7%), together accounting for 5.2% of all Bancroft residents.
| Immigration Origin | # Population | % Population |
| Central America | 8 | 1.7% |
| El Salvador | 8 | 1.7% |
| Latin America | 8 | 1.7% | View All 3 Rows |
Sex and Age in Bancroft
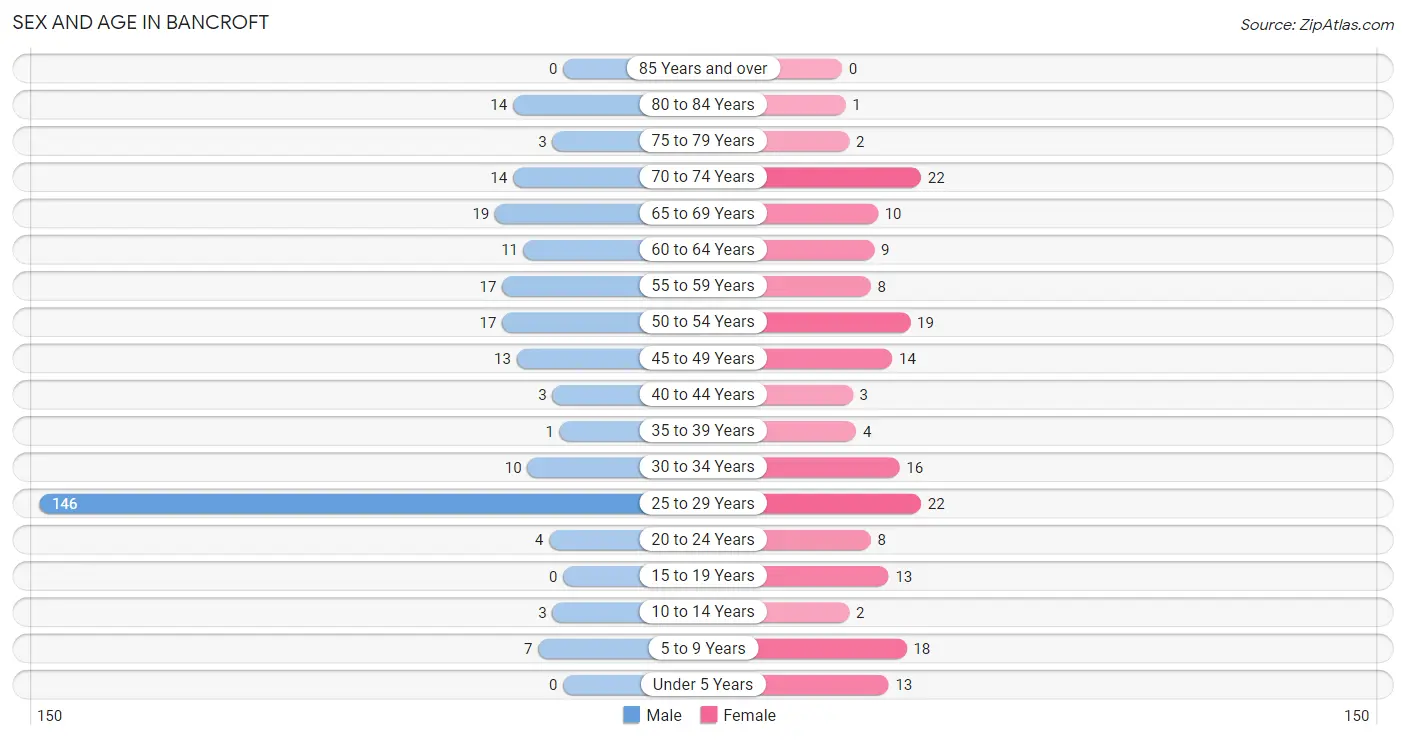
Sex and Age in Bancroft
The most populous age groups in Bancroft are 25 to 29 Years (146 | 51.8%) for men and 25 to 29 Years (22 | 12.0%) for women.
| Age Bracket | Male | Female |
| Under 5 Years | 0 (0.0%) | 13 (7.1%) |
| 5 to 9 Years | 7 (2.5%) | 18 (9.8%) |
| 10 to 14 Years | 3 (1.1%) | 2 (1.1%) |
| 15 to 19 Years | 0 (0.0%) | 13 (7.1%) |
| 20 to 24 Years | 4 (1.4%) | 8 (4.3%) |
| 25 to 29 Years | 146 (51.8%) | 22 (12.0%) |
| 30 to 34 Years | 10 (3.5%) | 16 (8.7%) |
| 35 to 39 Years | 1 (0.4%) | 4 (2.2%) |
| 40 to 44 Years | 3 (1.1%) | 3 (1.6%) |
| 45 to 49 Years | 13 (4.6%) | 14 (7.6%) |
| 50 to 54 Years | 17 (6.0%) | 19 (10.3%) |
| 55 to 59 Years | 17 (6.0%) | 8 (4.3%) |
| 60 to 64 Years | 11 (3.9%) | 9 (4.9%) |
| 65 to 69 Years | 19 (6.7%) | 10 (5.4%) |
| 70 to 74 Years | 14 (5.0%) | 22 (12.0%) |
| 75 to 79 Years | 3 (1.1%) | 2 (1.1%) |
| 80 to 84 Years | 14 (5.0%) | 1 (0.5%) |
| 85 Years and over | 0 (0.0%) | 0 (0.0%) |
| Total | 282 (100.0%) | 184 (100.0%) |
Families and Households in Bancroft
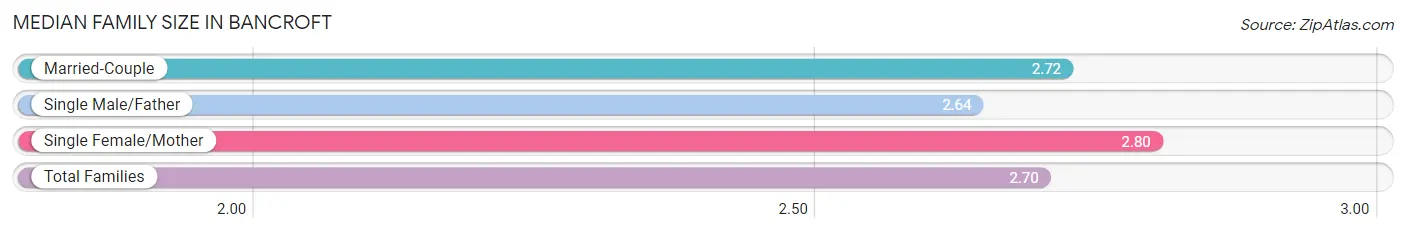
Median Family Size in Bancroft
The median family size in Bancroft is 2.70 persons per family, with single female/mother families (15 | 10.3%) accounting for the largest median family size of 2.8 persons per family. On the other hand, single male/father families (59 | 40.7%) represent the smallest median family size with 2.64 persons per family.
| Family Type | # Families | Family Size |
| Married-Couple | 71 (49.0%) | 2.72 |
| Single Male/Father | 59 (40.7%) | 2.64 |
| Single Female/Mother | 15 (10.3%) | 2.80 |
| Total Families | 145 (100.0%) | 2.70 |
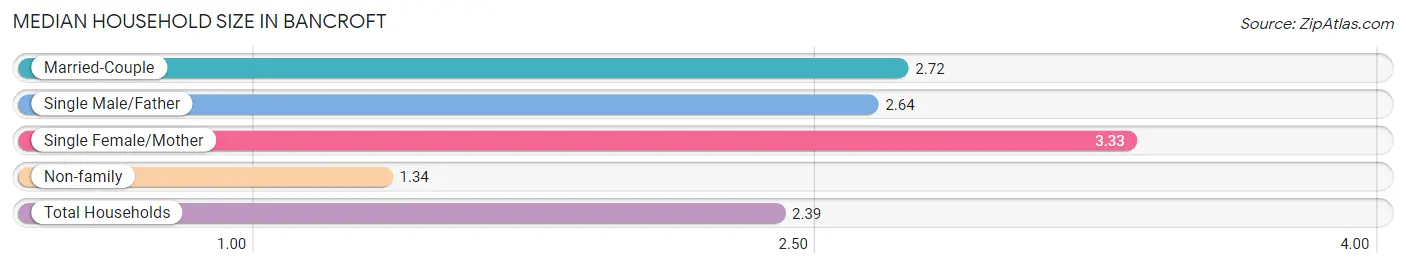
Median Household Size in Bancroft
The median household size in Bancroft is 2.39 persons per household, with single female/mother households (15 | 7.7%) accounting for the largest median household size of 3.33 persons per household. non-family households (50 | 25.6%) represent the smallest median household size with 1.34 persons per household.
| Household Type | # Households | Household Size |
| Married-Couple | 71 (36.4%) | 2.72 |
| Single Male/Father | 59 (30.3%) | 2.64 |
| Single Female/Mother | 15 (7.7%) | 3.33 |
| Non-family | 50 (25.6%) | 1.34 |
| Total Households | 195 (100.0%) | 2.39 |
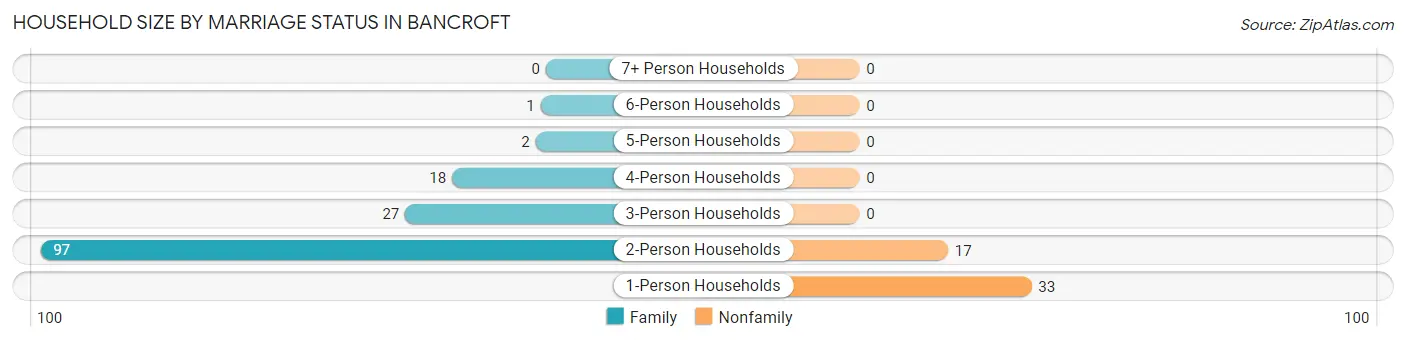
Household Size by Marriage Status in Bancroft
Out of a total of 195 households in Bancroft, 145 (74.4%) are family households, while 50 (25.6%) are nonfamily households. The most numerous type of family households are 2-person households, comprising 97, and the most common type of nonfamily households are 1-person households, comprising 33.
| Household Size | Family Households | Nonfamily Households |
| 1-Person Households | - | 33 (16.9%) |
| 2-Person Households | 97 (49.7%) | 17 (8.7%) |
| 3-Person Households | 27 (13.9%) | 0 (0.0%) |
| 4-Person Households | 18 (9.2%) | 0 (0.0%) |
| 5-Person Households | 2 (1.0%) | 0 (0.0%) |
| 6-Person Households | 1 (0.5%) | 0 (0.0%) |
| 7+ Person Households | 0 (0.0%) | 0 (0.0%) |
| Total | 145 (74.4%) | 50 (25.6%) |
Female Fertility in Bancroft
Fertility by Age in Bancroft
| Age Bracket | Women with Births | Births / 1,000 Women |
| 15 to 19 years | 0 (0.0%) | 0.0 |
| 20 to 34 years | 0 (0.0%) | 0.0 |
| 35 to 50 years | 0 (0.0%) | 0.0 |
| Total | 0 (0.0%) | 0.0 |
Fertility by Age by Marriage Status in Bancroft
| Age Bracket | Married | Unmarried |
| 15 to 19 years | 0 (0.0%) | 0 (0.0%) |
| 20 to 34 years | 0 (0.0%) | 0 (0.0%) |
| 35 to 50 years | 0 (0.0%) | 0 (0.0%) |
| Total | 0 (0.0%) | 0 (0.0%) |
Fertility by Education in Bancroft
| Educational Attainment | Women with Births | Births / 1,000 Women |
| Less than High School | 0 (0.0%) | 0.0 |
| High School Diploma | 0 (0.0%) | 0.0 |
| College or Associate's Degree | 0 (0.0%) | 0.0 |
| Bachelor's Degree | 0 (0.0%) | 0.0 |
| Graduate Degree | 0 (0.0%) | 0.0 |
| Total | 0 (0.0%) | 0.0 |
Fertility by Education by Marriage Status in Bancroft
| Educational Attainment | Married | Unmarried |
| Less than High School | 0 (0.0%) | 0 (0.0%) |
| High School Diploma | 0 (0.0%) | 0 (0.0%) |
| College or Associate's Degree | 0 (0.0%) | 0 (0.0%) |
| Bachelor's Degree | 0 (0.0%) | 0 (0.0%) |
| Graduate Degree | 0 (0.0%) | 0 (0.0%) |
| Total | 0 (0.0%) | 0 (0.0%) |
Income in Bancroft
Income Overview in Bancroft
| Characteristic | Number | Measure |
| Per Capita Income | 466 | $38,877 |
| Median Family Income | 145 | $0 |
| Mean Family Income | 145 | $86,659 |
| Median Household Income | 195 | $80,417 |
| Mean Household Income | 195 | $80,963 |
| Income Deficit | 145 | $0 |
| Wage / Income Gap (%) | 466 | 51.52% |
| Wage / Income Gap ($) | 466 | 48.48¢ per $1 |
| Gini / Inequality Index | 466 | 0.32 |
Earnings by Sex in Bancroft
Average Earnings in Bancroft are $68,049, $68,409 for men and $33,167 for women, a difference of 51.5%.
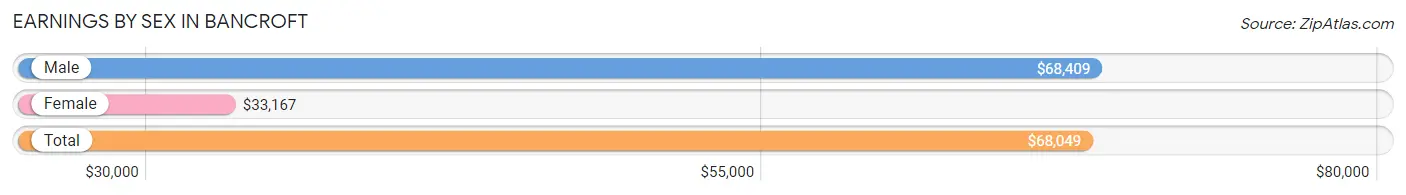
| Sex | Number | Average Earnings |
| Male | 204 (76.1%) | $68,409 |
| Female | 64 (23.9%) | $33,167 |
| Total | 268 (100.0%) | $68,049 |
Earnings by Sex by Income Bracket in Bancroft
The most common earnings brackets in Bancroft are $65,000 to $74,999 for men (134 | 65.7%) and $30,000 to $34,999 for women (16 | 25.0%).
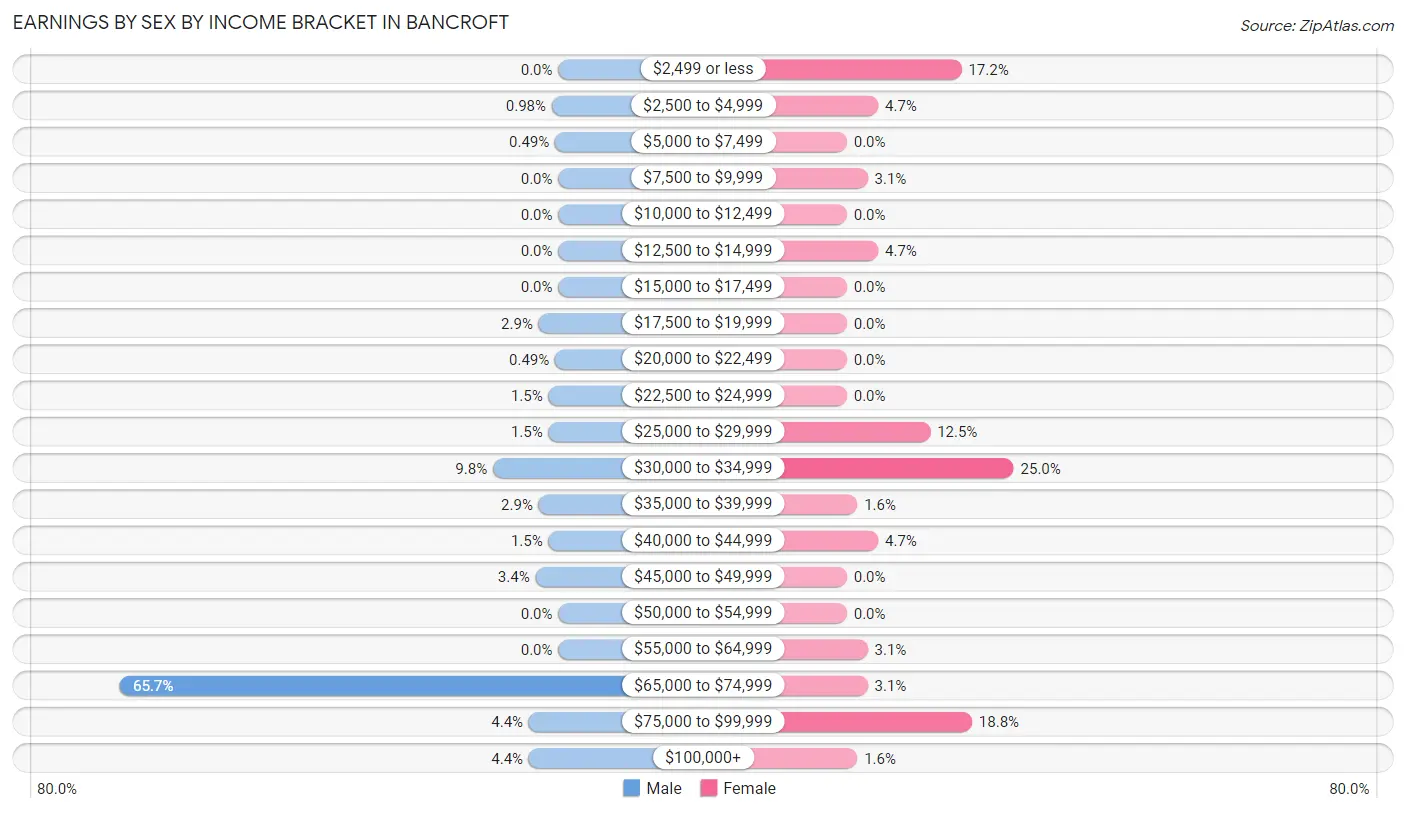
| Income | Male | Female |
| $2,499 or less | 0 (0.0%) | 11 (17.2%) |
| $2,500 to $4,999 | 2 (1.0%) | 3 (4.7%) |
| $5,000 to $7,499 | 1 (0.5%) | 0 (0.0%) |
| $7,500 to $9,999 | 0 (0.0%) | 2 (3.1%) |
| $10,000 to $12,499 | 0 (0.0%) | 0 (0.0%) |
| $12,500 to $14,999 | 0 (0.0%) | 3 (4.7%) |
| $15,000 to $17,499 | 0 (0.0%) | 0 (0.0%) |
| $17,500 to $19,999 | 6 (2.9%) | 0 (0.0%) |
| $20,000 to $22,499 | 1 (0.5%) | 0 (0.0%) |
| $22,500 to $24,999 | 3 (1.5%) | 0 (0.0%) |
| $25,000 to $29,999 | 3 (1.5%) | 8 (12.5%) |
| $30,000 to $34,999 | 20 (9.8%) | 16 (25.0%) |
| $35,000 to $39,999 | 6 (2.9%) | 1 (1.6%) |
| $40,000 to $44,999 | 3 (1.5%) | 3 (4.7%) |
| $45,000 to $49,999 | 7 (3.4%) | 0 (0.0%) |
| $50,000 to $54,999 | 0 (0.0%) | 0 (0.0%) |
| $55,000 to $64,999 | 0 (0.0%) | 2 (3.1%) |
| $65,000 to $74,999 | 134 (65.7%) | 2 (3.1%) |
| $75,000 to $99,999 | 9 (4.4%) | 12 (18.8%) |
| $100,000+ | 9 (4.4%) | 1 (1.6%) |
| Total | 204 (100.0%) | 64 (100.0%) |
Earnings by Sex by Educational Attainment in Bancroft
Average earnings in Bancroft are $68,438 for men and $33,167 for women, a difference of 51.5%. Men with an educational attainment of high school diploma enjoy the highest average annual earnings of $68,561, while those with high school diploma education earn the least with $68,561. Women with an educational attainment of college or associate's degree earn the most with the average annual earnings of $88,438, while those with high school diploma education have the smallest earnings of $29,063.
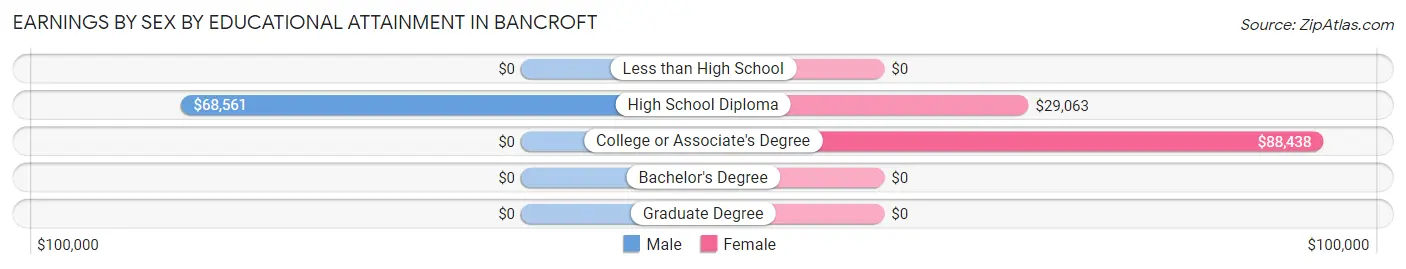
| Educational Attainment | Male Income | Female Income |
| Less than High School | - | - |
| High School Diploma | $68,561 | $29,063 |
| College or Associate's Degree | - | - |
| Bachelor's Degree | - | - |
| Graduate Degree | - | - |
| Total | $68,438 | $33,167 |
Family Income in Bancroft
Family Income Brackets in Bancroft
According to the Bancroft family income data, there are 65 families falling into the $100,000 to $149,999 income range, which is the most common income bracket and makes up 44.8% of all families.
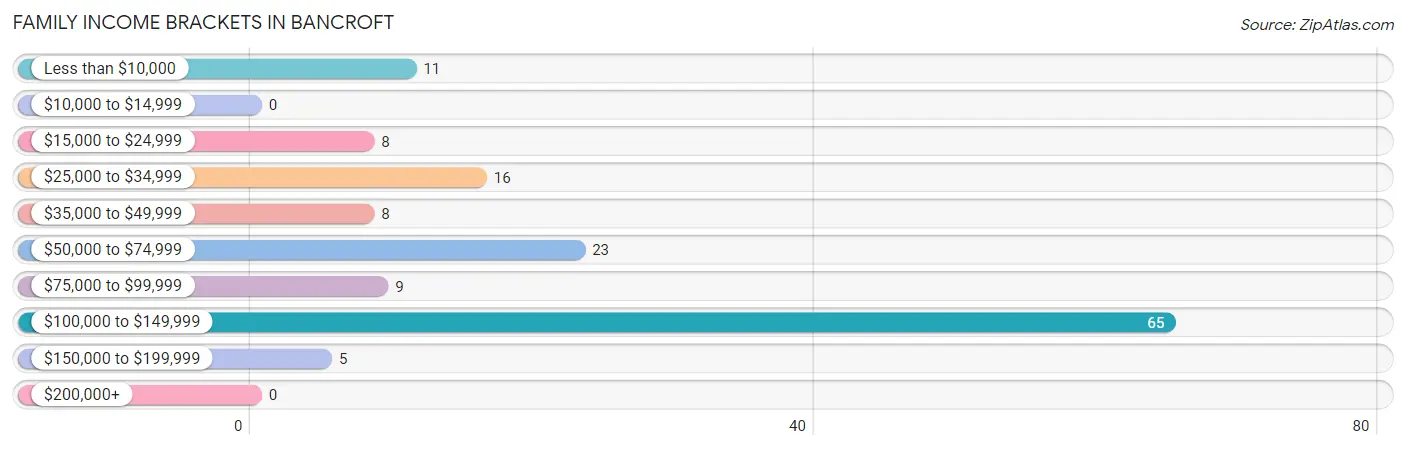
| Income Bracket | # Families | % Families |
| Less than $10,000 | 11 | 7.6% |
| $10,000 to $14,999 | 0 | 0.0% |
| $15,000 to $24,999 | 8 | 5.5% |
| $25,000 to $34,999 | 16 | 11.0% |
| $35,000 to $49,999 | 8 | 5.5% |
| $50,000 to $74,999 | 23 | 15.9% |
| $75,000 to $99,999 | 9 | 6.2% |
| $100,000 to $149,999 | 65 | 44.8% |
| $150,000 to $199,999 | 5 | 3.4% |
| $200,000+ | 0 | 0.0% |
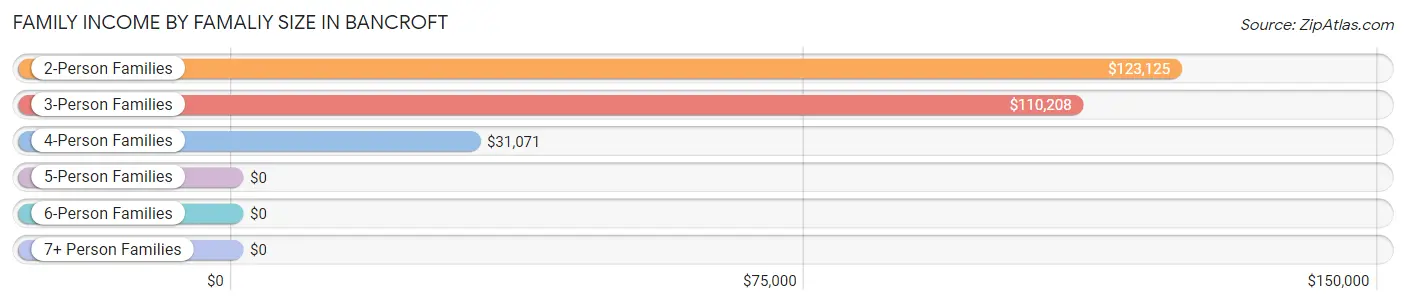
Family Income by Famaliy Size in Bancroft
2-person families (105 | 72.4%) account for the highest median family income in Bancroft with $123,125 per family, while 2-person families (105 | 72.4%) have the highest median income of $61,562 per family member.
| Income Bracket | # Families | Median Income |
| 2-Person Families | 105 (72.4%) | $123,125 |
| 3-Person Families | 19 (13.1%) | $110,208 |
| 4-Person Families | 18 (12.4%) | $31,071 |
| 5-Person Families | 2 (1.4%) | $0 |
| 6-Person Families | 1 (0.7%) | $0 |
| 7+ Person Families | 0 (0.0%) | $0 |
| Total | 145 (100.0%) | $0 |
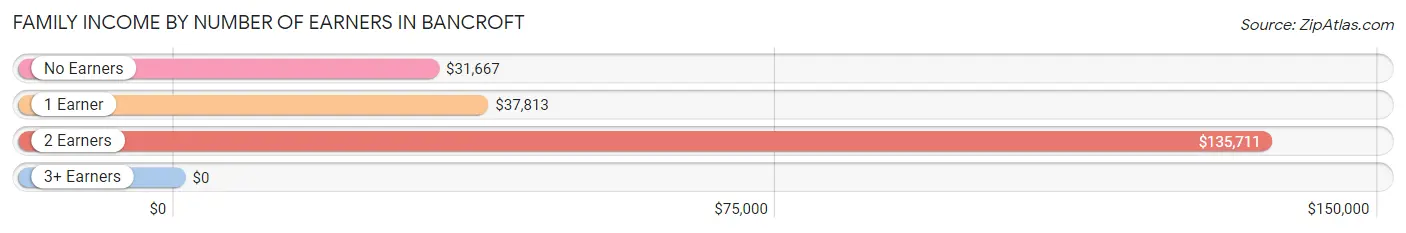
Family Income by Number of Earners in Bancroft
| Number of Earners | # Families | Median Income |
| No Earners | 44 (30.3%) | $31,667 |
| 1 Earner | 21 (14.5%) | $37,813 |
| 2 Earners | 73 (50.3%) | $135,711 |
| 3+ Earners | 7 (4.8%) | $0 |
| Total | 145 (100.0%) | $0 |
Household Income in Bancroft
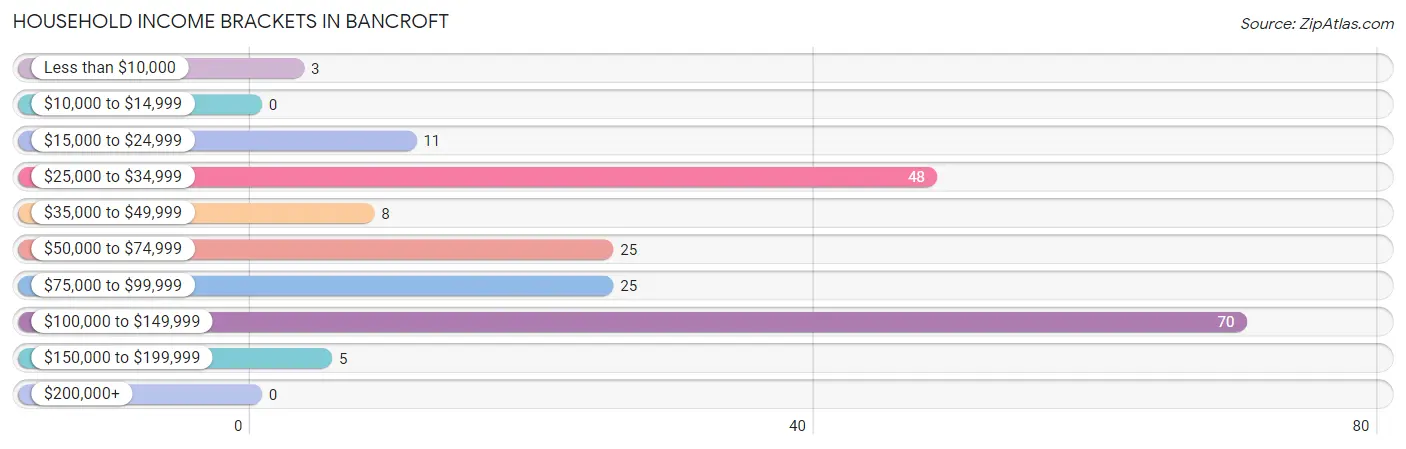
Household Income Brackets in Bancroft
With 70 households falling in the category, the $100,000 to $149,999 income range is the most frequent in Bancroft, accounting for 35.9% of all households.
| Income Bracket | # Households | % Households |
| Less than $10,000 | 3 | 1.5% |
| $10,000 to $14,999 | 0 | 0.0% |
| $15,000 to $24,999 | 11 | 5.6% |
| $25,000 to $34,999 | 48 | 24.6% |
| $35,000 to $49,999 | 8 | 4.1% |
| $50,000 to $74,999 | 25 | 12.8% |
| $75,000 to $99,999 | 25 | 12.8% |
| $100,000 to $149,999 | 70 | 35.9% |
| $150,000 to $199,999 | 5 | 2.6% |
| $200,000+ | 0 | 0.0% |
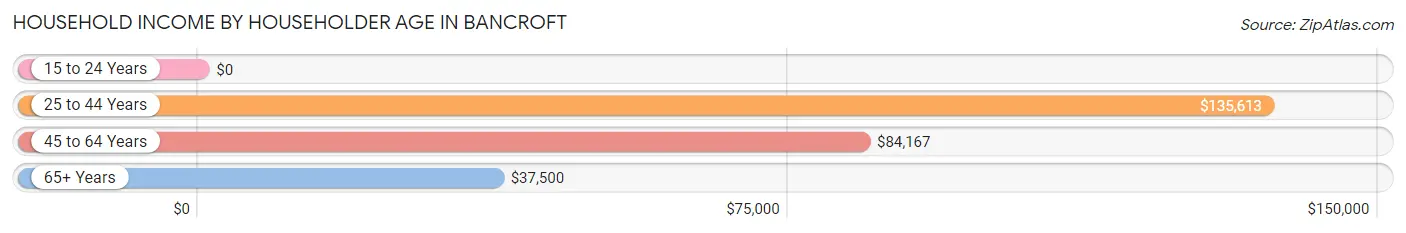
Household Income by Householder Age in Bancroft
The median household income in Bancroft is $80,417, with the highest median household income of $135,613 found in the 25 to 44 years age bracket for the primary householder. A total of 77 households (39.5%) fall into this category. Meanwhile, the 15 to 24 years age bracket for the primary householder has the lowest median household income of $0, with 8 households (4.1%) in this group.
| Income Bracket | # Households | Median Income |
| 15 to 24 Years | 8 (4.1%) | $0 |
| 25 to 44 Years | 77 (39.5%) | $135,613 |
| 45 to 64 Years | 62 (31.8%) | $84,167 |
| 65+ Years | 48 (24.6%) | $37,500 |
| Total | 195 (100.0%) | $80,417 |
Poverty in Bancroft
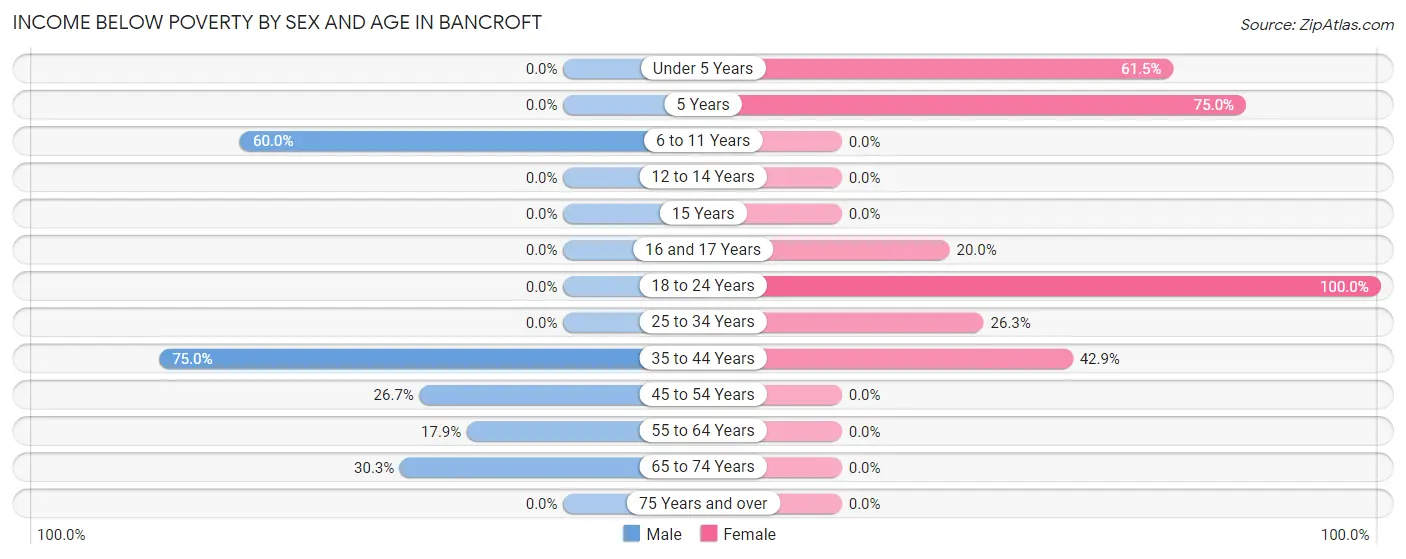
Income Below Poverty by Sex and Age in Bancroft
With 11.4% poverty level for males and 18.5% for females among the residents of Bancroft, 35 to 44 year old males and 18 to 24 year old females are the most vulnerable to poverty, with 3 males (75.0%) and 8 females (100.0%) in their respective age groups living below the poverty level.
| Age Bracket | Male | Female |
| Under 5 Years | 0 (0.0%) | 8 (61.5%) |
| 5 Years | 0 (0.0%) | 3 (75.0%) |
| 6 to 11 Years | 6 (60.0%) | 0 (0.0%) |
| 12 to 14 Years | 0 (0.0%) | 0 (0.0%) |
| 15 Years | 0 (0.0%) | 0 (0.0%) |
| 16 and 17 Years | 0 (0.0%) | 2 (20.0%) |
| 18 to 24 Years | 0 (0.0%) | 8 (100.0%) |
| 25 to 34 Years | 0 (0.0%) | 10 (26.3%) |
| 35 to 44 Years | 3 (75.0%) | 3 (42.9%) |
| 45 to 54 Years | 8 (26.7%) | 0 (0.0%) |
| 55 to 64 Years | 5 (17.9%) | 0 (0.0%) |
| 65 to 74 Years | 10 (30.3%) | 0 (0.0%) |
| 75 Years and over | 0 (0.0%) | 0 (0.0%) |
| Total | 32 (11.4%) | 34 (18.5%) |
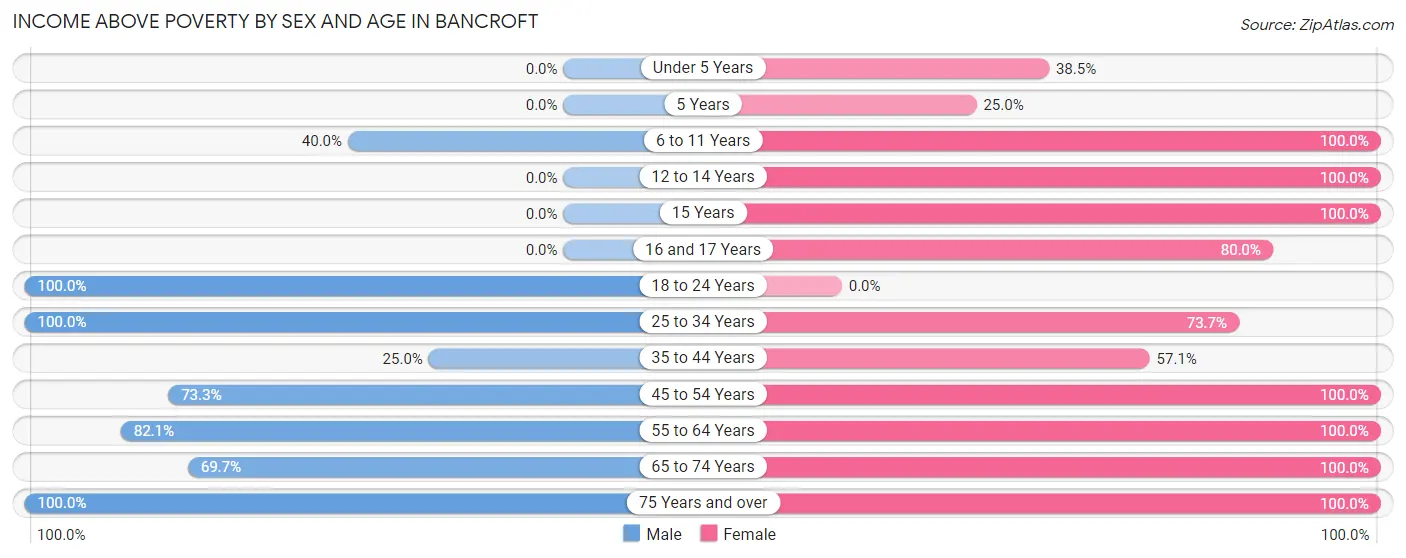
Income Above Poverty by Sex and Age in Bancroft
According to the poverty statistics in Bancroft, males aged 18 to 24 years and females aged 6 to 11 years are the age groups that are most secure financially, with 100.0% of males and 100.0% of females in these age groups living above the poverty line.
| Age Bracket | Male | Female |
| Under 5 Years | 0 (0.0%) | 5 (38.5%) |
| 5 Years | 0 (0.0%) | 1 (25.0%) |
| 6 to 11 Years | 4 (40.0%) | 15 (100.0%) |
| 12 to 14 Years | 0 (0.0%) | 1 (100.0%) |
| 15 Years | 0 (0.0%) | 3 (100.0%) |
| 16 and 17 Years | 0 (0.0%) | 8 (80.0%) |
| 18 to 24 Years | 4 (100.0%) | 0 (0.0%) |
| 25 to 34 Years | 156 (100.0%) | 28 (73.7%) |
| 35 to 44 Years | 1 (25.0%) | 4 (57.1%) |
| 45 to 54 Years | 22 (73.3%) | 33 (100.0%) |
| 55 to 64 Years | 23 (82.1%) | 17 (100.0%) |
| 65 to 74 Years | 23 (69.7%) | 32 (100.0%) |
| 75 Years and over | 17 (100.0%) | 3 (100.0%) |
| Total | 250 (88.6%) | 150 (81.5%) |
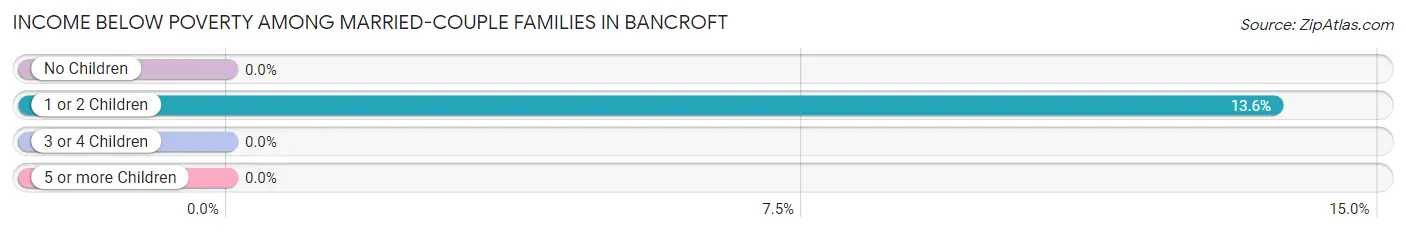
Income Below Poverty Among Married-Couple Families in Bancroft
The poverty statistics for married-couple families in Bancroft show that 4.2% or 3 of the total 71 families live below the poverty line. Families with 1 or 2 children have the highest poverty rate of 13.6%, comprising of 3 families. On the other hand, families with no children have the lowest poverty rate of 0.0%, which includes 0 families.
| Children | Above Poverty | Below Poverty |
| No Children | 48 (100.0%) | 0 (0.0%) |
| 1 or 2 Children | 19 (86.4%) | 3 (13.6%) |
| 3 or 4 Children | 1 (100.0%) | 0 (0.0%) |
| 5 or more Children | 0 (0.0%) | 0 (0.0%) |
| Total | 68 (95.8%) | 3 (4.2%) |
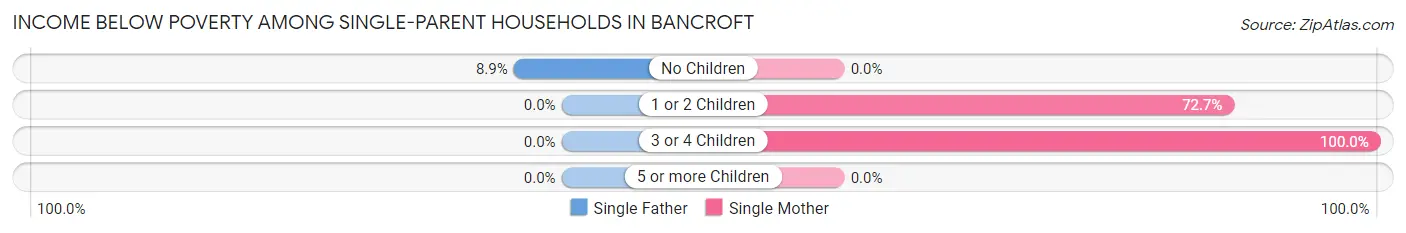
Income Below Poverty Among Single-Parent Households in Bancroft
According to the poverty data in Bancroft, 8.5% or 5 single-father households and 73.3% or 11 single-mother households are living below the poverty line. Among single-father households, those with no children have the highest poverty rate, with 5 households (8.9%) experiencing poverty. Likewise, among single-mother households, those with 3 or 4 children have the highest poverty rate, with 3 households (100.0%) falling below the poverty line.
| Children | Single Father | Single Mother |
| No Children | 5 (8.9%) | 0 (0.0%) |
| 1 or 2 Children | 0 (0.0%) | 8 (72.7%) |
| 3 or 4 Children | 0 (0.0%) | 3 (100.0%) |
| 5 or more Children | 0 (0.0%) | 0 (0.0%) |
| Total | 5 (8.5%) | 11 (73.3%) |
Income Below Poverty Among Married-Couple vs Single-Parent Households in Bancroft
The poverty data for Bancroft shows that 3 of the married-couple family households (4.2%) and 16 of the single-parent households (21.6%) are living below the poverty level. Within the married-couple family households, those with 1 or 2 children have the highest poverty rate, with 3 households (13.6%) falling below the poverty line. Among the single-parent households, those with 3 or 4 children have the highest poverty rate, with 3 household (100.0%) living below poverty.
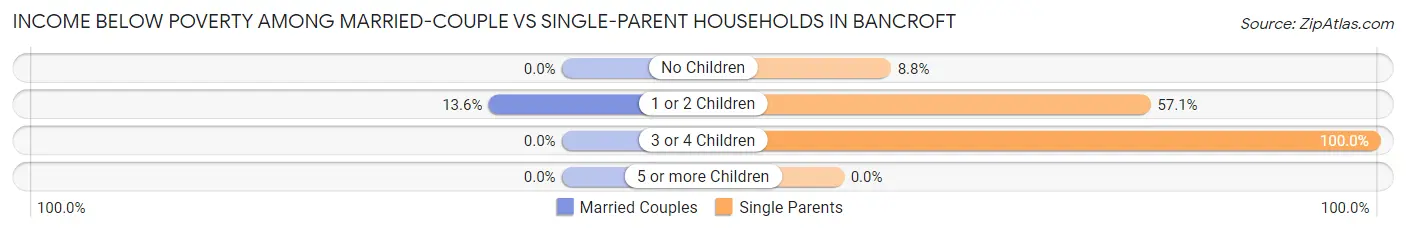
| Children | Married-Couple Families | Single-Parent Households |
| No Children | 0 (0.0%) | 5 (8.8%) |
| 1 or 2 Children | 3 (13.6%) | 8 (57.1%) |
| 3 or 4 Children | 0 (0.0%) | 3 (100.0%) |
| 5 or more Children | 0 (0.0%) | 0 (0.0%) |
| Total | 3 (4.2%) | 16 (21.6%) |
Employment Characteristics in Bancroft
Employment by Class of Employer in Bancroft
Among the 253 employed individuals in Bancroft, private company employees (147 | 58.1%), local government employees (96 | 37.9%), and self-employed (incorporated) (9 | 3.6%) make up the most common classes of employment.
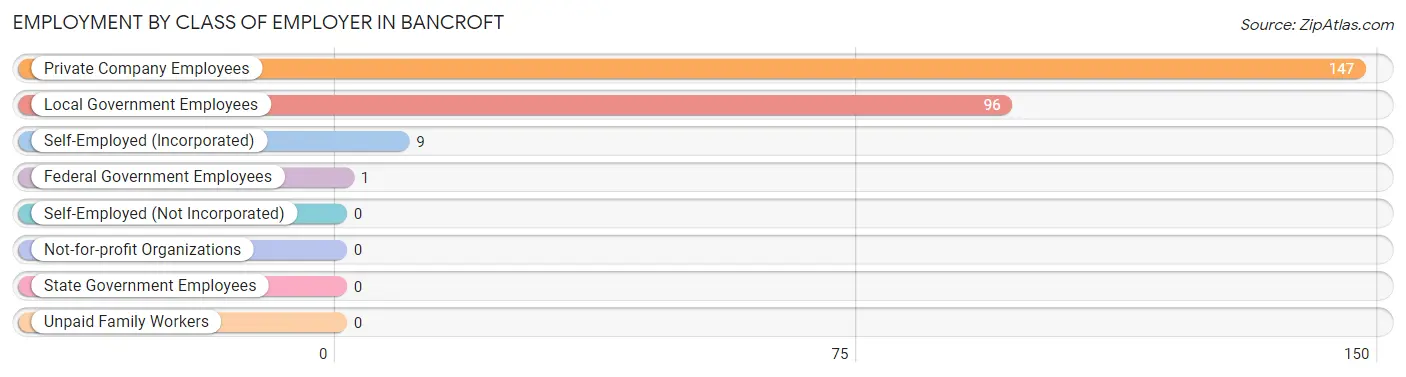
| Employer Class | # Employees | % Employees |
| Private Company Employees | 147 | 58.1% |
| Self-Employed (Incorporated) | 9 | 3.6% |
| Self-Employed (Not Incorporated) | 0 | 0.0% |
| Not-for-profit Organizations | 0 | 0.0% |
| Local Government Employees | 96 | 37.9% |
| State Government Employees | 0 | 0.0% |
| Federal Government Employees | 1 | 0.4% |
| Unpaid Family Workers | 0 | 0.0% |
| Total | 253 | 100.0% |
Employment Status by Age in Bancroft
According to the labor force statistics for Bancroft, out of the total population over 16 years of age (420), 61.9% or 260 individuals are in the labor force, with 0.4% or 1 of them unemployed. The age group with the highest labor force participation rate is 25 to 29 years, with 100.0% or 168 individuals in the labor force. Within the labor force, the 20 to 24 years age range has the highest percentage of unemployed individuals, with 25.0% or 1 of them being unemployed.
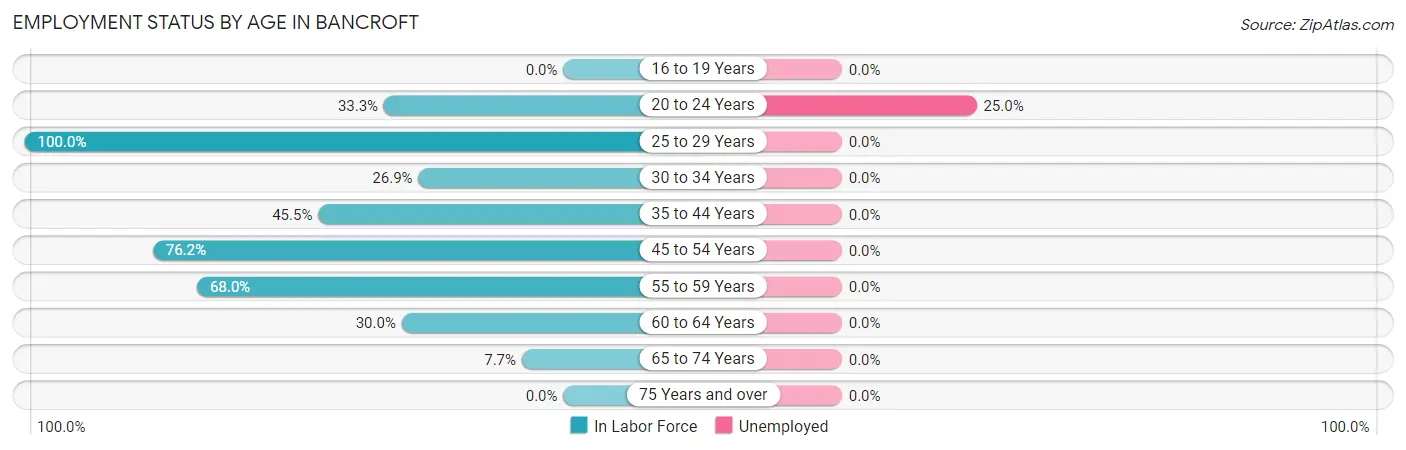
| Age Bracket | In Labor Force | Unemployed |
| 16 to 19 Years | 0 (0.0%) | 0 (0.0%) |
| 20 to 24 Years | 4 (33.3%) | 1 (25.0%) |
| 25 to 29 Years | 168 (100.0%) | 0 (0.0%) |
| 30 to 34 Years | 7 (26.9%) | 0 (0.0%) |
| 35 to 44 Years | 5 (45.5%) | 0 (0.0%) |
| 45 to 54 Years | 48 (76.2%) | 0 (0.0%) |
| 55 to 59 Years | 17 (68.0%) | 0 (0.0%) |
| 60 to 64 Years | 6 (30.0%) | 0 (0.0%) |
| 65 to 74 Years | 5 (7.7%) | 0 (0.0%) |
| 75 Years and over | 0 (0.0%) | 0 (0.0%) |
| Total | 260 (61.9%) | 1 (0.4%) |
Employment Status by Educational Attainment in Bancroft
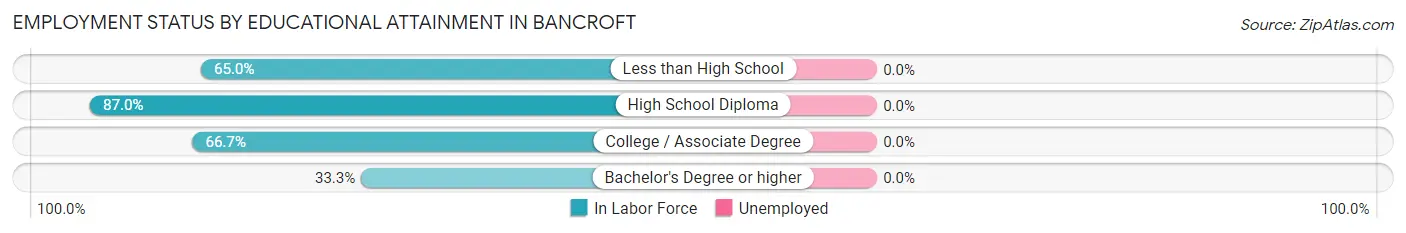
| Educational Attainment | In Labor Force | Unemployed |
| Less than High School | 13 (65.0%) | 0 (0.0%) |
| High School Diploma | 200 (87.0%) | 0 (0.0%) |
| College / Associate Degree | 34 (66.7%) | 0 (0.0%) |
| Bachelor's Degree or higher | 4 (33.3%) | 0 (0.0%) |
| Total | 251 (80.2%) | 0 (0.0%) |
Employment Occupations by Sex in Bancroft
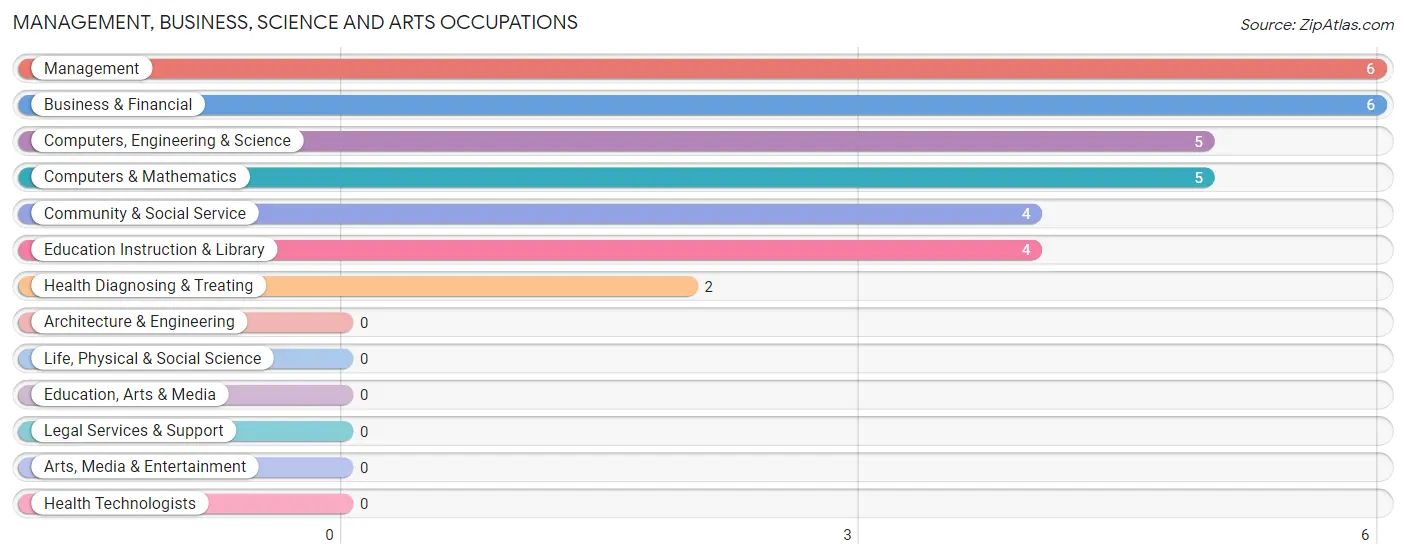
Management, Business, Science and Arts Occupations
The most common Management, Business, Science and Arts occupations in Bancroft are Management (6 | 2.3%), Business & Financial (6 | 2.3%), Computers, Engineering & Science (5 | 1.9%), Computers & Mathematics (5 | 1.9%), and Community & Social Service (4 | 1.5%).
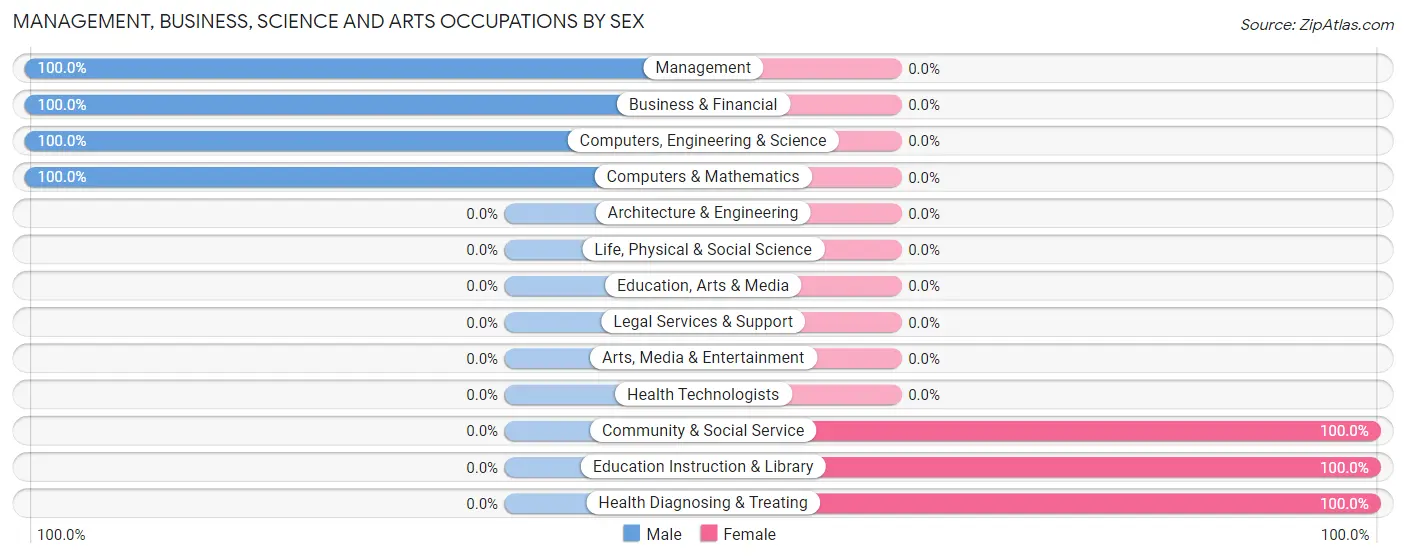
Management, Business, Science and Arts Occupations by Sex
Within the Management, Business, Science and Arts occupations in Bancroft, the most male-oriented occupations are Management (100.0%), Business & Financial (100.0%), and Computers, Engineering & Science (100.0%), while the most female-oriented occupations are Community & Social Service (100.0%), Education Instruction & Library (100.0%), and Health Diagnosing & Treating (100.0%).
| Occupation | Male | Female |
| Management | 6 (100.0%) | 0 (0.0%) |
| Business & Financial | 6 (100.0%) | 0 (0.0%) |
| Computers, Engineering & Science | 5 (100.0%) | 0 (0.0%) |
| Computers & Mathematics | 5 (100.0%) | 0 (0.0%) |
| Architecture & Engineering | 0 (0.0%) | 0 (0.0%) |
| Life, Physical & Social Science | 0 (0.0%) | 0 (0.0%) |
| Community & Social Service | 0 (0.0%) | 4 (100.0%) |
| Education, Arts & Media | 0 (0.0%) | 0 (0.0%) |
| Legal Services & Support | 0 (0.0%) | 0 (0.0%) |
| Education Instruction & Library | 0 (0.0%) | 4 (100.0%) |
| Arts, Media & Entertainment | 0 (0.0%) | 0 (0.0%) |
| Health Diagnosing & Treating | 0 (0.0%) | 2 (100.0%) |
| Health Technologists | 0 (0.0%) | 0 (0.0%) |
| Total (Category) | 17 (73.9%) | 6 (26.1%) |
| Total (Overall) | 200 (77.2%) | 59 (22.8%) |
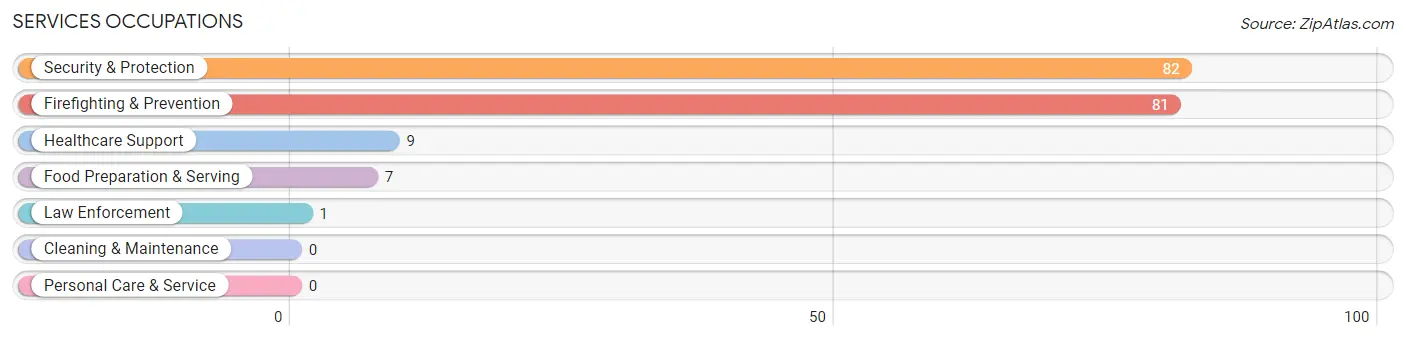
Services Occupations
The most common Services occupations in Bancroft are Security & Protection (82 | 31.7%), Firefighting & Prevention (81 | 31.3%), Healthcare Support (9 | 3.5%), Food Preparation & Serving (7 | 2.7%), and Law Enforcement (1 | 0.4%).
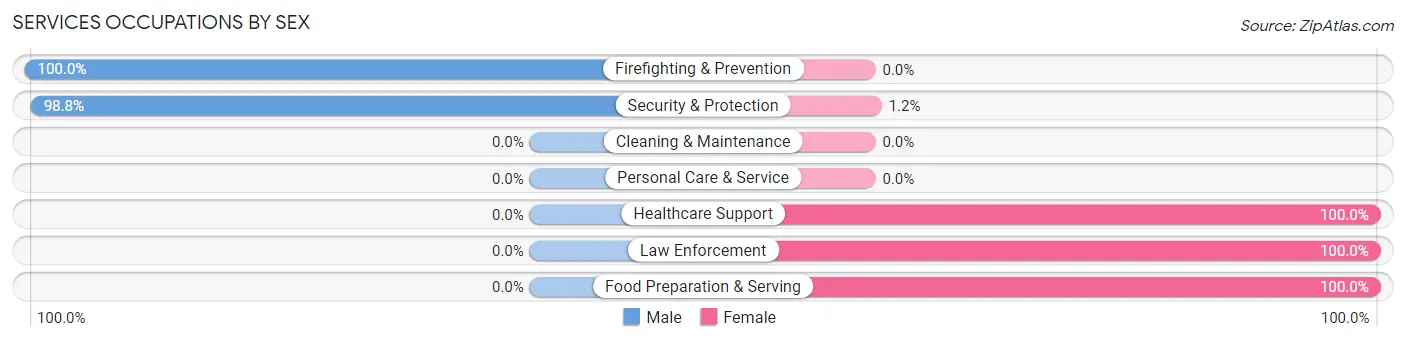
Services Occupations by Sex
Within the Services occupations in Bancroft, the most male-oriented occupations are Firefighting & Prevention (100.0%), and Security & Protection (98.8%), while the most female-oriented occupations are Healthcare Support (100.0%), Law Enforcement (100.0%), and Food Preparation & Serving (100.0%).
| Occupation | Male | Female |
| Healthcare Support | 0 (0.0%) | 9 (100.0%) |
| Security & Protection | 81 (98.8%) | 1 (1.2%) |
| Firefighting & Prevention | 81 (100.0%) | 0 (0.0%) |
| Law Enforcement | 0 (0.0%) | 1 (100.0%) |
| Food Preparation & Serving | 0 (0.0%) | 7 (100.0%) |
| Cleaning & Maintenance | 0 (0.0%) | 0 (0.0%) |
| Personal Care & Service | 0 (0.0%) | 0 (0.0%) |
| Total (Category) | 81 (82.7%) | 17 (17.3%) |
| Total (Overall) | 200 (77.2%) | 59 (22.8%) |
Sales and Office Occupations
The most common Sales and Office occupations in Bancroft are Office & Administration (34 | 13.1%), and Sales & Related (3 | 1.2%).
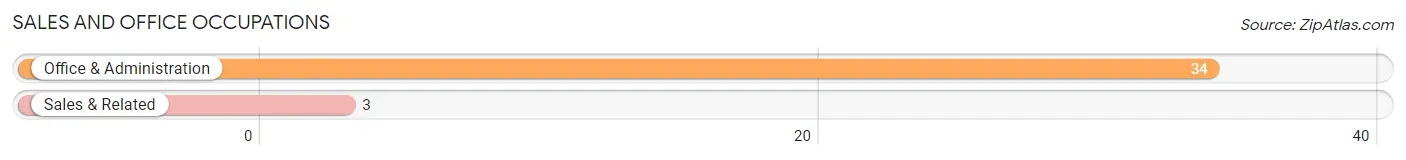
Sales and Office Occupations by Sex

| Occupation | Male | Female |
| Sales & Related | 3 (100.0%) | 0 (0.0%) |
| Office & Administration | 11 (32.4%) | 23 (67.6%) |
| Total (Category) | 14 (37.8%) | 23 (62.2%) |
| Total (Overall) | 200 (77.2%) | 59 (22.8%) |
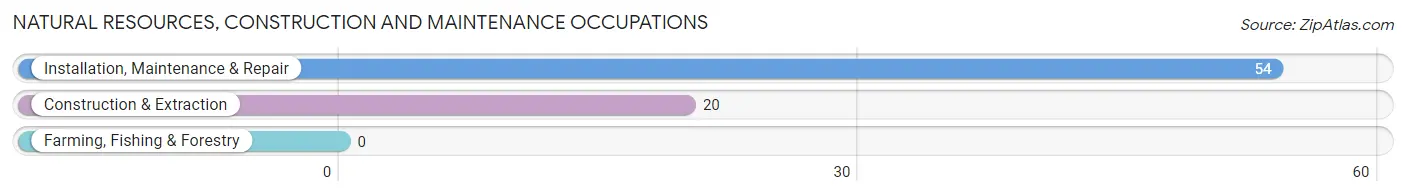
Natural Resources, Construction and Maintenance Occupations
The most common Natural Resources, Construction and Maintenance occupations in Bancroft are Installation, Maintenance & Repair (54 | 20.8%), and Construction & Extraction (20 | 7.7%).
Natural Resources, Construction and Maintenance Occupations by Sex
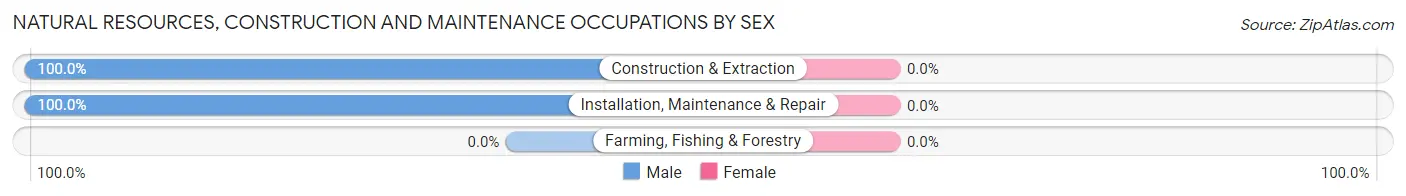
| Occupation | Male | Female |
| Farming, Fishing & Forestry | 0 (0.0%) | 0 (0.0%) |
| Construction & Extraction | 20 (100.0%) | 0 (0.0%) |
| Installation, Maintenance & Repair | 54 (100.0%) | 0 (0.0%) |
| Total (Category) | 74 (100.0%) | 0 (0.0%) |
| Total (Overall) | 200 (77.2%) | 59 (22.8%) |
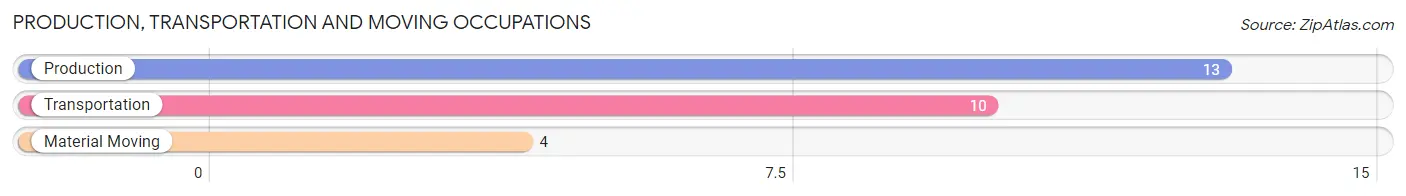
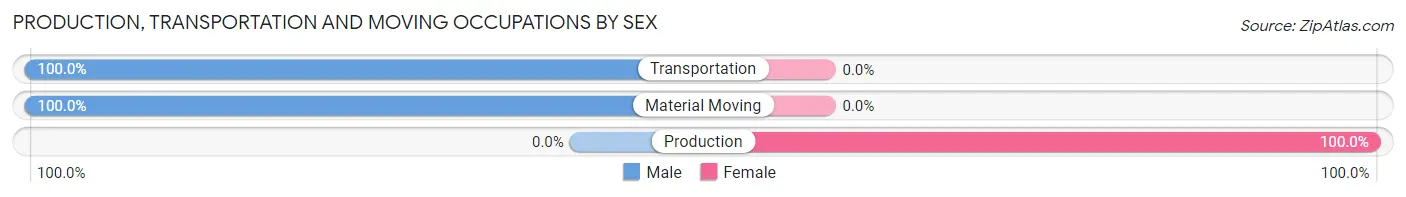
Production, Transportation and Moving Occupations
The most common Production, Transportation and Moving occupations in Bancroft are Production (13 | 5.0%), Transportation (10 | 3.9%), and Material Moving (4 | 1.5%).
Production, Transportation and Moving Occupations by Sex
| Occupation | Male | Female |
| Production | 0 (0.0%) | 13 (100.0%) |
| Transportation | 10 (100.0%) | 0 (0.0%) |
| Material Moving | 4 (100.0%) | 0 (0.0%) |
| Total (Category) | 14 (51.8%) | 13 (48.1%) |
| Total (Overall) | 200 (77.2%) | 59 (22.8%) |
Employment Industries by Sex in Bancroft
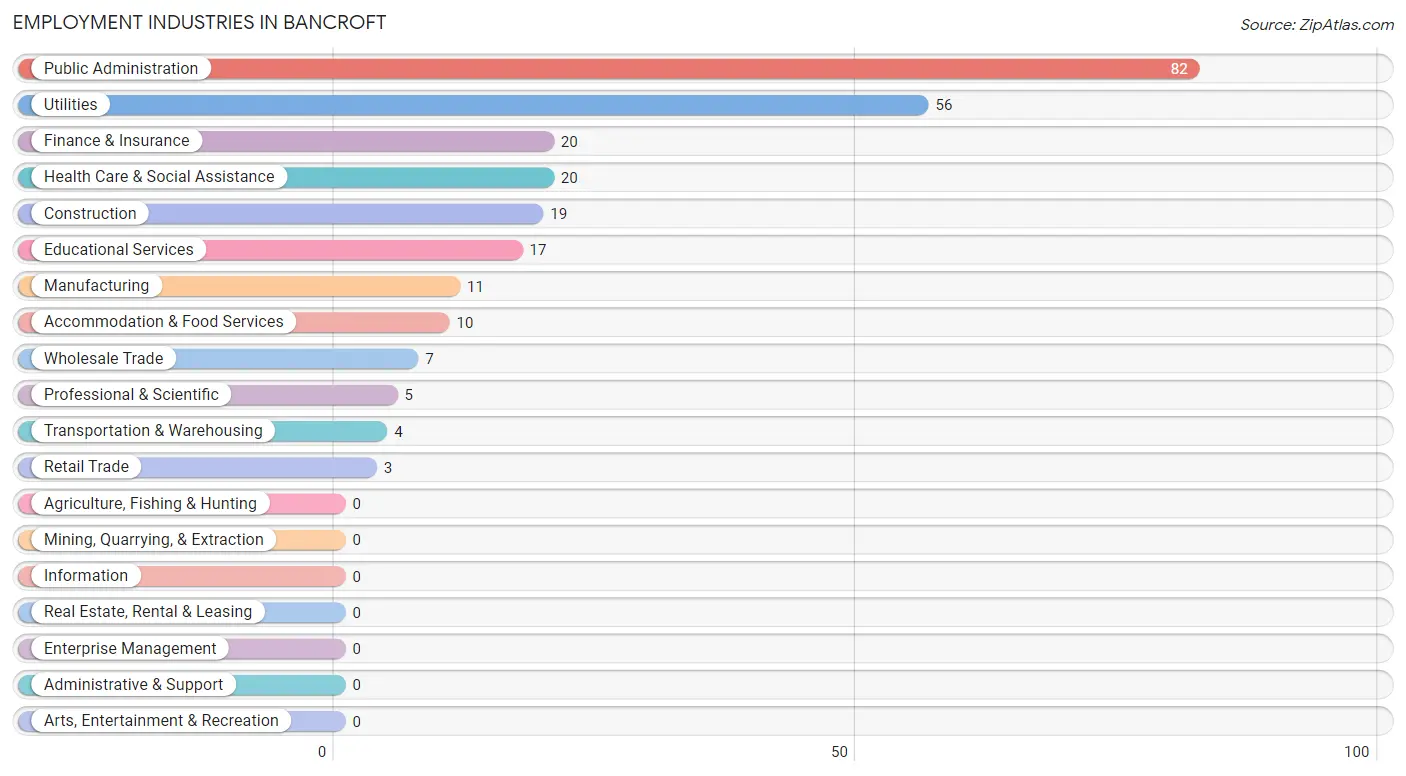
Employment Industries in Bancroft
The major employment industries in Bancroft include Public Administration (82 | 31.7%), Utilities (56 | 21.6%), Finance & Insurance (20 | 7.7%), Health Care & Social Assistance (20 | 7.7%), and Construction (19 | 7.3%).
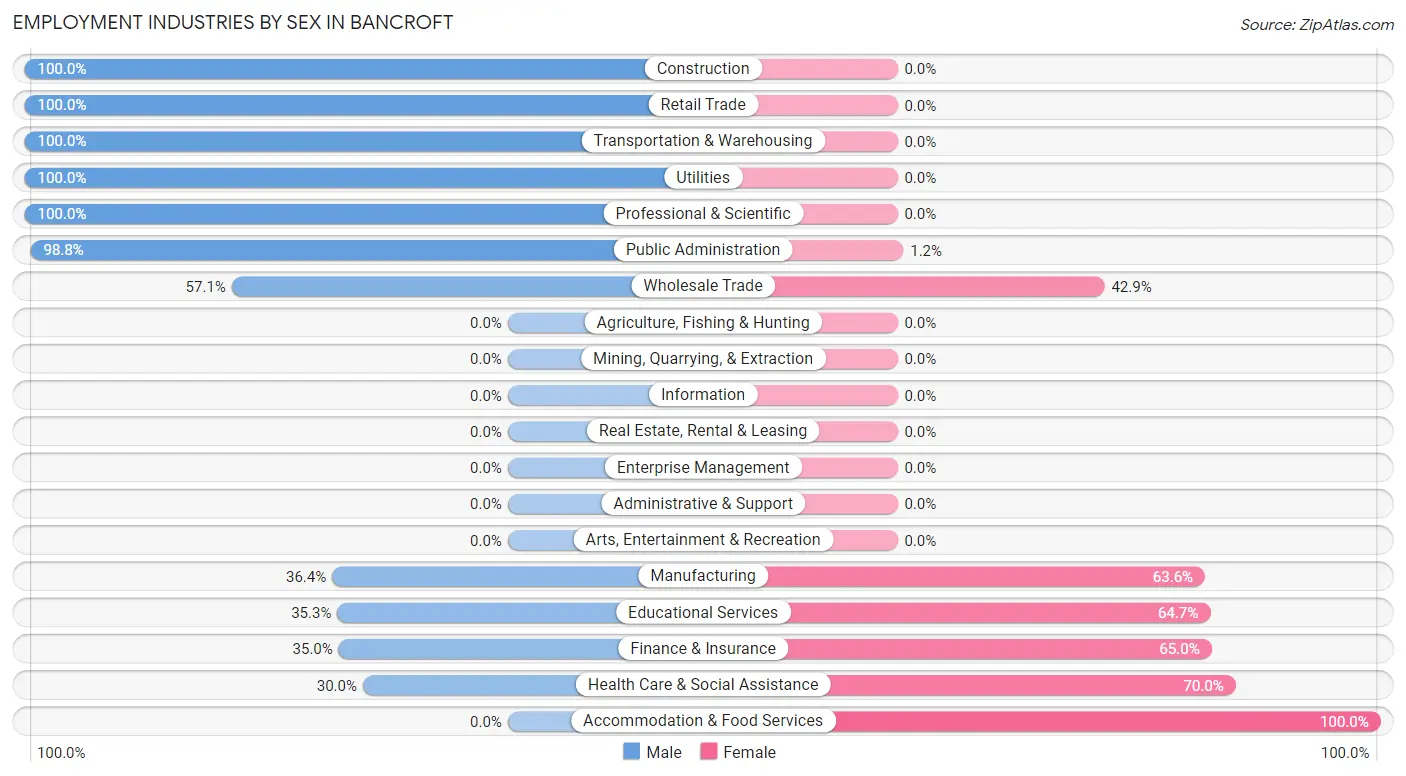
Employment Industries by Sex in Bancroft
The Bancroft industries that see more men than women are Construction (100.0%), Retail Trade (100.0%), and Transportation & Warehousing (100.0%), whereas the industries that tend to have a higher number of women are Accommodation & Food Services (100.0%), Health Care & Social Assistance (70.0%), and Finance & Insurance (65.0%).
| Industry | Male | Female |
| Agriculture, Fishing & Hunting | 0 (0.0%) | 0 (0.0%) |
| Mining, Quarrying, & Extraction | 0 (0.0%) | 0 (0.0%) |
| Construction | 19 (100.0%) | 0 (0.0%) |
| Manufacturing | 4 (36.4%) | 7 (63.6%) |
| Wholesale Trade | 4 (57.1%) | 3 (42.9%) |
| Retail Trade | 3 (100.0%) | 0 (0.0%) |
| Transportation & Warehousing | 4 (100.0%) | 0 (0.0%) |
| Utilities | 56 (100.0%) | 0 (0.0%) |
| Information | 0 (0.0%) | 0 (0.0%) |
| Finance & Insurance | 7 (35.0%) | 13 (65.0%) |
| Real Estate, Rental & Leasing | 0 (0.0%) | 0 (0.0%) |
| Professional & Scientific | 5 (100.0%) | 0 (0.0%) |
| Enterprise Management | 0 (0.0%) | 0 (0.0%) |
| Administrative & Support | 0 (0.0%) | 0 (0.0%) |
| Educational Services | 6 (35.3%) | 11 (64.7%) |
| Health Care & Social Assistance | 6 (30.0%) | 14 (70.0%) |
| Arts, Entertainment & Recreation | 0 (0.0%) | 0 (0.0%) |
| Accommodation & Food Services | 0 (0.0%) | 10 (100.0%) |
| Public Administration | 81 (98.8%) | 1 (1.2%) |
| Total | 200 (77.2%) | 59 (22.8%) |
Education in Bancroft
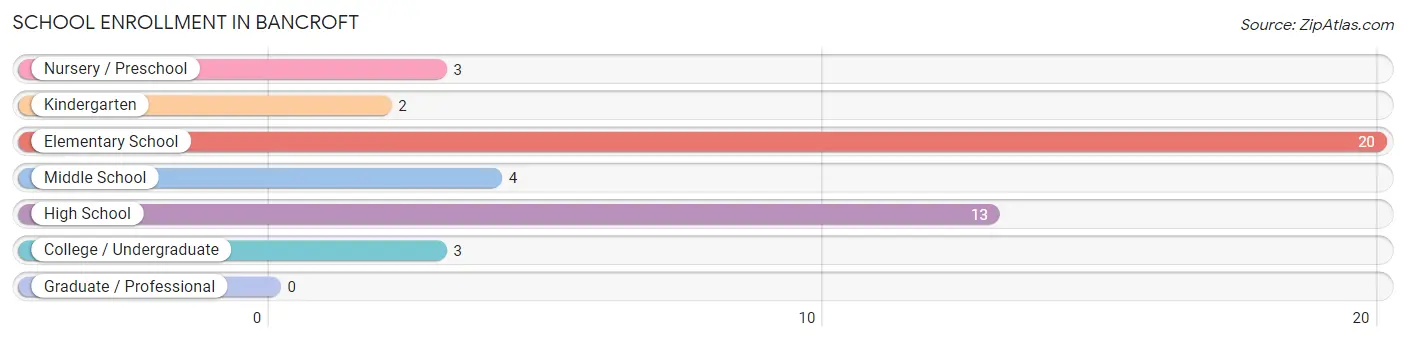
School Enrollment in Bancroft
The most common levels of schooling among the 45 students in Bancroft are elementary school (20 | 44.4%), high school (13 | 28.9%), and middle school (4 | 8.9%).
| School Level | # Students | % Students |
| Nursery / Preschool | 3 | 6.7% |
| Kindergarten | 2 | 4.4% |
| Elementary School | 20 | 44.4% |
| Middle School | 4 | 8.9% |
| High School | 13 | 28.9% |
| College / Undergraduate | 3 | 6.7% |
| Graduate / Professional | 0 | 0.0% |
| Total | 45 | 100.0% |
School Enrollment by Age by Funding Source in Bancroft
Out of a total of 45 students who are enrolled in schools in Bancroft, 8 (17.8%) attend a private institution, while the remaining 37 (82.2%) are enrolled in public schools. The age group of 25 to 34 year olds has the highest likelihood of being enrolled in private schools, with 3 (100.0% in the age bracket) enrolled. Conversely, the age group of 10 to 14 year olds has the lowest likelihood of being enrolled in a private school, with 5 (100.0% in the age bracket) attending a public institution.
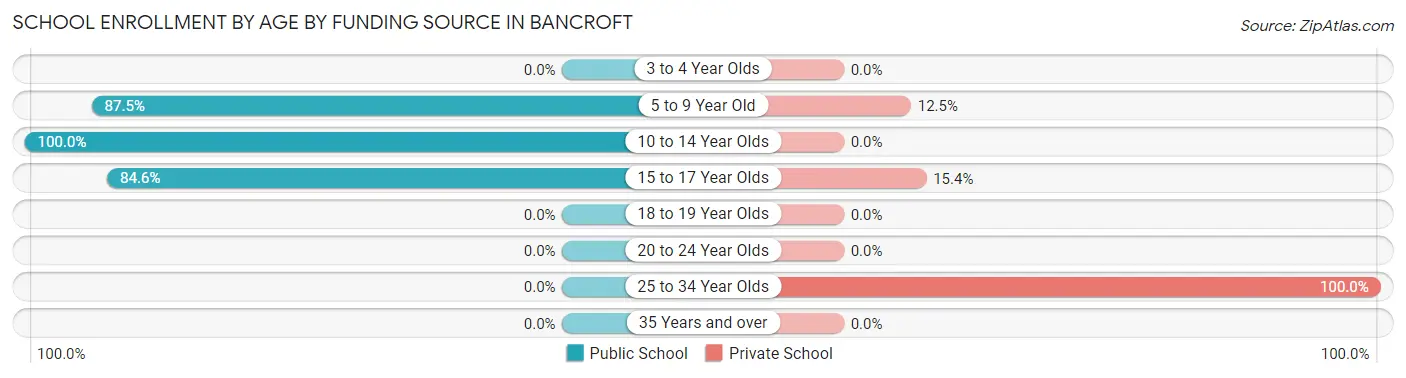
| Age Bracket | Public School | Private School |
| 3 to 4 Year Olds | 0 (0.0%) | 0 (0.0%) |
| 5 to 9 Year Old | 21 (87.5%) | 3 (12.5%) |
| 10 to 14 Year Olds | 5 (100.0%) | 0 (0.0%) |
| 15 to 17 Year Olds | 11 (84.6%) | 2 (15.4%) |
| 18 to 19 Year Olds | 0 (0.0%) | 0 (0.0%) |
| 20 to 24 Year Olds | 0 (0.0%) | 0 (0.0%) |
| 25 to 34 Year Olds | 0 (0.0%) | 3 (100.0%) |
| 35 Years and over | 0 (0.0%) | 0 (0.0%) |
| Total | 37 (82.2%) | 8 (17.8%) |
Educational Attainment by Field of Study in Bancroft
Education (10 | 66.7%), social sciences (2 | 13.3%), business (2 | 13.3%), and science & technology (1 | 6.7%) are the most common fields of study among 15 individuals in Bancroft who have obtained a bachelor's degree or higher.
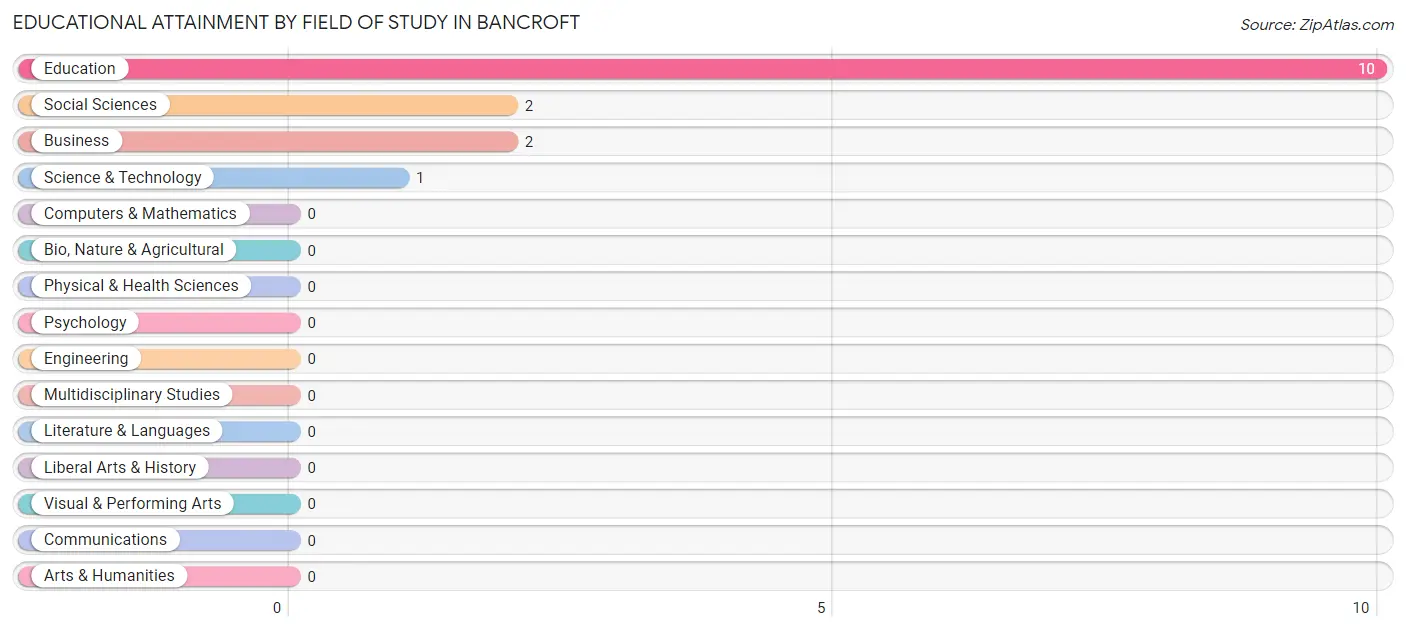
| Field of Study | # Graduates | % Graduates |
| Computers & Mathematics | 0 | 0.0% |
| Bio, Nature & Agricultural | 0 | 0.0% |
| Physical & Health Sciences | 0 | 0.0% |
| Psychology | 0 | 0.0% |
| Social Sciences | 2 | 13.3% |
| Engineering | 0 | 0.0% |
| Multidisciplinary Studies | 0 | 0.0% |
| Science & Technology | 1 | 6.7% |
| Business | 2 | 13.3% |
| Education | 10 | 66.7% |
| Literature & Languages | 0 | 0.0% |
| Liberal Arts & History | 0 | 0.0% |
| Visual & Performing Arts | 0 | 0.0% |
| Communications | 0 | 0.0% |
| Arts & Humanities | 0 | 0.0% |
| Total | 15 | 100.0% |
Transportation & Commute in Bancroft
Vehicle Availability by Sex in Bancroft
The most prevalent vehicle ownership categories in Bancroft are males with 2 vehicles (166, accounting for 84.7%) and females with 2 vehicles (15, making up 291.2%).
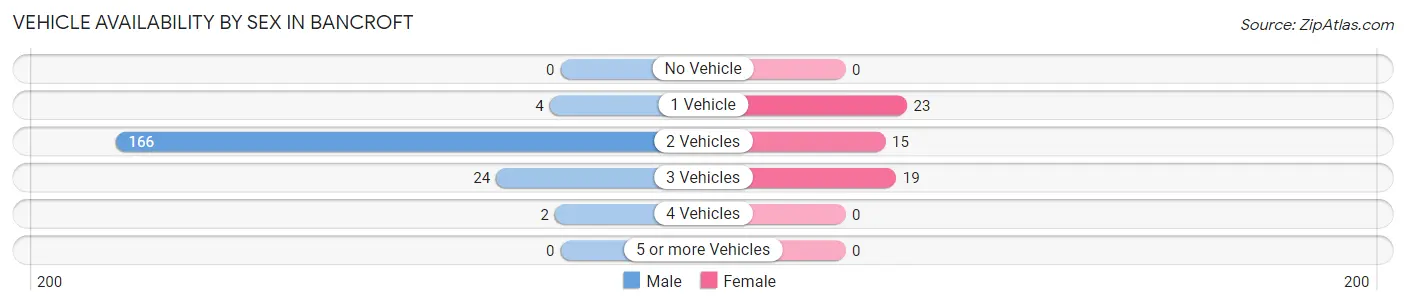
| Vehicles Available | Male | Female |
| No Vehicle | 0 (0.0%) | 0 (0.0%) |
| 1 Vehicle | 4 (2.0%) | 23 (40.4%) |
| 2 Vehicles | 166 (84.7%) | 15 (26.3%) |
| 3 Vehicles | 24 (12.2%) | 19 (33.3%) |
| 4 Vehicles | 2 (1.0%) | 0 (0.0%) |
| 5 or more Vehicles | 0 (0.0%) | 0 (0.0%) |
| Total | 196 (100.0%) | 57 (100.0%) |
Commute Time in Bancroft
The most frequently occuring commute durations in Bancroft are 30 to 34 minutes (109 commuters, 44.3%), 15 to 19 minutes (66 commuters, 26.8%), and 20 to 24 minutes (23 commuters, 9.3%).
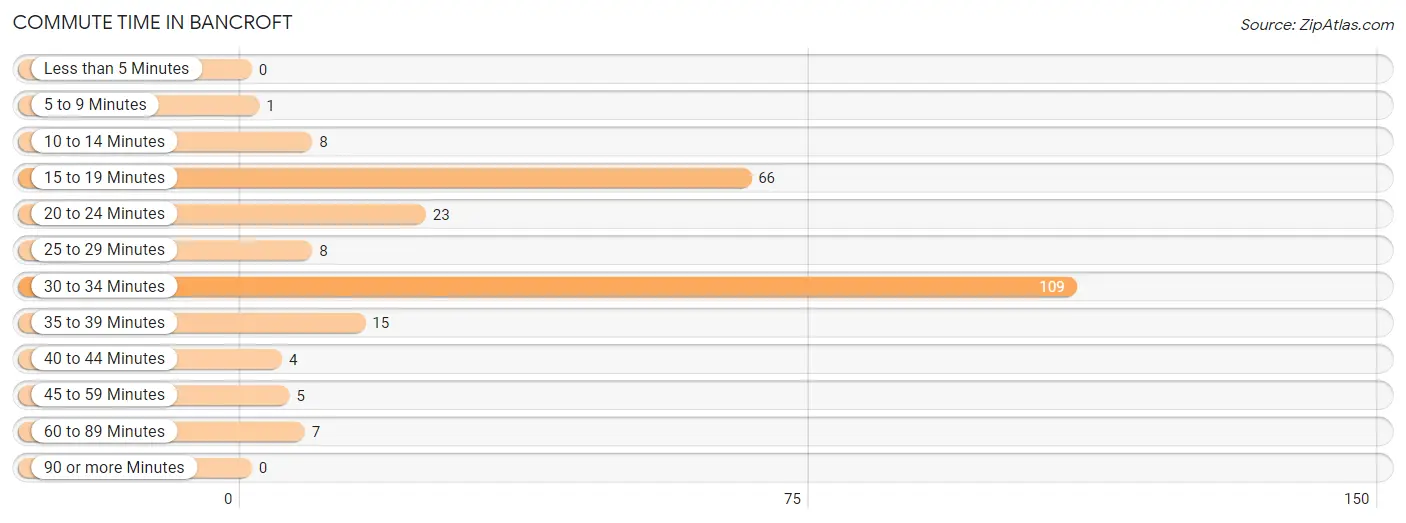
| Commute Time | # Commuters | % Commuters |
| Less than 5 Minutes | 0 | 0.0% |
| 5 to 9 Minutes | 1 | 0.4% |
| 10 to 14 Minutes | 8 | 3.3% |
| 15 to 19 Minutes | 66 | 26.8% |
| 20 to 24 Minutes | 23 | 9.3% |
| 25 to 29 Minutes | 8 | 3.3% |
| 30 to 34 Minutes | 109 | 44.3% |
| 35 to 39 Minutes | 15 | 6.1% |
| 40 to 44 Minutes | 4 | 1.6% |
| 45 to 59 Minutes | 5 | 2.0% |
| 60 to 89 Minutes | 7 | 2.9% |
| 90 or more Minutes | 0 | 0.0% |
Commute Time by Sex in Bancroft
The most common commute times in Bancroft are 30 to 34 minutes (87 commuters, 45.6%) for males and 30 to 34 minutes (22 commuters, 40.0%) for females.
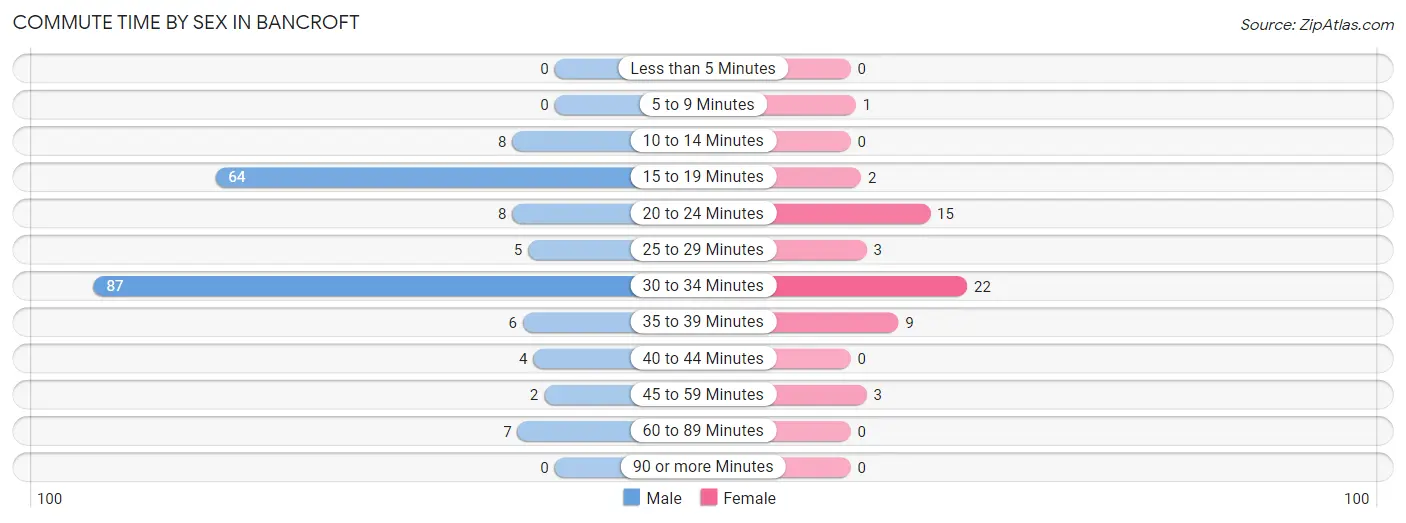
| Commute Time | Male | Female |
| Less than 5 Minutes | 0 (0.0%) | 0 (0.0%) |
| 5 to 9 Minutes | 0 (0.0%) | 1 (1.8%) |
| 10 to 14 Minutes | 8 (4.2%) | 0 (0.0%) |
| 15 to 19 Minutes | 64 (33.5%) | 2 (3.6%) |
| 20 to 24 Minutes | 8 (4.2%) | 15 (27.3%) |
| 25 to 29 Minutes | 5 (2.6%) | 3 (5.4%) |
| 30 to 34 Minutes | 87 (45.6%) | 22 (40.0%) |
| 35 to 39 Minutes | 6 (3.1%) | 9 (16.4%) |
| 40 to 44 Minutes | 4 (2.1%) | 0 (0.0%) |
| 45 to 59 Minutes | 2 (1.1%) | 3 (5.4%) |
| 60 to 89 Minutes | 7 (3.7%) | 0 (0.0%) |
| 90 or more Minutes | 0 (0.0%) | 0 (0.0%) |
Time of Departure to Work by Sex in Bancroft
The most frequent times of departure to work in Bancroft are 12:00 PM to 3:59 PM (92, 48.2%) for males and 7:00 AM to 7:29 AM (18, 32.7%) for females.
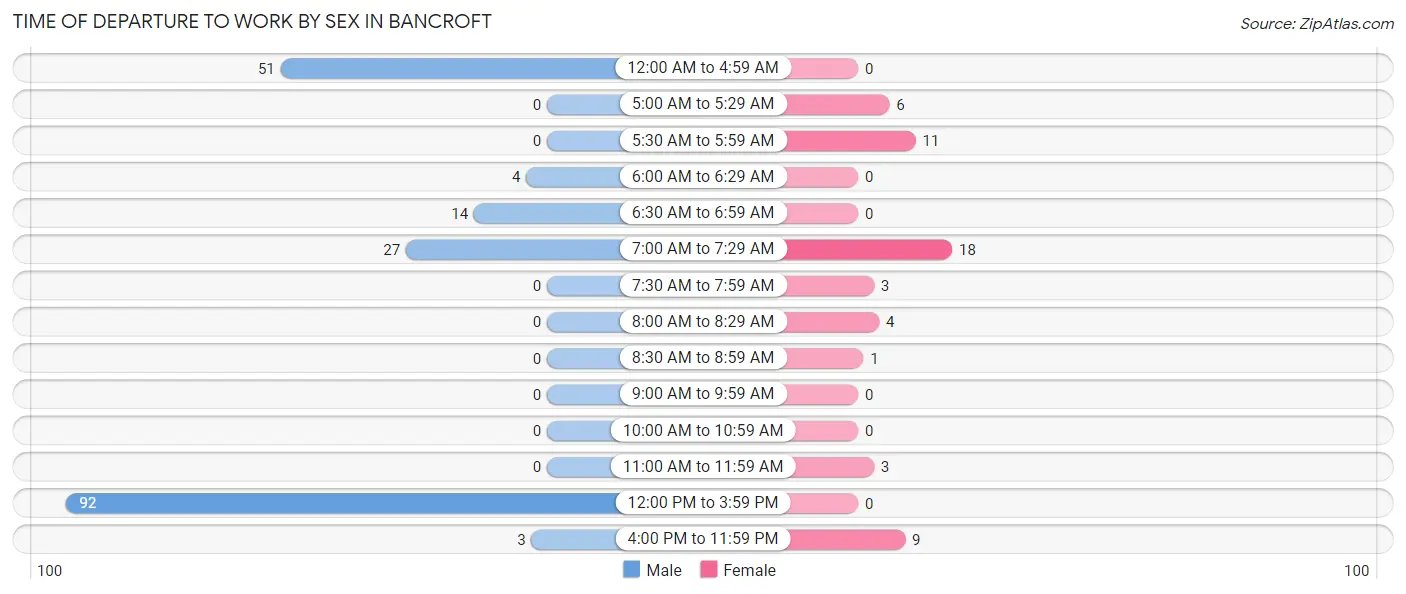
| Time of Departure | Male | Female |
| 12:00 AM to 4:59 AM | 51 (26.7%) | 0 (0.0%) |
| 5:00 AM to 5:29 AM | 0 (0.0%) | 6 (10.9%) |
| 5:30 AM to 5:59 AM | 0 (0.0%) | 11 (20.0%) |
| 6:00 AM to 6:29 AM | 4 (2.1%) | 0 (0.0%) |
| 6:30 AM to 6:59 AM | 14 (7.3%) | 0 (0.0%) |
| 7:00 AM to 7:29 AM | 27 (14.1%) | 18 (32.7%) |
| 7:30 AM to 7:59 AM | 0 (0.0%) | 3 (5.4%) |
| 8:00 AM to 8:29 AM | 0 (0.0%) | 4 (7.3%) |
| 8:30 AM to 8:59 AM | 0 (0.0%) | 1 (1.8%) |
| 9:00 AM to 9:59 AM | 0 (0.0%) | 0 (0.0%) |
| 10:00 AM to 10:59 AM | 0 (0.0%) | 0 (0.0%) |
| 11:00 AM to 11:59 AM | 0 (0.0%) | 3 (5.4%) |
| 12:00 PM to 3:59 PM | 92 (48.2%) | 0 (0.0%) |
| 4:00 PM to 11:59 PM | 3 (1.6%) | 9 (16.4%) |
| Total | 191 (100.0%) | 55 (100.0%) |
Housing Occupancy in Bancroft
Occupancy by Ownership in Bancroft
Of the total 195 dwellings in Bancroft, owner-occupied units account for 158 (81.0%), while renter-occupied units make up 37 (19.0%).
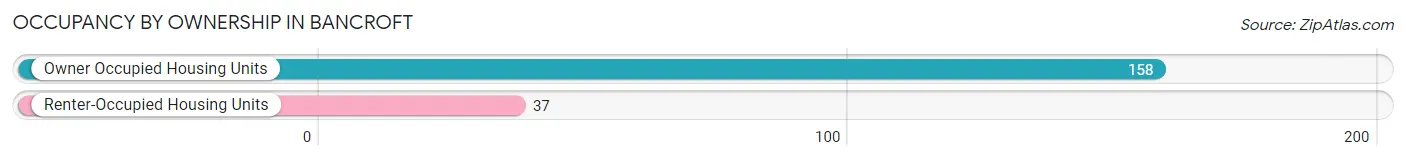
| Occupancy | # Housing Units | % Housing Units |
| Owner Occupied Housing Units | 158 | 81.0% |
| Renter-Occupied Housing Units | 37 | 19.0% |
| Total Occupied Housing Units | 195 | 100.0% |
Occupancy by Household Size in Bancroft
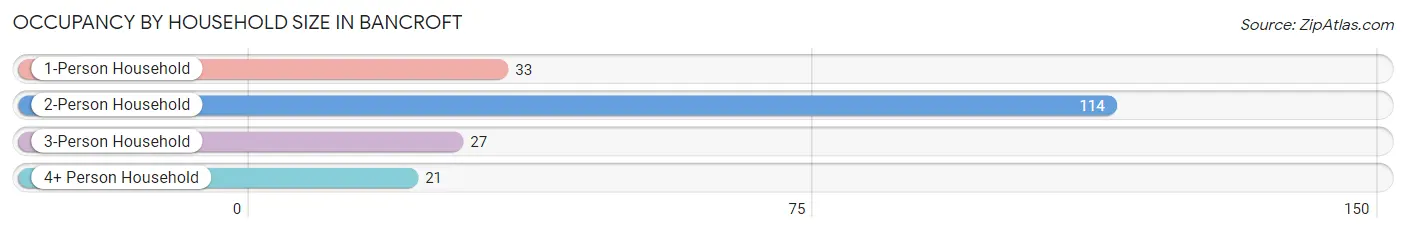
| Household Size | # Housing Units | % Housing Units |
| 1-Person Household | 33 | 16.9% |
| 2-Person Household | 114 | 58.5% |
| 3-Person Household | 27 | 13.9% |
| 4+ Person Household | 21 | 10.8% |
| Total Housing Units | 195 | 100.0% |
Occupancy by Ownership by Household Size in Bancroft
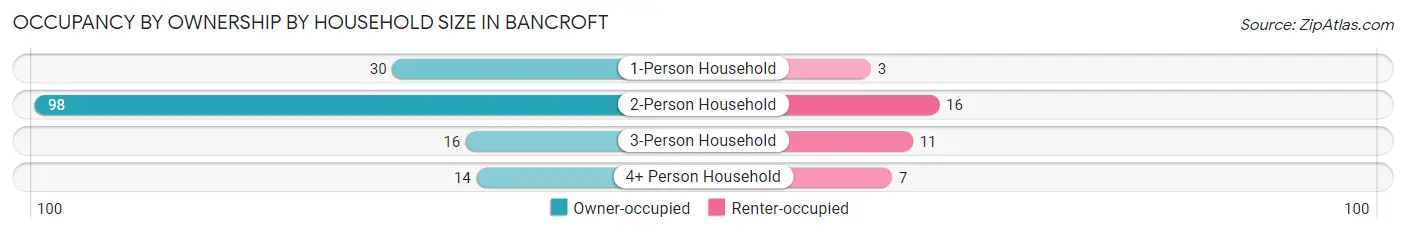
| Household Size | Owner-occupied | Renter-occupied |
| 1-Person Household | 30 (90.9%) | 3 (9.1%) |
| 2-Person Household | 98 (86.0%) | 16 (14.0%) |
| 3-Person Household | 16 (59.3%) | 11 (40.7%) |
| 4+ Person Household | 14 (66.7%) | 7 (33.3%) |
| Total Housing Units | 158 (81.0%) | 37 (19.0%) |
Occupancy by Educational Attainment in Bancroft
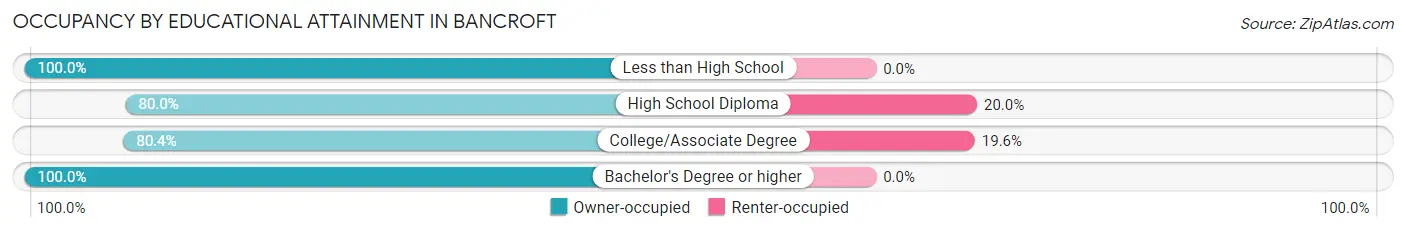
| Household Size | Owner-occupied | Renter-occupied |
| Less than High School | 1 (100.0%) | 0 (0.0%) |
| High School Diploma | 112 (80.0%) | 28 (20.0%) |
| College/Associate Degree | 37 (80.4%) | 9 (19.6%) |
| Bachelor's Degree or higher | 8 (100.0%) | 0 (0.0%) |
Occupancy by Age of Householder in Bancroft
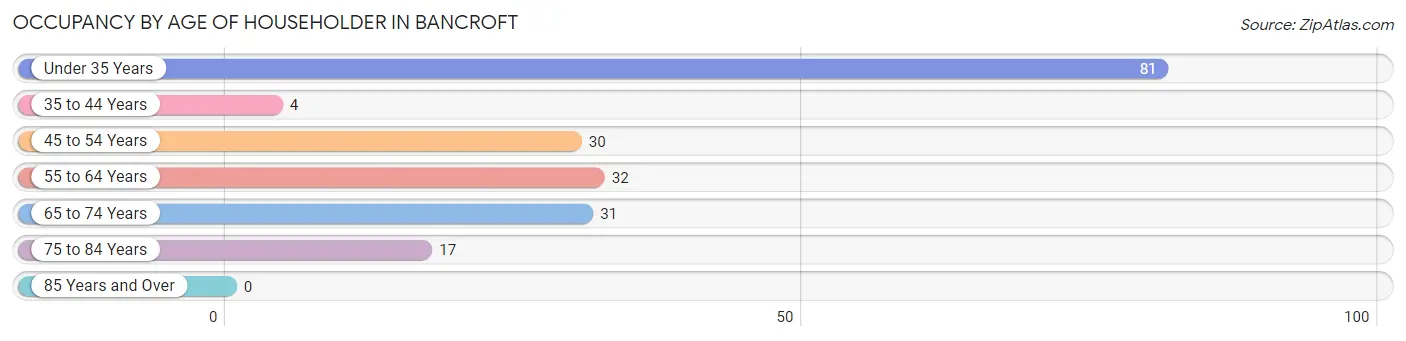
| Age Bracket | # Households | % Households |
| Under 35 Years | 81 | 41.5% |
| 35 to 44 Years | 4 | 2.1% |
| 45 to 54 Years | 30 | 15.4% |
| 55 to 64 Years | 32 | 16.4% |
| 65 to 74 Years | 31 | 15.9% |
| 75 to 84 Years | 17 | 8.7% |
| 85 Years and Over | 0 | 0.0% |
| Total | 195 | 100.0% |
Housing Finances in Bancroft
Median Income by Occupancy in Bancroft
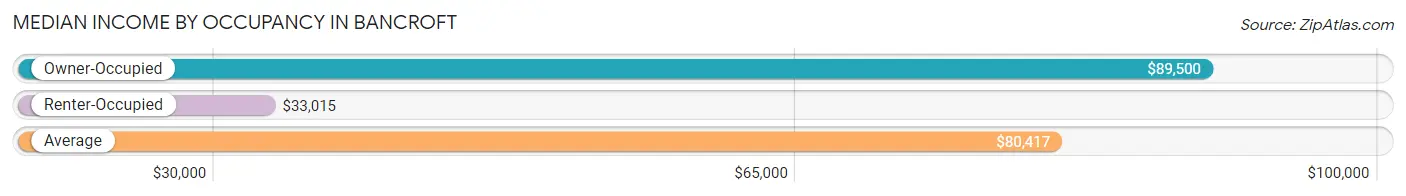
| Occupancy Type | # Households | Median Income |
| Owner-Occupied | 158 (81.0%) | $89,500 |
| Renter-Occupied | 37 (19.0%) | $33,015 |
| Average | 195 (100.0%) | $80,417 |
Occupancy by Householder Income Bracket in Bancroft
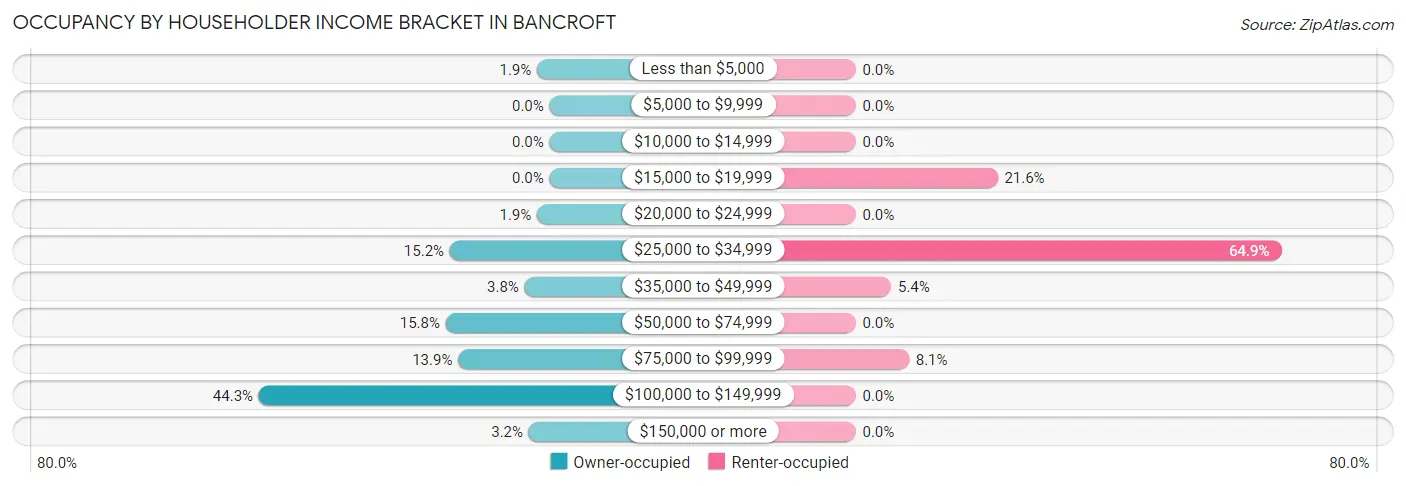
| Income Bracket | Owner-occupied | Renter-occupied |
| Less than $5,000 | 3 (1.9%) | 0 (0.0%) |
| $5,000 to $9,999 | 0 (0.0%) | 0 (0.0%) |
| $10,000 to $14,999 | 0 (0.0%) | 0 (0.0%) |
| $15,000 to $19,999 | 0 (0.0%) | 8 (21.6%) |
| $20,000 to $24,999 | 3 (1.9%) | 0 (0.0%) |
| $25,000 to $34,999 | 24 (15.2%) | 24 (64.9%) |
| $35,000 to $49,999 | 6 (3.8%) | 2 (5.4%) |
| $50,000 to $74,999 | 25 (15.8%) | 0 (0.0%) |
| $75,000 to $99,999 | 22 (13.9%) | 3 (8.1%) |
| $100,000 to $149,999 | 70 (44.3%) | 0 (0.0%) |
| $150,000 or more | 5 (3.2%) | 0 (0.0%) |
| Total | 158 (100.0%) | 37 (100.0%) |
Monthly Housing Cost Tiers in Bancroft
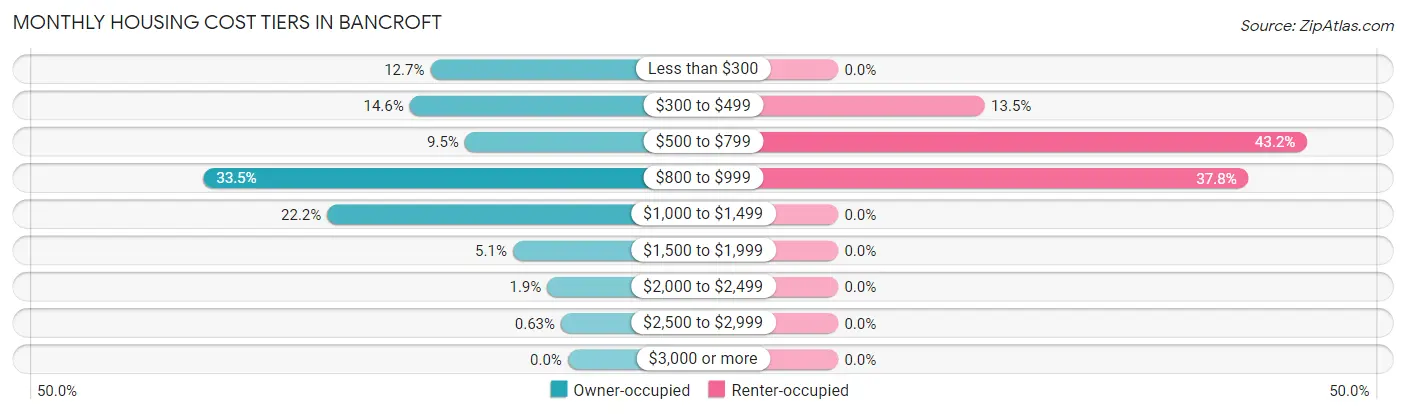
| Monthly Cost | Owner-occupied | Renter-occupied |
| Less than $300 | 20 (12.7%) | 0 (0.0%) |
| $300 to $499 | 23 (14.6%) | 5 (13.5%) |
| $500 to $799 | 15 (9.5%) | 16 (43.2%) |
| $800 to $999 | 53 (33.5%) | 14 (37.8%) |
| $1,000 to $1,499 | 35 (22.2%) | 0 (0.0%) |
| $1,500 to $1,999 | 8 (5.1%) | 0 (0.0%) |
| $2,000 to $2,499 | 3 (1.9%) | 0 (0.0%) |
| $2,500 to $2,999 | 1 (0.6%) | 0 (0.0%) |
| $3,000 or more | 0 (0.0%) | 0 (0.0%) |
| Total | 158 (100.0%) | 37 (100.0%) |
Physical Housing Characteristics in Bancroft
Housing Structures in Bancroft
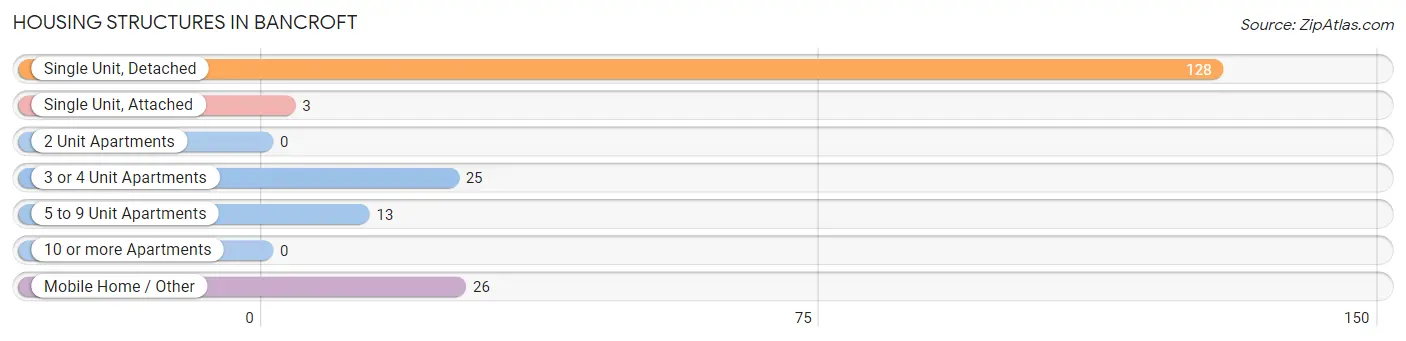
| Structure Type | # Housing Units | % Housing Units |
| Single Unit, Detached | 128 | 65.6% |
| Single Unit, Attached | 3 | 1.5% |
| 2 Unit Apartments | 0 | 0.0% |
| 3 or 4 Unit Apartments | 25 | 12.8% |
| 5 to 9 Unit Apartments | 13 | 6.7% |
| 10 or more Apartments | 0 | 0.0% |
| Mobile Home / Other | 26 | 13.3% |
| Total | 195 | 100.0% |
Housing Structures by Occupancy in Bancroft
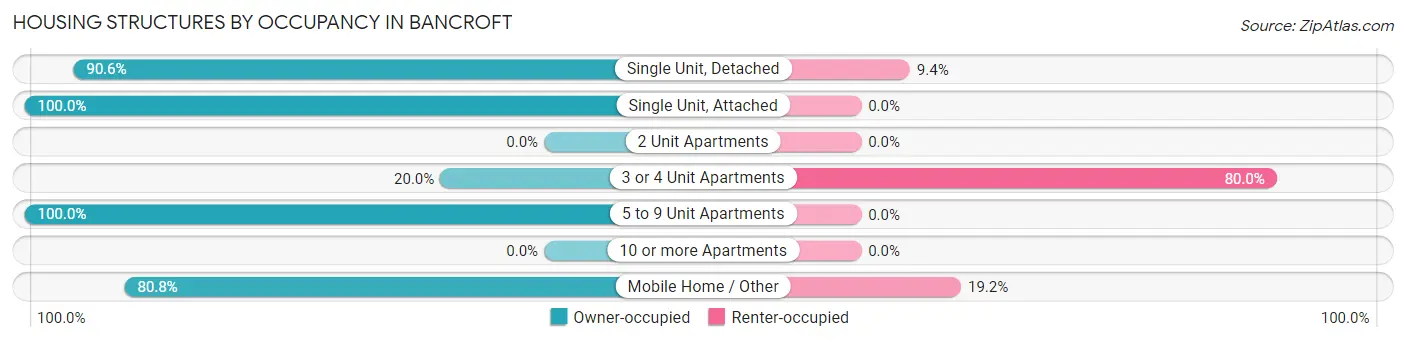
| Structure Type | Owner-occupied | Renter-occupied |
| Single Unit, Detached | 116 (90.6%) | 12 (9.4%) |
| Single Unit, Attached | 3 (100.0%) | 0 (0.0%) |
| 2 Unit Apartments | 0 (0.0%) | 0 (0.0%) |
| 3 or 4 Unit Apartments | 5 (20.0%) | 20 (80.0%) |
| 5 to 9 Unit Apartments | 13 (100.0%) | 0 (0.0%) |
| 10 or more Apartments | 0 (0.0%) | 0 (0.0%) |
| Mobile Home / Other | 21 (80.8%) | 5 (19.2%) |
| Total | 158 (81.0%) | 37 (19.0%) |
Housing Structures by Number of Rooms in Bancroft
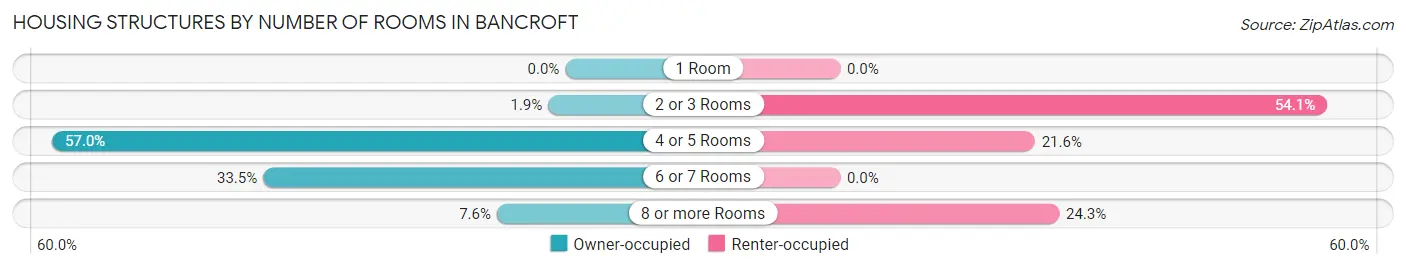
| Number of Rooms | Owner-occupied | Renter-occupied |
| 1 Room | 0 (0.0%) | 0 (0.0%) |
| 2 or 3 Rooms | 3 (1.9%) | 20 (54.0%) |
| 4 or 5 Rooms | 90 (57.0%) | 8 (21.6%) |
| 6 or 7 Rooms | 53 (33.5%) | 0 (0.0%) |
| 8 or more Rooms | 12 (7.6%) | 9 (24.3%) |
| Total | 158 (100.0%) | 37 (100.0%) |
Housing Structure by Heating Type in Bancroft
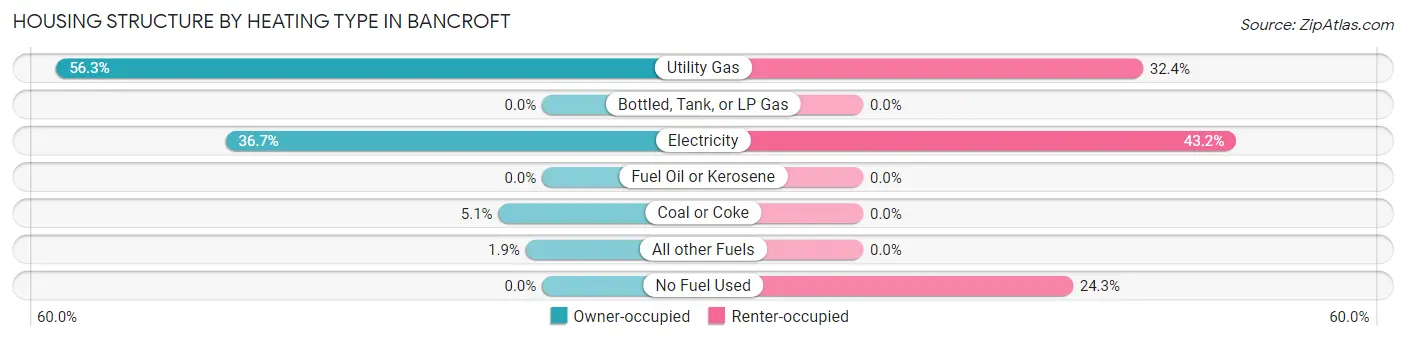
| Heating Type | Owner-occupied | Renter-occupied |
| Utility Gas | 89 (56.3%) | 12 (32.4%) |
| Bottled, Tank, or LP Gas | 0 (0.0%) | 0 (0.0%) |
| Electricity | 58 (36.7%) | 16 (43.2%) |
| Fuel Oil or Kerosene | 0 (0.0%) | 0 (0.0%) |
| Coal or Coke | 8 (5.1%) | 0 (0.0%) |
| All other Fuels | 3 (1.9%) | 0 (0.0%) |
| No Fuel Used | 0 (0.0%) | 9 (24.3%) |
| Total | 158 (100.0%) | 37 (100.0%) |
Household Vehicle Usage in Bancroft
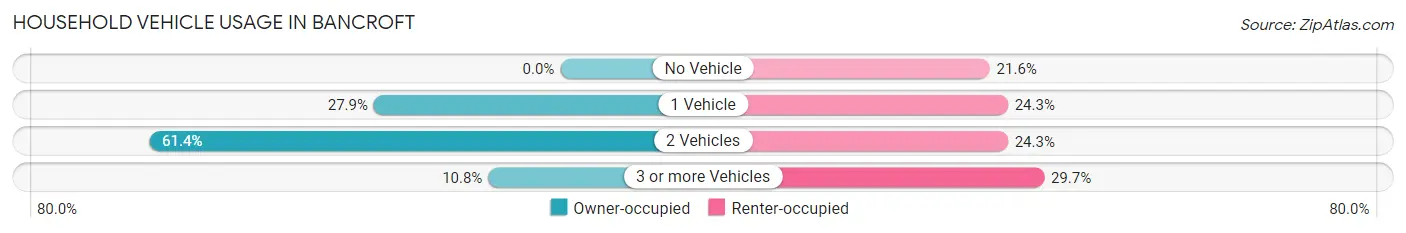
| Vehicles per Household | Owner-occupied | Renter-occupied |
| No Vehicle | 0 (0.0%) | 8 (21.6%) |
| 1 Vehicle | 44 (27.9%) | 9 (24.3%) |
| 2 Vehicles | 97 (61.4%) | 9 (24.3%) |
| 3 or more Vehicles | 17 (10.8%) | 11 (29.7%) |
| Total | 158 (100.0%) | 37 (100.0%) |
Real Estate & Mortgages in Bancroft
Real Estate and Mortgage Overview in Bancroft
| Characteristic | Without Mortgage | With Mortgage |
| Housing Units | 58 | 100 |
| Median Property Value | $103,600 | $88,500 |
| Median Household Income | $42,500 | $5 |
| Monthly Housing Costs | $370 | $0 |
| Real Estate Taxes | $520 | $0 |
Property Value by Mortgage Status in Bancroft
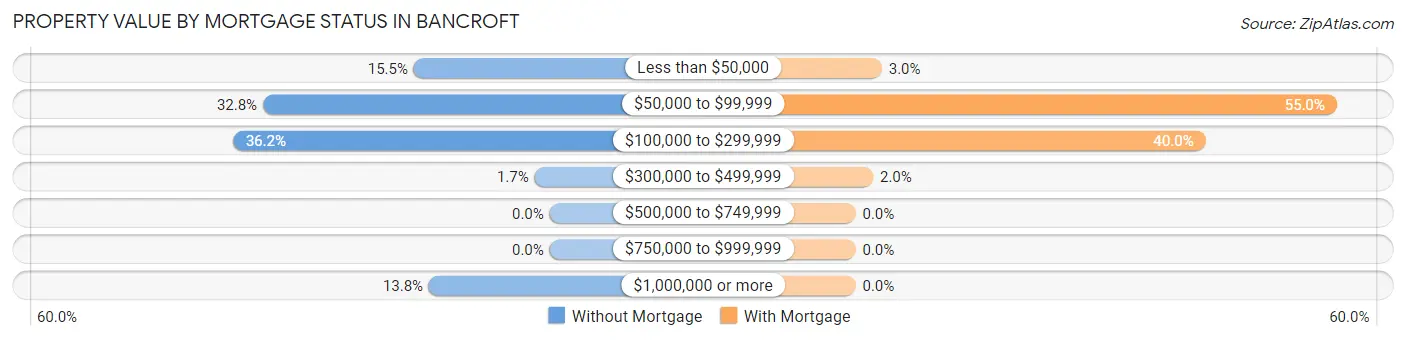
| Property Value | Without Mortgage | With Mortgage |
| Less than $50,000 | 9 (15.5%) | 3 (3.0%) |
| $50,000 to $99,999 | 19 (32.8%) | 55 (55.0%) |
| $100,000 to $299,999 | 21 (36.2%) | 40 (40.0%) |
| $300,000 to $499,999 | 1 (1.7%) | 2 (2.0%) |
| $500,000 to $749,999 | 0 (0.0%) | 0 (0.0%) |
| $750,000 to $999,999 | 0 (0.0%) | 0 (0.0%) |
| $1,000,000 or more | 8 (13.8%) | 0 (0.0%) |
| Total | 58 (100.0%) | 100 (100.0%) |
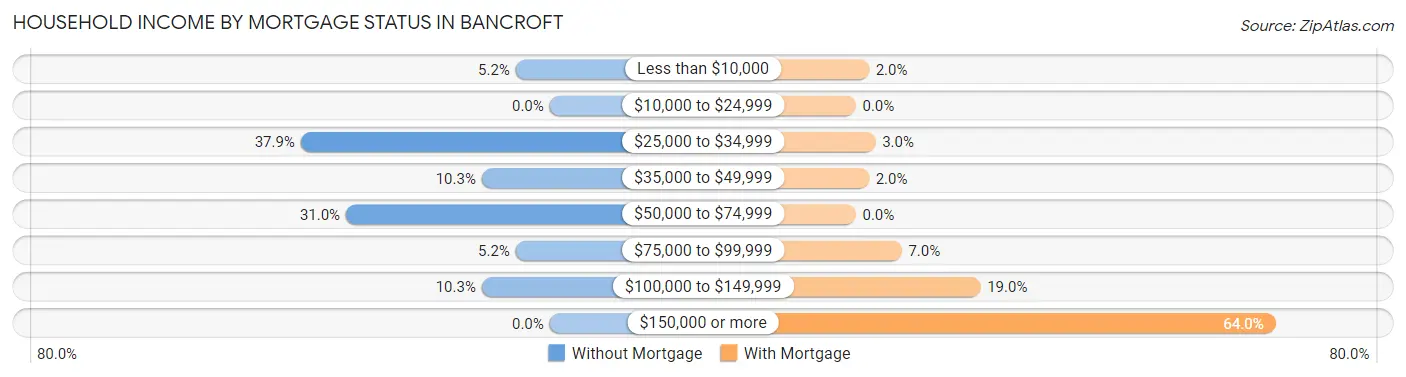
Household Income by Mortgage Status in Bancroft
| Household Income | Without Mortgage | With Mortgage |
| Less than $10,000 | 3 (5.2%) | 2 (2.0%) |
| $10,000 to $24,999 | 0 (0.0%) | 0 (0.0%) |
| $25,000 to $34,999 | 22 (37.9%) | 3 (3.0%) |
| $35,000 to $49,999 | 6 (10.3%) | 2 (2.0%) |
| $50,000 to $74,999 | 18 (31.0%) | 0 (0.0%) |
| $75,000 to $99,999 | 3 (5.2%) | 7 (7.0%) |
| $100,000 to $149,999 | 6 (10.3%) | 19 (19.0%) |
| $150,000 or more | 0 (0.0%) | 64 (64.0%) |
| Total | 58 (100.0%) | 100 (100.0%) |
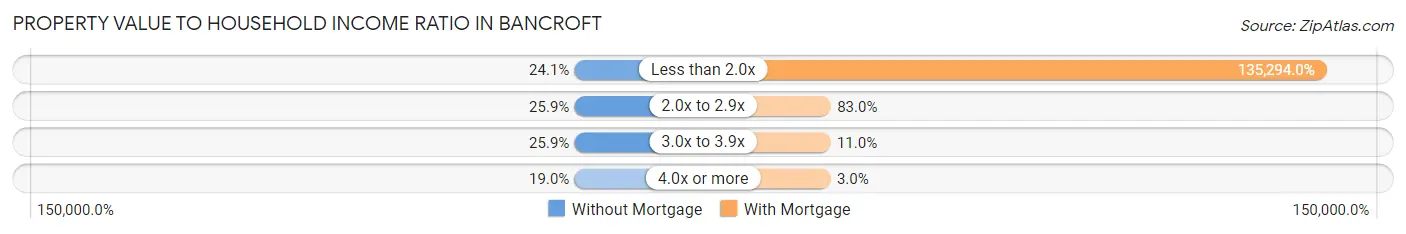
Property Value to Household Income Ratio in Bancroft
| Value-to-Income Ratio | Without Mortgage | With Mortgage |
| Less than 2.0x | 14 (24.1%) | 135,294 (135,294.0%) |
| 2.0x to 2.9x | 15 (25.9%) | 83 (83.0%) |
| 3.0x to 3.9x | 15 (25.9%) | 11 (11.0%) |
| 4.0x or more | 11 (19.0%) | 3 (3.0%) |
| Total | 58 (100.0%) | 100 (100.0%) |
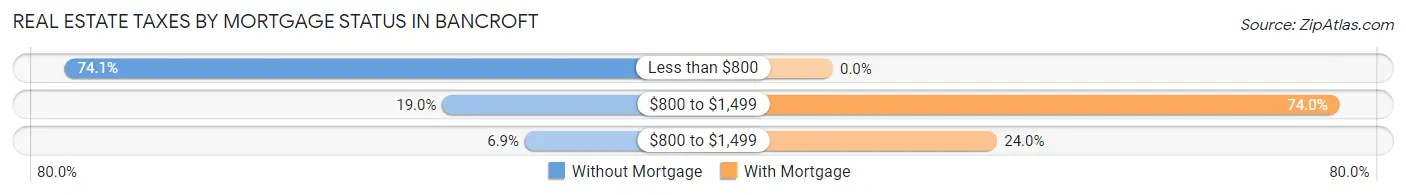
Real Estate Taxes by Mortgage Status in Bancroft
| Property Taxes | Without Mortgage | With Mortgage |
| Less than $800 | 43 (74.1%) | 0 (0.0%) |
| $800 to $1,499 | 11 (19.0%) | 74 (74.0%) |
| $800 to $1,499 | 4 (6.9%) | 24 (24.0%) |
| Total | 58 (100.0%) | 100 (100.0%) |
Health & Disability in Bancroft
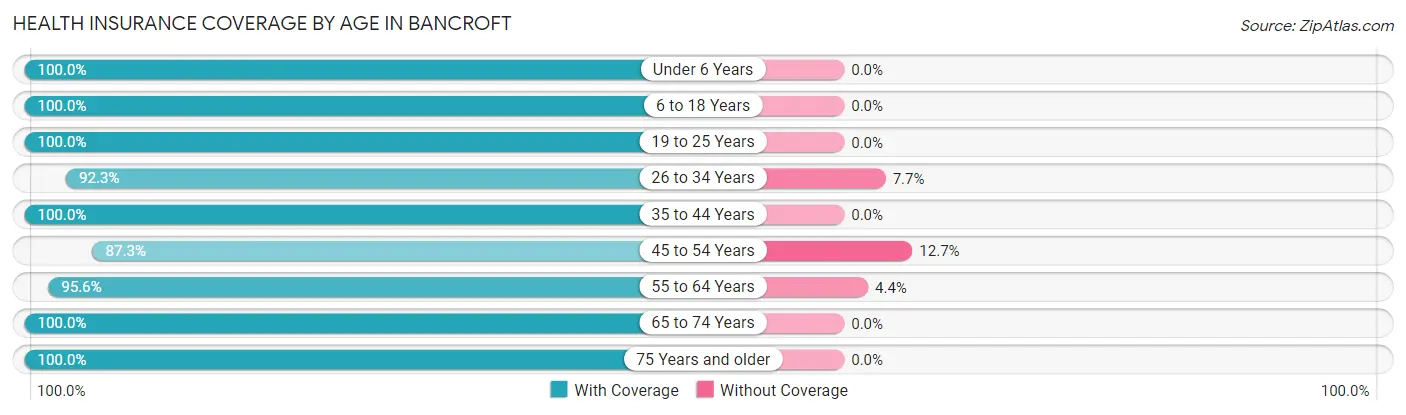
Health Insurance Coverage by Age in Bancroft
| Age Bracket | With Coverage | Without Coverage |
| Under 6 Years | 17 (100.0%) | 0 (0.0%) |
| 6 to 18 Years | 39 (100.0%) | 0 (0.0%) |
| 19 to 25 Years | 12 (100.0%) | 0 (0.0%) |
| 26 to 34 Years | 179 (92.3%) | 15 (7.7%) |
| 35 to 44 Years | 11 (100.0%) | 0 (0.0%) |
| 45 to 54 Years | 55 (87.3%) | 8 (12.7%) |
| 55 to 64 Years | 43 (95.6%) | 2 (4.4%) |
| 65 to 74 Years | 65 (100.0%) | 0 (0.0%) |
| 75 Years and older | 20 (100.0%) | 0 (0.0%) |
| Total | 441 (94.6%) | 25 (5.4%) |
Health Insurance Coverage by Citizenship Status in Bancroft
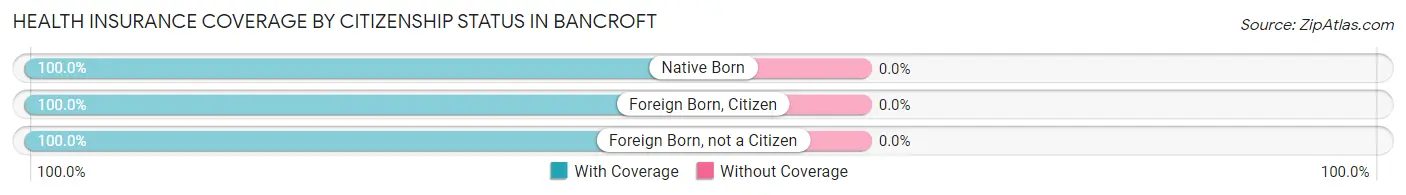
| Citizenship Status | With Coverage | Without Coverage |
| Native Born | 17 (100.0%) | 0 (0.0%) |
| Foreign Born, Citizen | 39 (100.0%) | 0 (0.0%) |
| Foreign Born, not a Citizen | 12 (100.0%) | 0 (0.0%) |
Health Insurance Coverage by Household Income in Bancroft
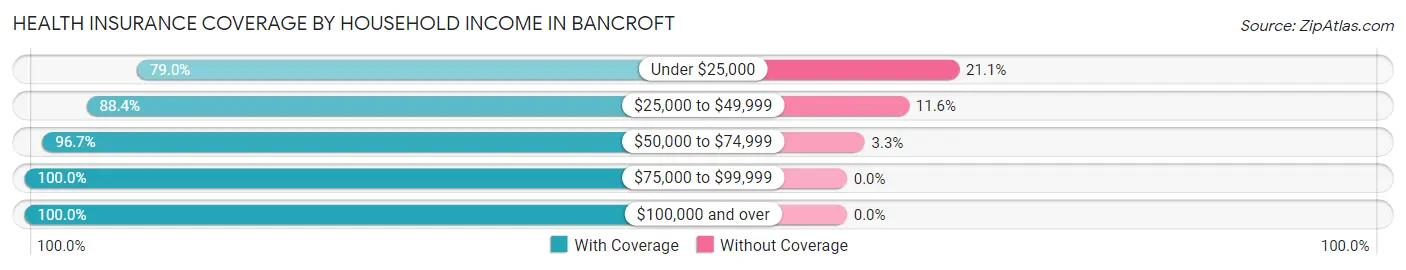
| Household Income | With Coverage | Without Coverage |
| Under $25,000 | 30 (78.9%) | 8 (21.0%) |
| $25,000 to $49,999 | 114 (88.4%) | 15 (11.6%) |
| $50,000 to $74,999 | 58 (96.7%) | 2 (3.3%) |
| $75,000 to $99,999 | 52 (100.0%) | 0 (0.0%) |
| $100,000 and over | 187 (100.0%) | 0 (0.0%) |
Public vs Private Health Insurance Coverage by Age in Bancroft
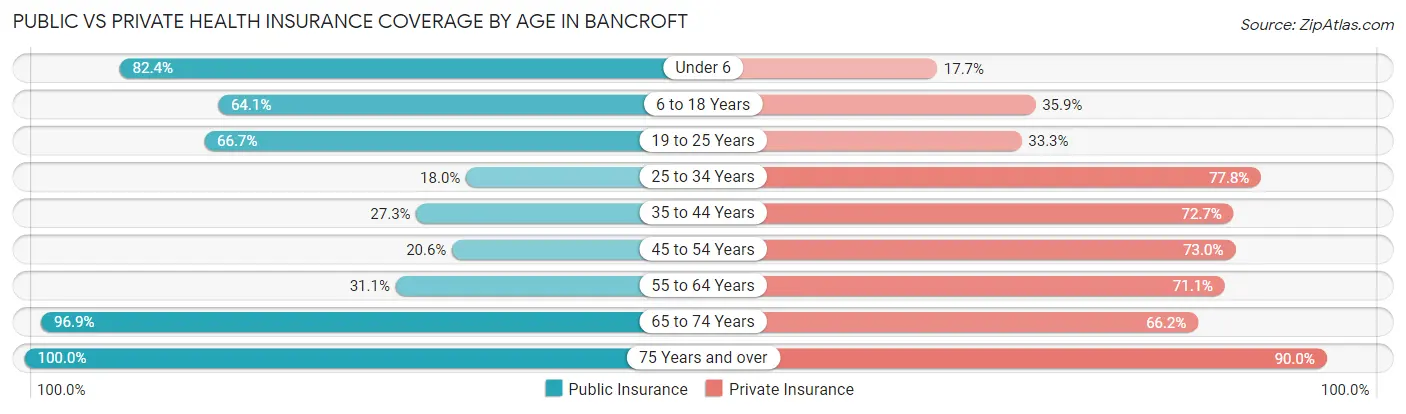
| Age Bracket | Public Insurance | Private Insurance |
| Under 6 | 14 (82.4%) | 3 (17.6%) |
| 6 to 18 Years | 25 (64.1%) | 14 (35.9%) |
| 19 to 25 Years | 8 (66.7%) | 4 (33.3%) |
| 25 to 34 Years | 35 (18.0%) | 151 (77.8%) |
| 35 to 44 Years | 3 (27.3%) | 8 (72.7%) |
| 45 to 54 Years | 13 (20.6%) | 46 (73.0%) |
| 55 to 64 Years | 14 (31.1%) | 32 (71.1%) |
| 65 to 74 Years | 63 (96.9%) | 43 (66.1%) |
| 75 Years and over | 20 (100.0%) | 18 (90.0%) |
| Total | 195 (41.8%) | 319 (68.4%) |
Disability Status by Sex by Age in Bancroft
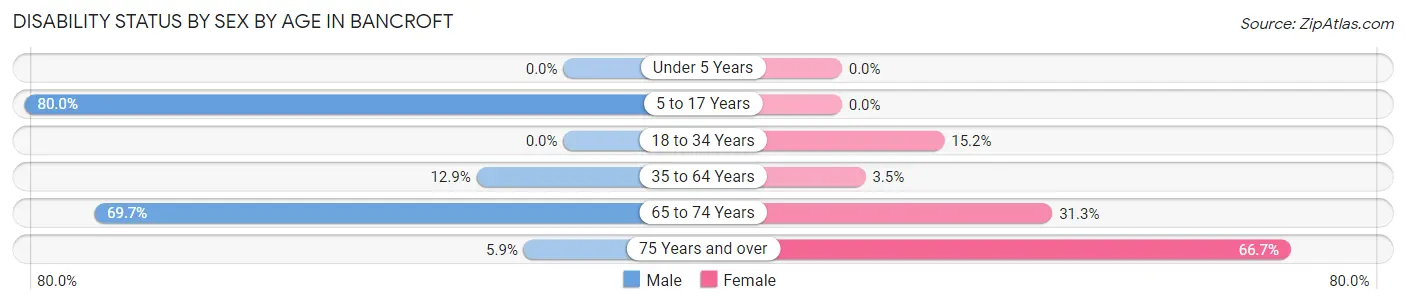
| Age Bracket | Male | Female |
| Under 5 Years | 0 (0.0%) | 0 (0.0%) |
| 5 to 17 Years | 8 (80.0%) | 0 (0.0%) |
| 18 to 34 Years | 0 (0.0%) | 7 (15.2%) |
| 35 to 64 Years | 8 (12.9%) | 2 (3.5%) |
| 65 to 74 Years | 23 (69.7%) | 10 (31.2%) |
| 75 Years and over | 1 (5.9%) | 2 (66.7%) |
Disability Class by Sex by Age in Bancroft
Disability Class: Hearing Difficulty
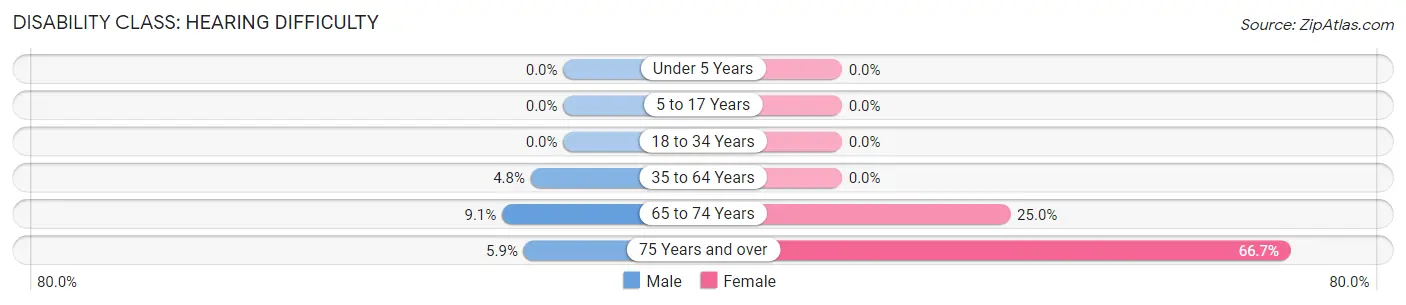
| Age Bracket | Male | Female |
| Under 5 Years | 0 (0.0%) | 0 (0.0%) |
| 5 to 17 Years | 0 (0.0%) | 0 (0.0%) |
| 18 to 34 Years | 0 (0.0%) | 0 (0.0%) |
| 35 to 64 Years | 3 (4.8%) | 0 (0.0%) |
| 65 to 74 Years | 3 (9.1%) | 8 (25.0%) |
| 75 Years and over | 1 (5.9%) | 2 (66.7%) |
Disability Class: Vision Difficulty
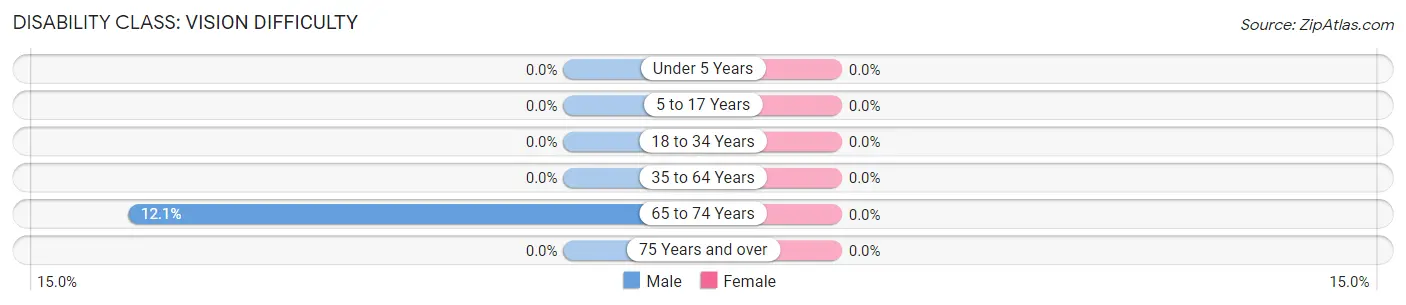
| Age Bracket | Male | Female |
| Under 5 Years | 0 (0.0%) | 0 (0.0%) |
| 5 to 17 Years | 0 (0.0%) | 0 (0.0%) |
| 18 to 34 Years | 0 (0.0%) | 0 (0.0%) |
| 35 to 64 Years | 0 (0.0%) | 0 (0.0%) |
| 65 to 74 Years | 4 (12.1%) | 0 (0.0%) |
| 75 Years and over | 0 (0.0%) | 0 (0.0%) |
Disability Class: Cognitive Difficulty
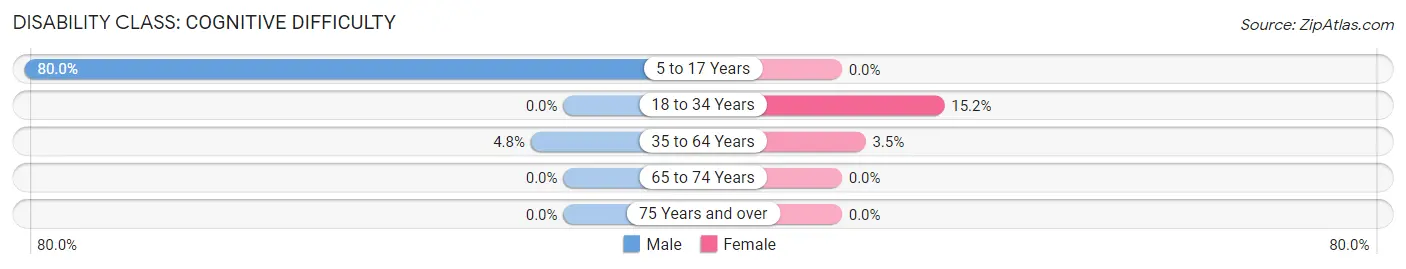
| Age Bracket | Male | Female |
| 5 to 17 Years | 8 (80.0%) | 0 (0.0%) |
| 18 to 34 Years | 0 (0.0%) | 7 (15.2%) |
| 35 to 64 Years | 3 (4.8%) | 2 (3.5%) |
| 65 to 74 Years | 0 (0.0%) | 0 (0.0%) |
| 75 Years and over | 0 (0.0%) | 0 (0.0%) |
Disability Class: Ambulatory Difficulty
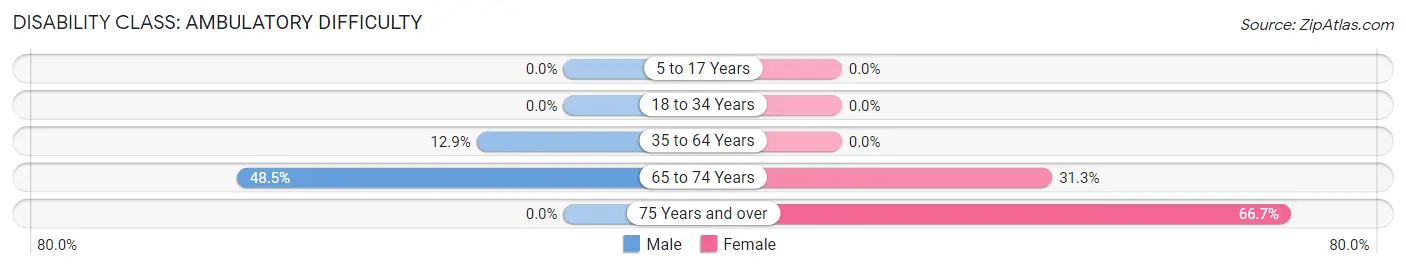
| Age Bracket | Male | Female |
| 5 to 17 Years | 0 (0.0%) | 0 (0.0%) |
| 18 to 34 Years | 0 (0.0%) | 0 (0.0%) |
| 35 to 64 Years | 8 (12.9%) | 0 (0.0%) |
| 65 to 74 Years | 16 (48.5%) | 10 (31.2%) |
| 75 Years and over | 0 (0.0%) | 2 (66.7%) |
Disability Class: Self-Care Difficulty
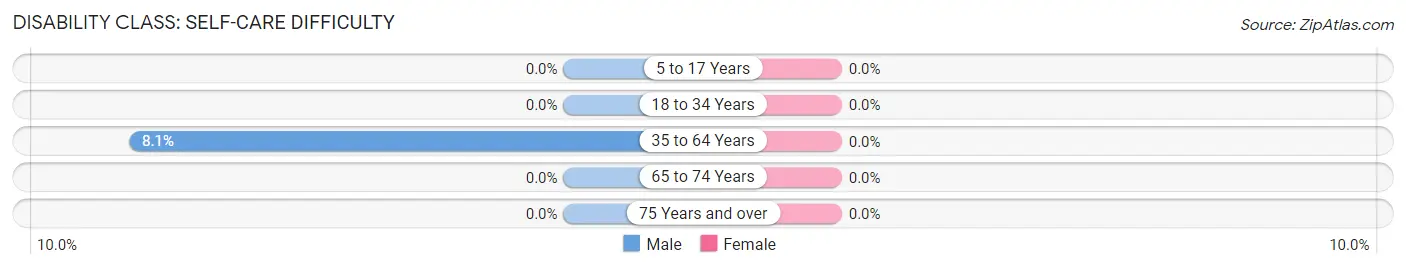
| Age Bracket | Male | Female |
| 5 to 17 Years | 0 (0.0%) | 0 (0.0%) |
| 18 to 34 Years | 0 (0.0%) | 0 (0.0%) |
| 35 to 64 Years | 5 (8.1%) | 0 (0.0%) |
| 65 to 74 Years | 0 (0.0%) | 0 (0.0%) |
| 75 Years and over | 0 (0.0%) | 0 (0.0%) |
Technology Access in Bancroft
Computing Device Access in Bancroft
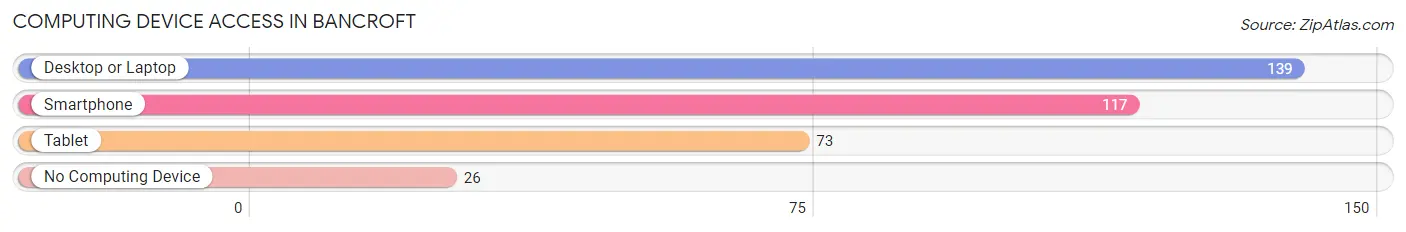
| Device Type | # Households | % Households |
| Desktop or Laptop | 139 | 71.3% |
| Smartphone | 117 | 60.0% |
| Tablet | 73 | 37.4% |
| No Computing Device | 26 | 13.3% |
| Total | 195 | 100.0% |
Internet Access in Bancroft
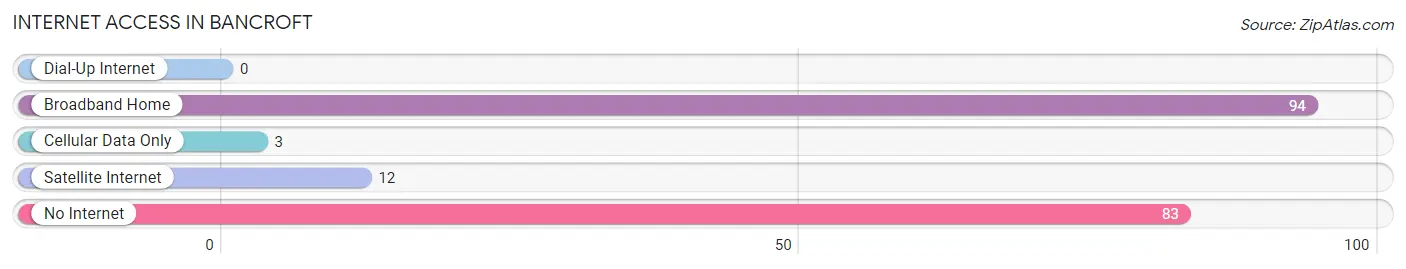
| Internet Type | # Households | % Households |
| Dial-Up Internet | 0 | 0.0% |
| Broadband Home | 94 | 48.2% |
| Cellular Data Only | 3 | 1.5% |
| Satellite Internet | 12 | 6.1% |
| No Internet | 83 | 42.6% |
| Total | 195 | 100.0% |
Bancroft Summary
Bancroft is a small unincorporated community located in the eastern panhandle of West Virginia, in Berkeley County. It is situated along the Potomac River, just south of the Maryland border. The community is home to a population of approximately 1,000 people, and is known for its rural charm and small-town atmosphere.
History
The area that is now Bancroft was first settled in the late 1700s by German immigrants. The town was originally known as “Bancroft’s Crossroads”, named after the Bancroft family who owned the land. The town was officially incorporated in 1891, and the name was changed to Bancroft.
In the early 1900s, Bancroft was a thriving agricultural community, with many farms and orchards. The town was also home to several small businesses, including a general store, a blacksmith shop, and a grist mill.
In the 1950s, the town began to decline as many of its residents moved away in search of better economic opportunities. The town’s population decreased from 1,500 in 1950 to just over 1,000 in 2000.
Geography
Bancroft is located in the eastern panhandle of West Virginia, in Berkeley County. It is situated along the Potomac River, just south of the Maryland border. The town is surrounded by rolling hills and farmland, and is located approximately 25 miles from the state capital of Charleston.
The climate in Bancroft is humid subtropical, with hot, humid summers and mild winters. The average annual temperature is around 55 degrees Fahrenheit, and the average annual precipitation is around 40 inches.
Economy
The economy of Bancroft is largely based on agriculture and tourism. The town is home to several small farms, which produce a variety of crops, including corn, soybeans, and hay. The town is also home to several small businesses, including a general store, a gas station, and a restaurant.
The town is also a popular tourist destination, due to its rural charm and proximity to the Potomac River. The town is home to several bed and breakfasts, as well as a number of outdoor recreation opportunities, including fishing, hunting, and hiking.
Demographics
As of the 2010 census, the population of Bancroft was 1,072. The racial makeup of the town was 95.3% White, 1.7% African American, 0.3% Native American, 0.2% Asian, 0.1% Pacific Islander, and 2.4% from other races. The median household income was $41,250, and the median family income was $50,000. The per capita income was $20,845.
Bancroft is a small, rural community with a strong sense of community and a rich history. The town is home to a diverse population, and is a popular tourist destination due to its rural charm and proximity to the Potomac River. The town’s economy is largely based on agriculture and tourism, and the town is home to several small businesses and farms.
Common Questions
What is the Total Population of Bancroft?
Total Population of Bancroft is 466.
What is the Total Male Population of Bancroft?
Total Male Population of Bancroft is 282.
What is the Total Female Population of Bancroft?
Total Female Population of Bancroft is 184.
What is the Ratio of Males per 100 Females in Bancroft?
There are 153.26 Males per 100 Females in Bancroft.
What is the Ratio of Females per 100 Males in Bancroft?
There are 65.25 Females per 100 Males in Bancroft.
What is the Median Population Age in Bancroft?
Median Population Age in Bancroft is 29.8 Years.
What is the Average Family Size in Bancroft
Average Family Size in Bancroft is 2.7 People.
What is the Average Household Size in Bancroft
Average Household Size in Bancroft is 2.4 People.
What is Per Capita Income in Bancroft?
Per Capita income in Bancroft is $38,877.
What is the Median Household income in Bancroft?
Median Household Income in Bancroft is $80,417.
What is Income or Wage Gap in Bancroft?
Income or Wage Gap in Bancroft is 51.5%.
Women in Bancroft earn 48.5 cents for every dollar earned by a man.
What is Inequality or Gini Index in Bancroft?
Inequality or Gini Index in Bancroft is 0.32.
How Large is the Labor Force in Bancroft?
There are 260 People in the Labor Forcein in Bancroft.
What is the Percentage of People in the Labor Force in Bancroft?
61.9% of People are in the Labor Force in Bancroft.
What is the Unemployment Rate in Bancroft?
Unemployment Rate in Bancroft is 0.4%.