Zip Codes with the Highest Percentage of Population Employed in Computer, Engineering & Science in Houston, TX
RELATED REPORTS & OPTIONS
Computer, Engineering & Science
Houston
Compare Zip Codes
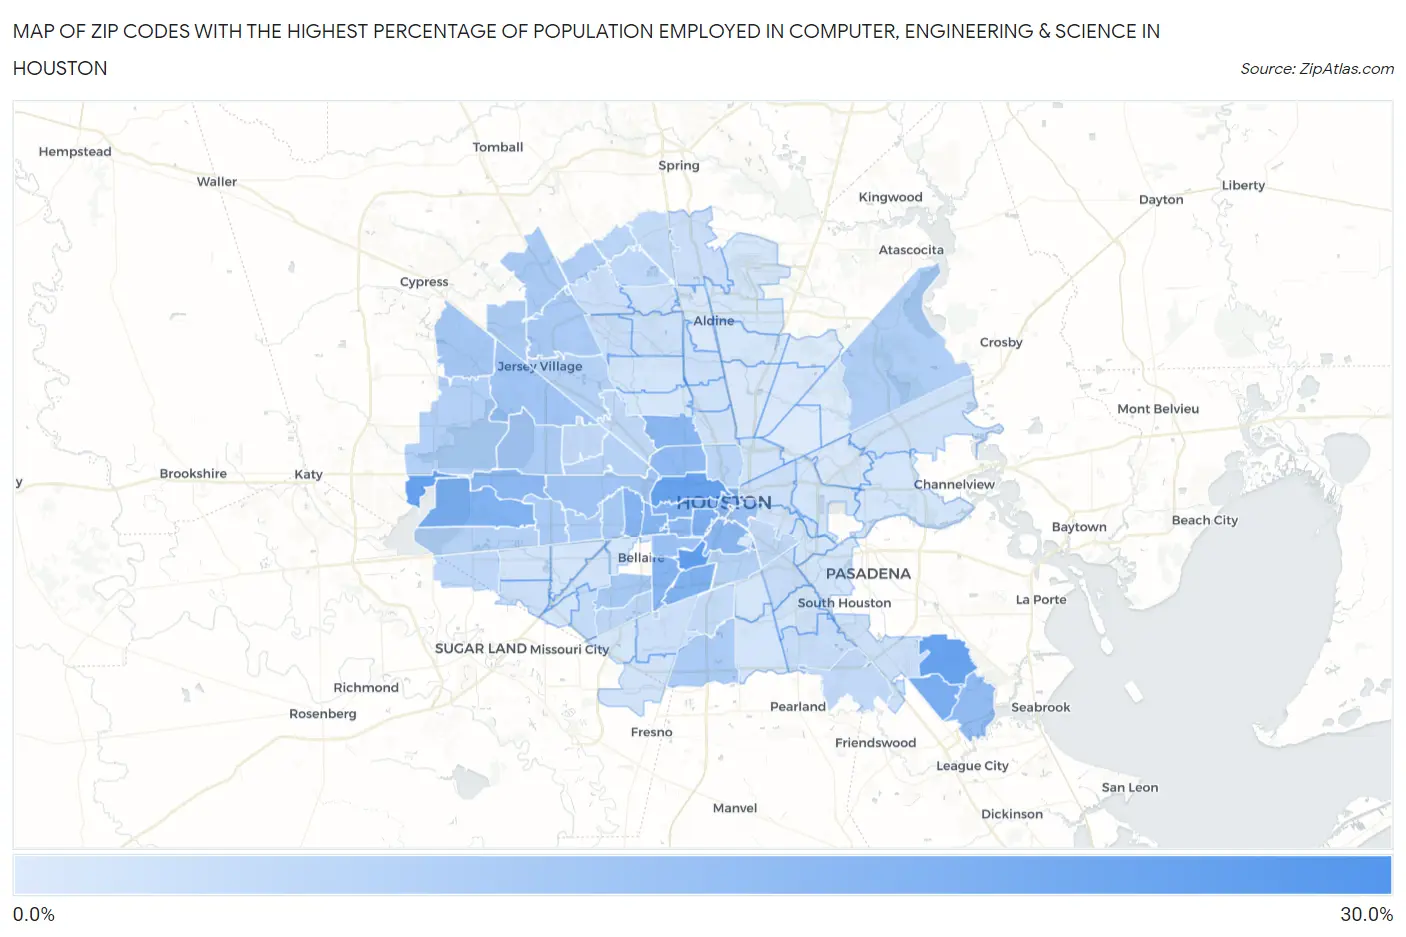
Map of Zip Codes with the Highest Percentage of Population Employed in Computer, Engineering & Science in Houston
0.0%
30.0%
Zip Codes with the Highest Percentage of Population Employed in Computer, Engineering & Science in Houston, TX
| Zip Code | % Employed | vs State | vs National | |
| 1. | 77046 | 26.0% | 6.5%(+19.5)#13 | 6.8%(+19.3)#251 |
| 2. | 77030 | 21.1% | 6.5%(+14.6)#20 | 6.8%(+14.4)#430 |
| 3. | 77094 | 20.2% | 6.5%(+13.7)#29 | 6.8%(+13.4)#496 |
| 4. | 77059 | 20.0% | 6.5%(+13.5)#30 | 6.8%(+13.2)#515 |
| 5. | 77007 | 19.9% | 6.5%(+13.4)#31 | 6.8%(+13.2)#519 |
| 6. | 77062 | 16.7% | 6.5%(+10.2)#47 | 6.8%(+9.91)#857 |
| 7. | 77006 | 16.0% | 6.5%(+9.46)#53 | 6.8%(+9.19)#963 |
| 8. | 77054 | 15.6% | 6.5%(+9.08)#57 | 6.8%(+8.82)#1,018 |
| 9. | 77077 | 15.4% | 6.5%(+8.86)#62 | 6.8%(+8.59)#1,059 |
| 10. | 77056 | 14.8% | 6.5%(+8.26)#70 | 6.8%(+7.99)#1,160 |
| 11. | 77019 | 14.6% | 6.5%(+8.10)#71 | 6.8%(+7.84)#1,198 |
| 12. | 77025 | 14.5% | 6.5%(+8.00)#73 | 6.8%(+7.74)#1,224 |
| 13. | 77027 | 14.2% | 6.5%(+7.75)#78 | 6.8%(+7.48)#1,282 |
| 14. | 77018 | 13.9% | 6.5%(+7.44)#82 | 6.8%(+7.18)#1,357 |
| 15. | 77002 | 13.9% | 6.5%(+7.42)#84 | 6.8%(+7.15)#1,365 |
| 16. | 77004 | 13.9% | 6.5%(+7.40)#85 | 6.8%(+7.14)#1,373 |
| 17. | 77079 | 13.3% | 6.5%(+6.84)#98 | 6.8%(+6.57)#1,522 |
| 18. | 77098 | 13.0% | 6.5%(+6.46)#105 | 6.8%(+6.19)#1,655 |
| 19. | 77008 | 12.6% | 6.5%(+6.15)#111 | 6.8%(+5.88)#1,769 |
| 20. | 77058 | 12.5% | 6.5%(+5.99)#113 | 6.8%(+5.72)#1,830 |
| 21. | 77003 | 11.1% | 6.5%(+4.57)#146 | 6.8%(+4.31)#2,527 |
| 22. | 77005 | 10.7% | 6.5%(+4.18)#161 | 6.8%(+3.92)#2,737 |
| 23. | 77041 | 10.1% | 6.5%(+3.56)#182 | 6.8%(+3.29)#3,174 |
| 24. | 77024 | 10.0% | 6.5%(+3.46)#187 | 6.8%(+3.20)#3,252 |
| 25. | 77095 | 9.2% | 6.5%(+2.68)#214 | 6.8%(+2.42)#3,883 |
| 26. | 77096 | 8.9% | 6.5%(+2.40)#228 | 6.8%(+2.14)#4,168 |
| 27. | 77057 | 8.8% | 6.5%(+2.31)#232 | 6.8%(+2.04)#4,256 |
| 28. | 77070 | 8.6% | 6.5%(+2.09)#240 | 6.8%(+1.83)#4,497 |
| 29. | 77064 | 8.6% | 6.5%(+2.09)#241 | 6.8%(+1.82)#4,508 |
| 30. | 77042 | 8.3% | 6.5%(+1.82)#256 | 6.8%(+1.55)#4,833 |
| 31. | 77065 | 8.3% | 6.5%(+1.79)#260 | 6.8%(+1.52)#4,890 |
| 32. | 77063 | 8.2% | 6.5%(+1.71)#267 | 6.8%(+1.45)#4,980 |
| 33. | 77043 | 8.1% | 6.5%(+1.62)#274 | 6.8%(+1.35)#5,098 |
| 34. | 77010 | 8.1% | 6.5%(+1.61)#277 | 6.8%(+1.35)#5,113 |
| 35. | 77047 | 8.0% | 6.5%(+1.47)#282 | 6.8%(+1.21)#5,306 |
| 36. | 77069 | 7.5% | 6.5%(+0.984)#317 | 6.8%(+0.719)#6,017 |
| 37. | 77044 | 7.2% | 6.5%(+0.708)#339 | 6.8%(+0.444)#6,440 |
| 38. | 77084 | 7.0% | 6.5%(+0.484)#357 | 6.8%(+0.220)#6,823 |
| 39. | 77082 | 6.8% | 6.5%(+0.264)#377 | 6.8%(-0.000)#7,216 |
| 40. | 77021 | 6.7% | 6.5%(+0.195)#388 | 6.8%(-0.069)#7,362 |
| 41. | 77055 | 6.6% | 6.5%(+0.111)#397 | 6.8%(-0.154)#7,512 |
| 42. | 77040 | 6.6% | 6.5%(+0.092)#401 | 6.8%(-0.172)#7,553 |
| 43. | 77068 | 6.0% | 6.5%(-0.480)#457 | 6.8%(-0.744)#8,784 |
| 44. | 77009 | 6.0% | 6.5%(-0.545)#464 | 6.8%(-0.809)#8,940 |
| 45. | 77035 | 5.7% | 6.5%(-0.834)#500 | 6.8%(-1.10)#9,625 |
| 46. | 77083 | 5.1% | 6.5%(-1.36)#557 | 6.8%(-1.62)#10,959 |
| 47. | 77014 | 5.0% | 6.5%(-1.45)#573 | 6.8%(-1.72)#11,233 |
| 48. | 77092 | 5.0% | 6.5%(-1.54)#584 | 6.8%(-1.81)#11,502 |
| 49. | 77089 | 4.9% | 6.5%(-1.58)#593 | 6.8%(-1.84)#11,596 |
| 50. | 77080 | 4.9% | 6.5%(-1.64)#603 | 6.8%(-1.90)#11,774 |
| 51. | 77023 | 4.9% | 6.5%(-1.65)#604 | 6.8%(-1.91)#11,786 |
| 52. | 77090 | 4.4% | 6.5%(-2.07)#661 | 6.8%(-2.33)#13,068 |
| 53. | 77051 | 4.4% | 6.5%(-2.15)#676 | 6.8%(-2.41)#13,319 |
| 54. | 77071 | 3.9% | 6.5%(-2.61)#745 | 6.8%(-2.87)#14,854 |
| 55. | 77087 | 3.7% | 6.5%(-2.82)#790 | 6.8%(-3.08)#15,549 |
| 56. | 77075 | 3.7% | 6.5%(-2.84)#796 | 6.8%(-3.11)#15,644 |
| 57. | 77086 | 3.5% | 6.5%(-2.99)#822 | 6.8%(-3.25)#16,229 |
| 58. | 77073 | 3.3% | 6.5%(-3.24)#883 | 6.8%(-3.51)#17,191 |
| 59. | 77066 | 3.2% | 6.5%(-3.28)#888 | 6.8%(-3.54)#17,317 |
| 60. | 77045 | 3.1% | 6.5%(-3.41)#913 | 6.8%(-3.67)#17,767 |
| 61. | 77020 | 3.1% | 6.5%(-3.43)#919 | 6.8%(-3.69)#17,837 |
| 62. | 77099 | 3.0% | 6.5%(-3.45)#925 | 6.8%(-3.72)#17,932 |
| 63. | 77034 | 3.0% | 6.5%(-3.45)#927 | 6.8%(-3.72)#17,944 |
| 64. | 77038 | 3.0% | 6.5%(-3.50)#937 | 6.8%(-3.76)#18,092 |
| 65. | 77037 | 2.9% | 6.5%(-3.64)#959 | 6.8%(-3.91)#18,663 |
| 66. | 77067 | 2.7% | 6.5%(-3.79)#988 | 6.8%(-4.05)#19,192 |
| 67. | 77022 | 2.6% | 6.5%(-3.93)#1,035 | 6.8%(-4.20)#19,784 |
| 68. | 77076 | 2.5% | 6.5%(-3.99)#1,049 | 6.8%(-4.25)#19,974 |
| 69. | 77049 | 2.4% | 6.5%(-4.08)#1,069 | 6.8%(-4.34)#20,311 |
| 70. | 77072 | 2.4% | 6.5%(-4.14)#1,085 | 6.8%(-4.40)#20,516 |
| 71. | 77053 | 2.2% | 6.5%(-4.25)#1,113 | 6.8%(-4.52)#20,936 |
| 72. | 77074 | 2.2% | 6.5%(-4.29)#1,120 | 6.8%(-4.56)#21,069 |
| 73. | 77026 | 2.1% | 6.5%(-4.35)#1,133 | 6.8%(-4.62)#21,280 |
| 74. | 77011 | 2.1% | 6.5%(-4.38)#1,139 | 6.8%(-4.64)#21,395 |
| 75. | 77081 | 2.1% | 6.5%(-4.45)#1,157 | 6.8%(-4.71)#21,670 |
| 76. | 77012 | 2.0% | 6.5%(-4.51)#1,172 | 6.8%(-4.78)#21,906 |
| 77. | 77048 | 2.0% | 6.5%(-4.52)#1,173 | 6.8%(-4.78)#21,935 |
| 78. | 77015 | 2.0% | 6.5%(-4.53)#1,176 | 6.8%(-4.79)#21,975 |
| 79. | 77031 | 1.9% | 6.5%(-4.55)#1,179 | 6.8%(-4.82)#22,059 |
| 80. | 77017 | 1.9% | 6.5%(-4.57)#1,184 | 6.8%(-4.83)#22,120 |
| 81. | 77061 | 1.9% | 6.5%(-4.57)#1,187 | 6.8%(-4.84)#22,141 |
| 82. | 77029 | 1.9% | 6.5%(-4.61)#1,201 | 6.8%(-4.87)#22,278 |
| 83. | 77088 | 1.9% | 6.5%(-4.62)#1,206 | 6.8%(-4.89)#22,337 |
| 84. | 77036 | 1.8% | 6.5%(-4.67)#1,220 | 6.8%(-4.94)#22,501 |
| 85. | 77091 | 1.6% | 6.5%(-4.87)#1,267 | 6.8%(-5.13)#23,165 |
| 86. | 77033 | 1.6% | 6.5%(-4.88)#1,269 | 6.8%(-5.14)#23,198 |
| 87. | 77032 | 1.6% | 6.5%(-4.92)#1,279 | 6.8%(-5.18)#23,328 |
| 88. | 77039 | 1.4% | 6.5%(-5.12)#1,319 | 6.8%(-5.39)#23,967 |
| 89. | 77085 | 1.4% | 6.5%(-5.15)#1,328 | 6.8%(-5.41)#24,037 |
| 90. | 77013 | 1.3% | 6.5%(-5.17)#1,332 | 6.8%(-5.43)#24,113 |
| 91. | 77093 | 1.1% | 6.5%(-5.39)#1,391 | 6.8%(-5.65)#24,754 |
| 92. | 77060 | 1.1% | 6.5%(-5.41)#1,396 | 6.8%(-5.67)#24,801 |
| 93. | 77204 | 0.85% | 6.5%(-5.65)#1,447 | 6.8%(-5.91)#25,451 |
| 94. | 77016 | 0.84% | 6.5%(-5.66)#1,449 | 6.8%(-5.92)#25,465 |
| 95. | 77050 | 0.60% | 6.5%(-5.90)#1,486 | 6.8%(-6.16)#26,017 |
| 96. | 77078 | 0.51% | 6.5%(-5.99)#1,505 | 6.8%(-6.26)#26,191 |
| 97. | 77028 | 0.47% | 6.5%(-6.03)#1,507 | 6.8%(-6.29)#26,246 |
1
Common Questions
What are the Top 10 Zip Codes with the Highest Percentage of Population Employed in Computer, Engineering & Science in Houston, TX?
Top 10 Zip Codes with the Highest Percentage of Population Employed in Computer, Engineering & Science in Houston, TX are:
What zip code has the Highest Percentage of Population Employed in Computer, Engineering & Science in Houston, TX?
77046 has the Highest Percentage of Population Employed in Computer, Engineering & Science in Houston, TX with 26.0%.
What is the Percentage of Population Employed in Computer, Engineering & Science in Houston, TX?
Percentage of Population Employed in Computer, Engineering & Science in Houston is 7.2%.
What is the Percentage of Population Employed in Computer, Engineering & Science in Texas?
Percentage of Population Employed in Computer, Engineering & Science in Texas is 6.5%.
What is the Percentage of Population Employed in Computer, Engineering & Science in the United States?
Percentage of Population Employed in Computer, Engineering & Science in the United States is 6.8%.