Zip Codes with the Highest Percentage of Population Employed in Computer, Engineering & Science in Richmond, TX
RELATED REPORTS & OPTIONS
Computer, Engineering & Science
Richmond
Compare Zip Codes
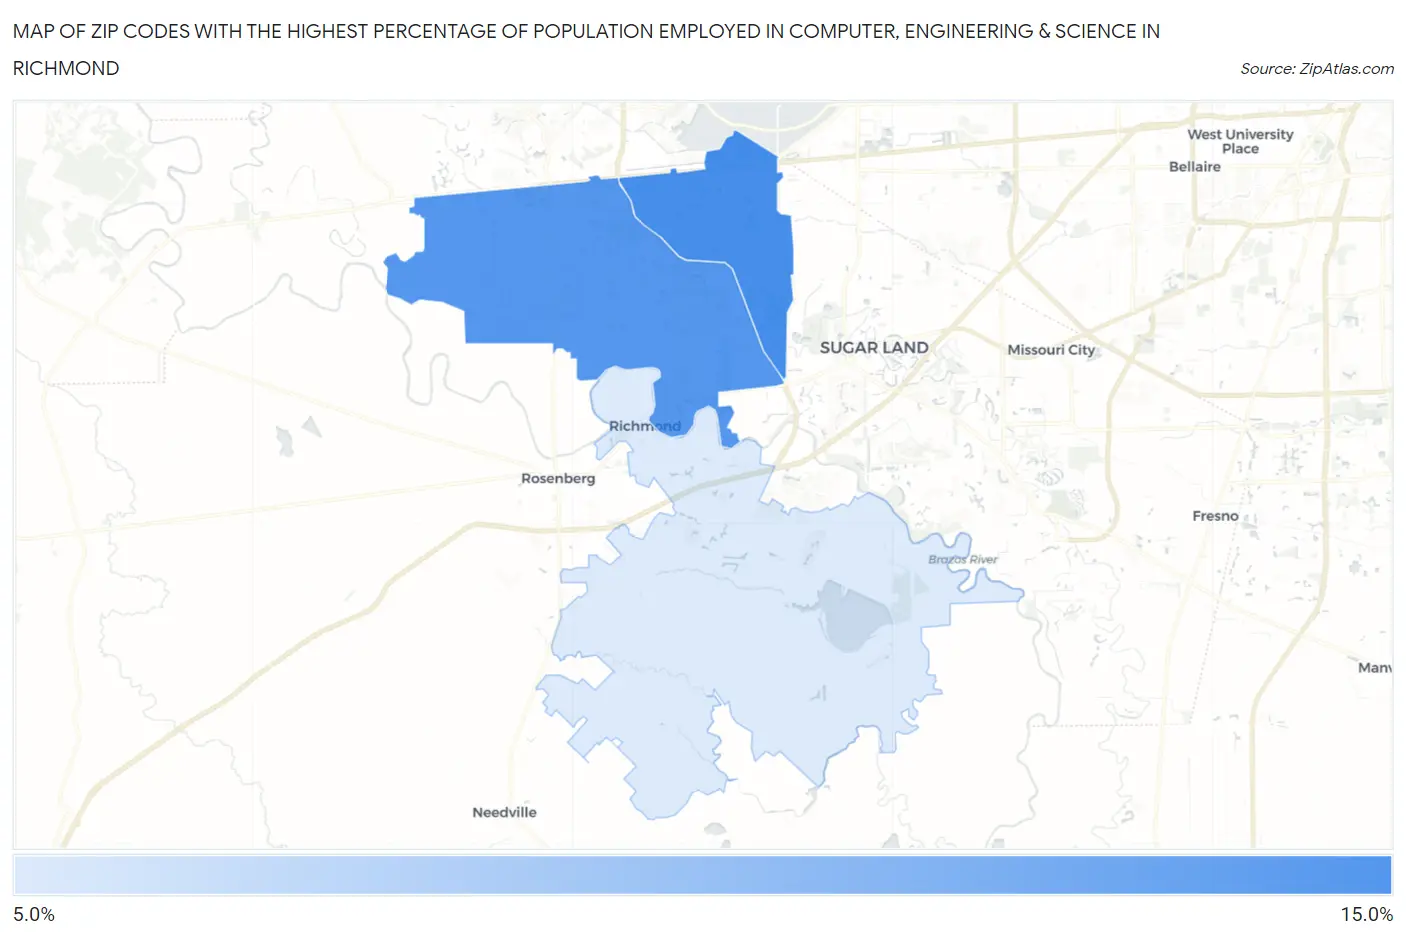
Map of Zip Codes with the Highest Percentage of Population Employed in Computer, Engineering & Science in Richmond
0.0%
15.0%
Zip Codes with the Highest Percentage of Population Employed in Computer, Engineering & Science in Richmond, TX
| Zip Code | % Employed | vs State | vs National | |
| 1. | 77407 | 11.7% | 6.5%(+5.18)#131 | 6.8%(+4.92)#2,188 |
| 2. | 77406 | 11.3% | 6.5%(+4.80)#138 | 6.8%(+4.54)#2,408 |
| 3. | 77469 | 7.5% | 6.5%(+1.02)#313 | 6.8%(+0.756)#5,964 |
1
Common Questions
What are the Top Zip Codes with the Highest Percentage of Population Employed in Computer, Engineering & Science in Richmond, TX?
Top Zip Codes with the Highest Percentage of Population Employed in Computer, Engineering & Science in Richmond, TX are:
What zip code has the Highest Percentage of Population Employed in Computer, Engineering & Science in Richmond, TX?
77407 has the Highest Percentage of Population Employed in Computer, Engineering & Science in Richmond, TX with 11.7%.
What is the Percentage of Population Employed in Computer, Engineering & Science in Richmond, TX?
Percentage of Population Employed in Computer, Engineering & Science in Richmond is 1.5%.
What is the Percentage of Population Employed in Computer, Engineering & Science in Texas?
Percentage of Population Employed in Computer, Engineering & Science in Texas is 6.5%.
What is the Percentage of Population Employed in Computer, Engineering & Science in the United States?
Percentage of Population Employed in Computer, Engineering & Science in the United States is 6.8%.