Zip Codes with the Highest Percentage of Population Employed in Computer, Engineering & Science in Harlingen, TX
RELATED REPORTS & OPTIONS
Computer, Engineering & Science
Harlingen
Compare Zip Codes
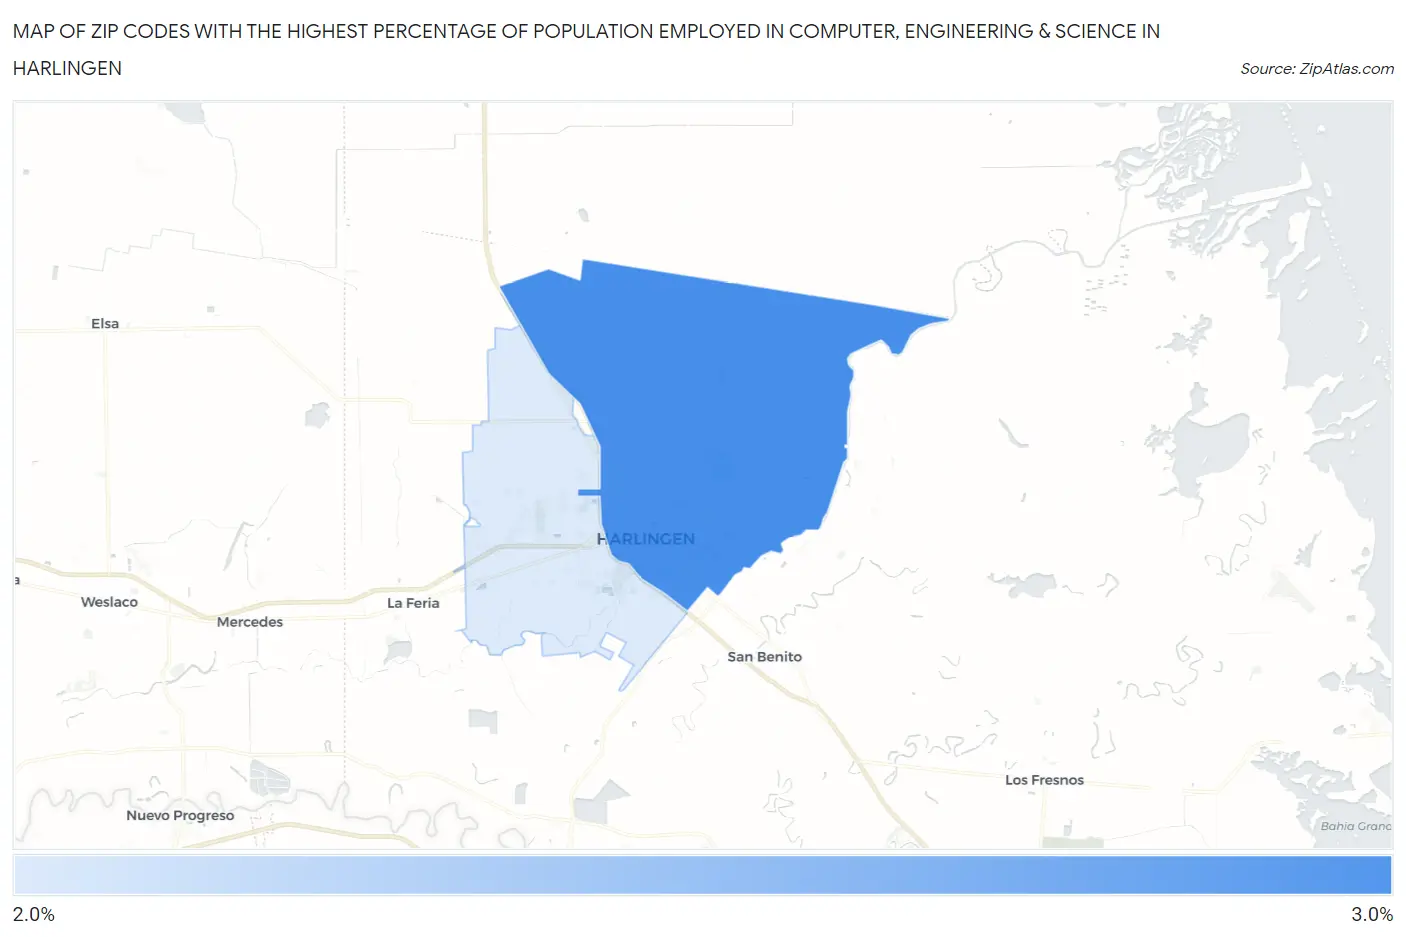
Map of Zip Codes with the Highest Percentage of Population Employed in Computer, Engineering & Science in Harlingen
0.0%
3.0%
Zip Codes with the Highest Percentage of Population Employed in Computer, Engineering & Science in Harlingen, TX
| Zip Code | % Employed | vs State | vs National | |
| 1. | 78550 | 2.6% | 6.5%(-3.89)#1,021 | 6.8%(-4.16)#19,610 |
| 2. | 78552 | 2.4% | 6.5%(-4.10)#1,077 | 6.8%(-4.36)#20,406 |
1
Common Questions
What are the Top Zip Codes with the Highest Percentage of Population Employed in Computer, Engineering & Science in Harlingen, TX?
Top Zip Codes with the Highest Percentage of Population Employed in Computer, Engineering & Science in Harlingen, TX are:
What zip code has the Highest Percentage of Population Employed in Computer, Engineering & Science in Harlingen, TX?
78550 has the Highest Percentage of Population Employed in Computer, Engineering & Science in Harlingen, TX with 2.6%.
What is the Percentage of Population Employed in Computer, Engineering & Science in Harlingen, TX?
Percentage of Population Employed in Computer, Engineering & Science in Harlingen is 2.5%.
What is the Percentage of Population Employed in Computer, Engineering & Science in Texas?
Percentage of Population Employed in Computer, Engineering & Science in Texas is 6.5%.
What is the Percentage of Population Employed in Computer, Engineering & Science in the United States?
Percentage of Population Employed in Computer, Engineering & Science in the United States is 6.8%.