Zip Codes with the Highest Percentage of Population Employed in Computer, Engineering & Science in North Richland Hills, TX
RELATED REPORTS & OPTIONS
Computer, Engineering & Science
North Richland Hills
Compare Zip Codes
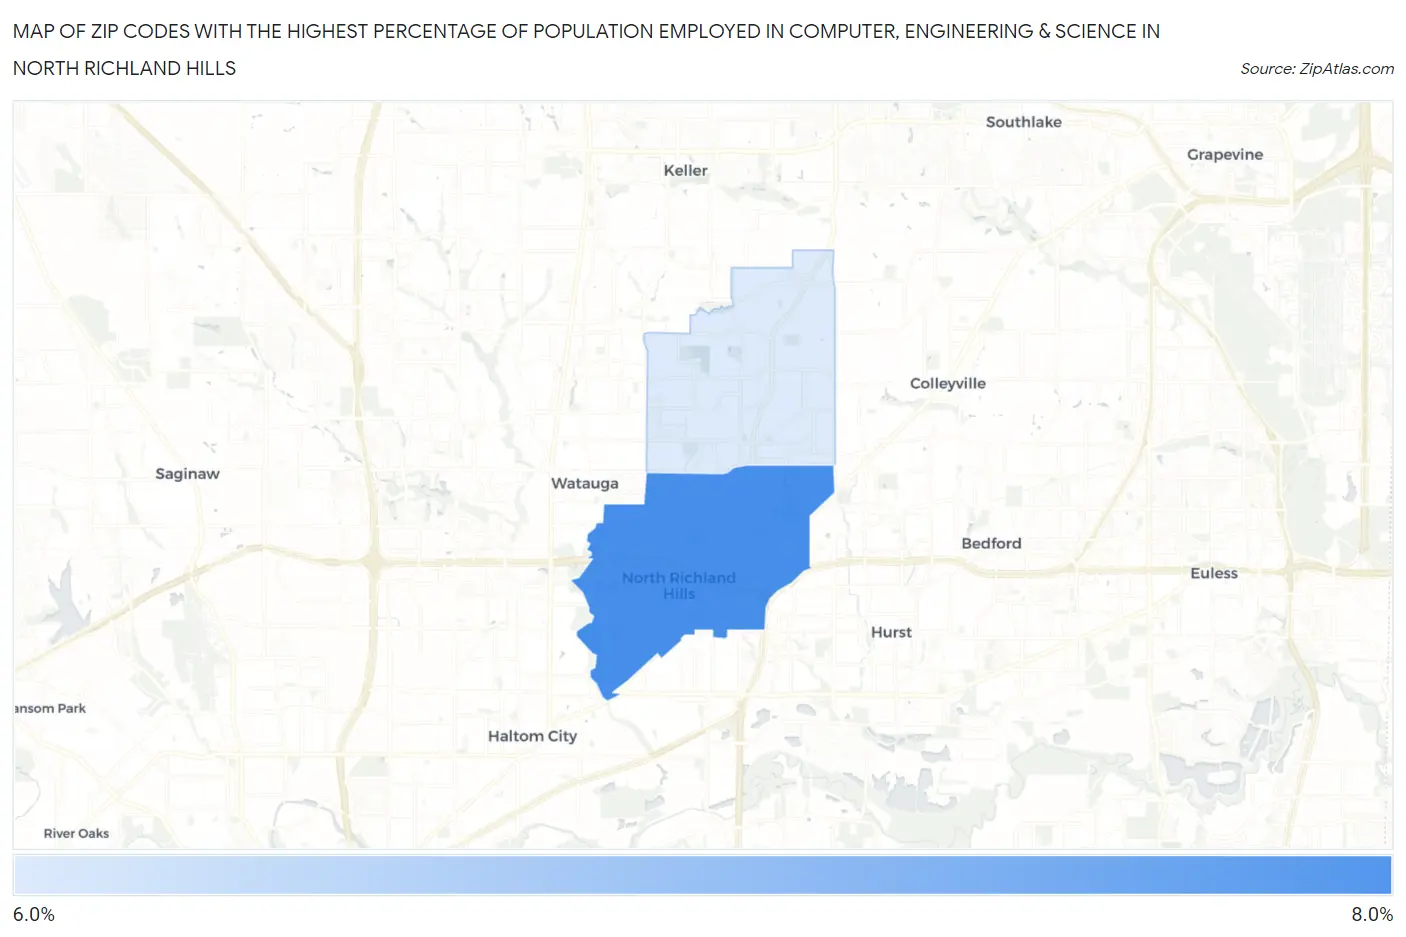
Map of Zip Codes with the Highest Percentage of Population Employed in Computer, Engineering & Science in North Richland Hills
0.0%
8.0%
Zip Codes with the Highest Percentage of Population Employed in Computer, Engineering & Science in North Richland Hills, TX
| Zip Code | % Employed | vs State | vs National | |
| 1. | 76180 | 7.6% | 6.5%(+1.14)#307 | 6.8%(+0.875)#5,775 |
| 2. | 76182 | 6.6% | 6.5%(+0.098)#400 | 6.8%(-0.166)#7,546 |
1
Common Questions
What are the Top Zip Codes with the Highest Percentage of Population Employed in Computer, Engineering & Science in North Richland Hills, TX?
Top Zip Codes with the Highest Percentage of Population Employed in Computer, Engineering & Science in North Richland Hills, TX are:
What zip code has the Highest Percentage of Population Employed in Computer, Engineering & Science in North Richland Hills, TX?
76180 has the Highest Percentage of Population Employed in Computer, Engineering & Science in North Richland Hills, TX with 7.6%.
What is the Percentage of Population Employed in Computer, Engineering & Science in North Richland Hills, TX?
Percentage of Population Employed in Computer, Engineering & Science in North Richland Hills is 7.3%.
What is the Percentage of Population Employed in Computer, Engineering & Science in Texas?
Percentage of Population Employed in Computer, Engineering & Science in Texas is 6.5%.
What is the Percentage of Population Employed in Computer, Engineering & Science in the United States?
Percentage of Population Employed in Computer, Engineering & Science in the United States is 6.8%.