Zip Codes with the Highest Percentage of Population Employed in Computer, Engineering & Science in New Mexico
RELATED REPORTS & OPTIONS
Computer, Engineering & Science
New Mexico
Compare Zip Codes
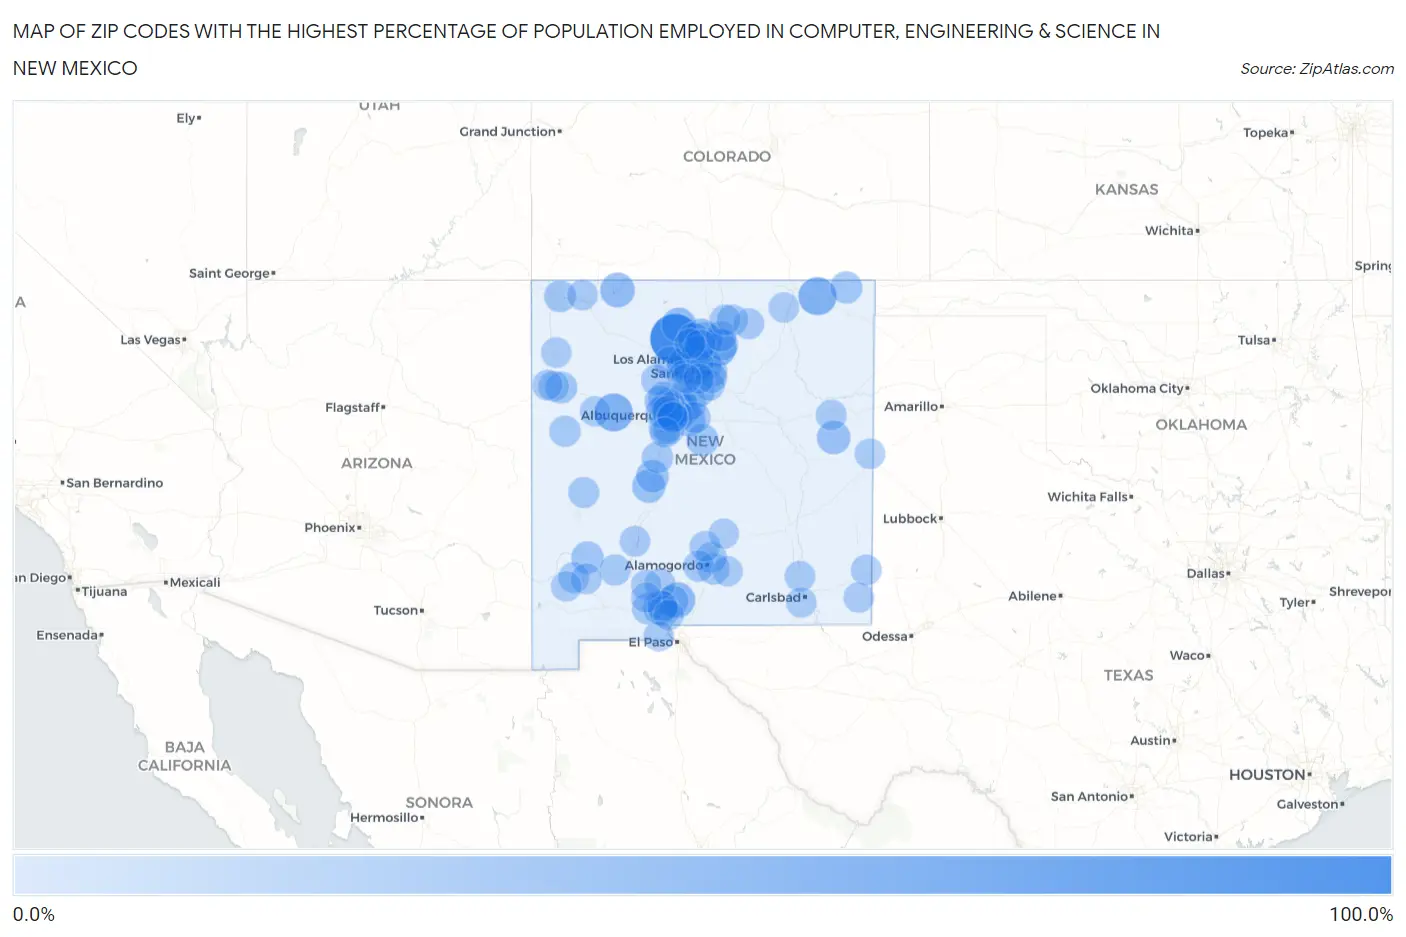
Map of Zip Codes with the Highest Percentage of Population Employed in Computer, Engineering & Science in New Mexico
0.0%
100.0%
Zip Codes with the Highest Percentage of Population Employed in Computer, Engineering & Science in New Mexico
| Zip Code | % Employed | vs State | vs National | |
| 1. | 87064 | 90.9% | 6.7%(+84.2)#1 | 6.8%(+84.1)#12 |
| 2. | 87547 | 41.6% | 6.7%(+34.9)#2 | 6.8%(+34.8)#71 |
| 3. | 87544 | 40.2% | 6.7%(+33.6)#3 | 6.8%(+33.5)#81 |
| 4. | 88414 | 38.5% | 6.7%(+31.8)#4 | 6.8%(+31.7)#92 |
| 5. | 87049 | 38.2% | 6.7%(+31.5)#5 | 6.8%(+31.4)#97 |
| 6. | 87578 | 37.8% | 6.7%(+31.2)#6 | 6.8%(+31.1)#101 |
| 7. | 88002 | 26.8% | 6.7%(+20.1)#7 | 6.8%(+20.0)#235 |
| 8. | 87582 | 26.4% | 6.7%(+19.7)#8 | 6.8%(+19.6)#244 |
| 9. | 87510 | 23.0% | 6.7%(+16.3)#9 | 6.8%(+16.2)#346 |
| 10. | 87419 | 23.0% | 6.7%(+16.3)#10 | 6.8%(+16.2)#349 |
| 11. | 88046 | 20.2% | 6.7%(+13.5)#11 | 6.8%(+13.4)#495 |
| 12. | 87122 | 18.1% | 6.7%(+11.4)#12 | 6.8%(+11.3)#675 |
| 13. | 88427 | 17.9% | 6.7%(+11.3)#13 | 6.8%(+11.2)#687 |
| 14. | 87801 | 17.2% | 6.7%(+10.6)#14 | 6.8%(+10.5)#788 |
| 15. | 87008 | 16.0% | 6.7%(+9.32)#15 | 6.8%(+9.22)#959 |
| 16. | 87043 | 15.3% | 6.7%(+8.68)#16 | 6.8%(+8.58)#1,062 |
| 17. | 87549 | 15.3% | 6.7%(+8.61)#17 | 6.8%(+8.51)#1,075 |
| 18. | 87059 | 15.1% | 6.7%(+8.42)#18 | 6.8%(+8.32)#1,109 |
| 19. | 87828 | 14.6% | 6.7%(+7.95)#19 | 6.8%(+7.84)#1,197 |
| 20. | 87047 | 13.6% | 6.7%(+6.89)#20 | 6.8%(+6.79)#1,460 |
| 21. | 87113 | 13.4% | 6.7%(+6.70)#21 | 6.8%(+6.59)#1,516 |
| 22. | 87548 | 13.3% | 6.7%(+6.65)#22 | 6.8%(+6.54)#1,540 |
| 23. | 87111 | 13.2% | 6.7%(+6.53)#23 | 6.8%(+6.42)#1,573 |
| 24. | 88049 | 12.8% | 6.7%(+6.18)#24 | 6.8%(+6.08)#1,698 |
| 25. | 88011 | 12.2% | 6.7%(+5.53)#25 | 6.8%(+5.43)#1,948 |
| 26. | 87022 | 12.1% | 6.7%(+5.45)#26 | 6.8%(+5.34)#1,983 |
| 27. | 87016 | 12.0% | 6.7%(+5.36)#27 | 6.8%(+5.25)#2,029 |
| 28. | 88419 | 12.0% | 6.7%(+5.34)#28 | 6.8%(+5.24)#2,037 |
| 29. | 87025 | 10.8% | 6.7%(+4.13)#29 | 6.8%(+4.03)#2,681 |
| 30. | 87421 | 10.7% | 6.7%(+4.04)#30 | 6.8%(+3.93)#2,730 |
| 31. | 87501 | 10.7% | 6.7%(+3.99)#31 | 6.8%(+3.89)#2,760 |
| 32. | 87316 | 10.5% | 6.7%(+3.85)#32 | 6.8%(+3.74)#2,863 |
| 33. | 87010 | 10.3% | 6.7%(+3.60)#33 | 6.8%(+3.49)#3,029 |
| 34. | 88325 | 9.8% | 6.7%(+3.18)#34 | 6.8%(+3.08)#3,333 |
| 35. | 87109 | 9.8% | 6.7%(+3.18)#35 | 6.8%(+3.08)#3,334 |
| 36. | 87083 | 9.8% | 6.7%(+3.10)#36 | 6.8%(+2.99)#3,401 |
| 37. | 87106 | 9.7% | 6.7%(+3.00)#37 | 6.8%(+2.89)#3,478 |
| 38. | 87112 | 9.5% | 6.7%(+2.81)#38 | 6.8%(+2.70)#3,629 |
| 39. | 87048 | 9.3% | 6.7%(+2.65)#39 | 6.8%(+2.54)#3,773 |
| 40. | 87114 | 9.2% | 6.7%(+2.51)#40 | 6.8%(+2.40)#3,900 |
| 41. | 87506 | 9.2% | 6.7%(+2.49)#41 | 6.8%(+2.39)#3,914 |
| 42. | 87123 | 9.1% | 6.7%(+2.47)#42 | 6.8%(+2.36)#3,940 |
| 43. | 87508 | 9.1% | 6.7%(+2.41)#43 | 6.8%(+2.31)#4,000 |
| 44. | 87068 | 9.0% | 6.7%(+2.30)#44 | 6.8%(+2.19)#4,111 |
| 45. | 87104 | 8.9% | 6.7%(+2.26)#45 | 6.8%(+2.15)#4,159 |
| 46. | 87006 | 8.8% | 6.7%(+2.15)#46 | 6.8%(+2.05)#4,245 |
| 47. | 87532 | 8.8% | 6.7%(+2.14)#47 | 6.8%(+2.04)#4,259 |
| 48. | 87102 | 8.7% | 6.7%(+2.07)#48 | 6.8%(+1.97)#4,325 |
| 49. | 87505 | 8.7% | 6.7%(+2.07)#49 | 6.8%(+1.97)#4,327 |
| 50. | 87015 | 8.6% | 6.7%(+1.94)#50 | 6.8%(+1.84)#4,485 |
| 51. | 87144 | 8.4% | 6.7%(+1.79)#51 | 6.8%(+1.69)#4,663 |
| 52. | 87357 | 8.4% | 6.7%(+1.73)#52 | 6.8%(+1.63)#4,718 |
| 53. | 87120 | 8.3% | 6.7%(+1.66)#53 | 6.8%(+1.55)#4,838 |
| 54. | 87110 | 8.2% | 6.7%(+1.57)#54 | 6.8%(+1.46)#4,960 |
| 55. | 88042 | 8.2% | 6.7%(+1.50)#55 | 6.8%(+1.40)#5,046 |
| 56. | 88337 | 7.5% | 6.7%(+0.888)#56 | 6.8%(+0.784)#5,917 |
| 57. | 87108 | 7.5% | 6.7%(+0.864)#57 | 6.8%(+0.760)#5,961 |
| 58. | 87521 | 7.4% | 6.7%(+0.735)#58 | 6.8%(+0.631)#6,180 |
| 59. | 88005 | 7.4% | 6.7%(+0.732)#59 | 6.8%(+0.628)#6,184 |
| 60. | 87566 | 7.1% | 6.7%(+0.452)#60 | 6.8%(+0.348)#6,610 |
| 61. | 88047 | 7.1% | 6.7%(+0.410)#61 | 6.8%(+0.306)#6,678 |
| 62. | 88330 | 7.0% | 6.7%(+0.384)#62 | 6.8%(+0.280)#6,726 |
| 63. | 87821 | 6.9% | 6.7%(+0.276)#63 | 6.8%(+0.172)#6,903 |
| 64. | 87571 | 6.8% | 6.7%(+0.177)#64 | 6.8%(+0.073)#7,092 |
| 65. | 87124 | 6.8% | 6.7%(+0.157)#65 | 6.8%(+0.053)#7,118 |
| 66. | 88065 | 6.6% | 6.7%(-0.046)#66 | 6.8%(-0.150)#7,508 |
| 67. | 87553 | 6.5% | 6.7%(-0.115)#67 | 6.8%(-0.219)#7,653 |
| 68. | 87710 | 6.5% | 6.7%(-0.159)#68 | 6.8%(-0.263)#7,734 |
| 69. | 88023 | 6.5% | 6.7%(-0.186)#69 | 6.8%(-0.290)#7,785 |
| 70. | 87529 | 6.4% | 6.7%(-0.295)#70 | 6.8%(-0.399)#7,995 |
| 71. | 87107 | 6.4% | 6.7%(-0.297)#71 | 6.8%(-0.401)#8,006 |
| 72. | 87116 | 6.2% | 6.7%(-0.432)#72 | 6.8%(-0.536)#8,272 |
| 73. | 88012 | 6.0% | 6.7%(-0.658)#73 | 6.8%(-0.761)#8,831 |
| 74. | 87322 | 5.8% | 6.7%(-0.817)#74 | 6.8%(-0.921)#9,204 |
| 75. | 87053 | 5.7% | 6.7%(-0.923)#75 | 6.8%(-1.03)#9,460 |
| 76. | 87935 | 5.7% | 6.7%(-0.928)#76 | 6.8%(-1.03)#9,478 |
| 77. | 88210 | 5.7% | 6.7%(-0.978)#77 | 6.8%(-1.08)#9,593 |
| 78. | 88001 | 5.5% | 6.7%(-1.12)#78 | 6.8%(-1.22)#9,952 |
| 79. | 88401 | 5.5% | 6.7%(-1.14)#79 | 6.8%(-1.24)#10,006 |
| 80. | 88352 | 5.4% | 6.7%(-1.22)#80 | 6.8%(-1.33)#10,217 |
| 81. | 88242 | 5.4% | 6.7%(-1.25)#81 | 6.8%(-1.36)#10,299 |
| 82. | 87402 | 5.4% | 6.7%(-1.27)#82 | 6.8%(-1.38)#10,355 |
| 83. | 88061 | 5.2% | 6.7%(-1.51)#83 | 6.8%(-1.61)#10,941 |
| 84. | 87507 | 5.1% | 6.7%(-1.59)#84 | 6.8%(-1.70)#11,176 |
| 85. | 87940 | 5.0% | 6.7%(-1.66)#85 | 6.8%(-1.76)#11,382 |
| 86. | 87537 | 5.0% | 6.7%(-1.70)#86 | 6.8%(-1.81)#11,500 |
| 87. | 87325 | 4.9% | 6.7%(-1.78)#87 | 6.8%(-1.88)#11,717 |
| 88. | 88135 | 4.8% | 6.7%(-1.81)#88 | 6.8%(-1.92)#11,803 |
| 89. | 87728 | 4.8% | 6.7%(-1.87)#89 | 6.8%(-1.98)#11,974 |
| 90. | 88007 | 4.6% | 6.7%(-2.05)#90 | 6.8%(-2.15)#12,457 |
| 91. | 87042 | 4.5% | 6.7%(-2.12)#91 | 6.8%(-2.23)#12,706 |
| 92. | 88231 | 4.5% | 6.7%(-2.12)#92 | 6.8%(-2.23)#12,714 |
| 93. | 88220 | 4.5% | 6.7%(-2.17)#93 | 6.8%(-2.27)#12,846 |
| 94. | 88317 | 4.4% | 6.7%(-2.22)#94 | 6.8%(-2.32)#13,031 |
| 95. | 87301 | 4.3% | 6.7%(-2.32)#95 | 6.8%(-2.42)#13,347 |
| 96. | 88072 | 4.3% | 6.7%(-2.35)#96 | 6.8%(-2.45)#13,447 |
| 97. | 87020 | 4.3% | 6.7%(-2.36)#97 | 6.8%(-2.46)#13,480 |
| 98. | 88008 | 4.3% | 6.7%(-2.40)#98 | 6.8%(-2.50)#13,631 |
| 99. | 87041 | 4.1% | 6.7%(-2.55)#99 | 6.8%(-2.66)#14,128 |
| 100. | 88345 | 4.1% | 6.7%(-2.57)#100 | 6.8%(-2.67)#14,187 |
Common Questions
What are the Top 10 Zip Codes with the Highest Percentage of Population Employed in Computer, Engineering & Science in New Mexico?
Top 10 Zip Codes with the Highest Percentage of Population Employed in Computer, Engineering & Science in New Mexico are:
What zip code has the Highest Percentage of Population Employed in Computer, Engineering & Science in New Mexico?
87064 has the Highest Percentage of Population Employed in Computer, Engineering & Science in New Mexico with 90.9%.
What is the Percentage of Population Employed in Computer, Engineering & Science in the State of New Mexico?
Percentage of Population Employed in Computer, Engineering & Science in New Mexico is 6.7%.
What is the Percentage of Population Employed in Computer, Engineering & Science in the United States?
Percentage of Population Employed in Computer, Engineering & Science in the United States is 6.8%.