Zip Codes with the Highest Percentage of Population Employed in Computer, Engineering & Science in Hurst, TX
RELATED REPORTS & OPTIONS
Computer, Engineering & Science
Hurst
Compare Zip Codes
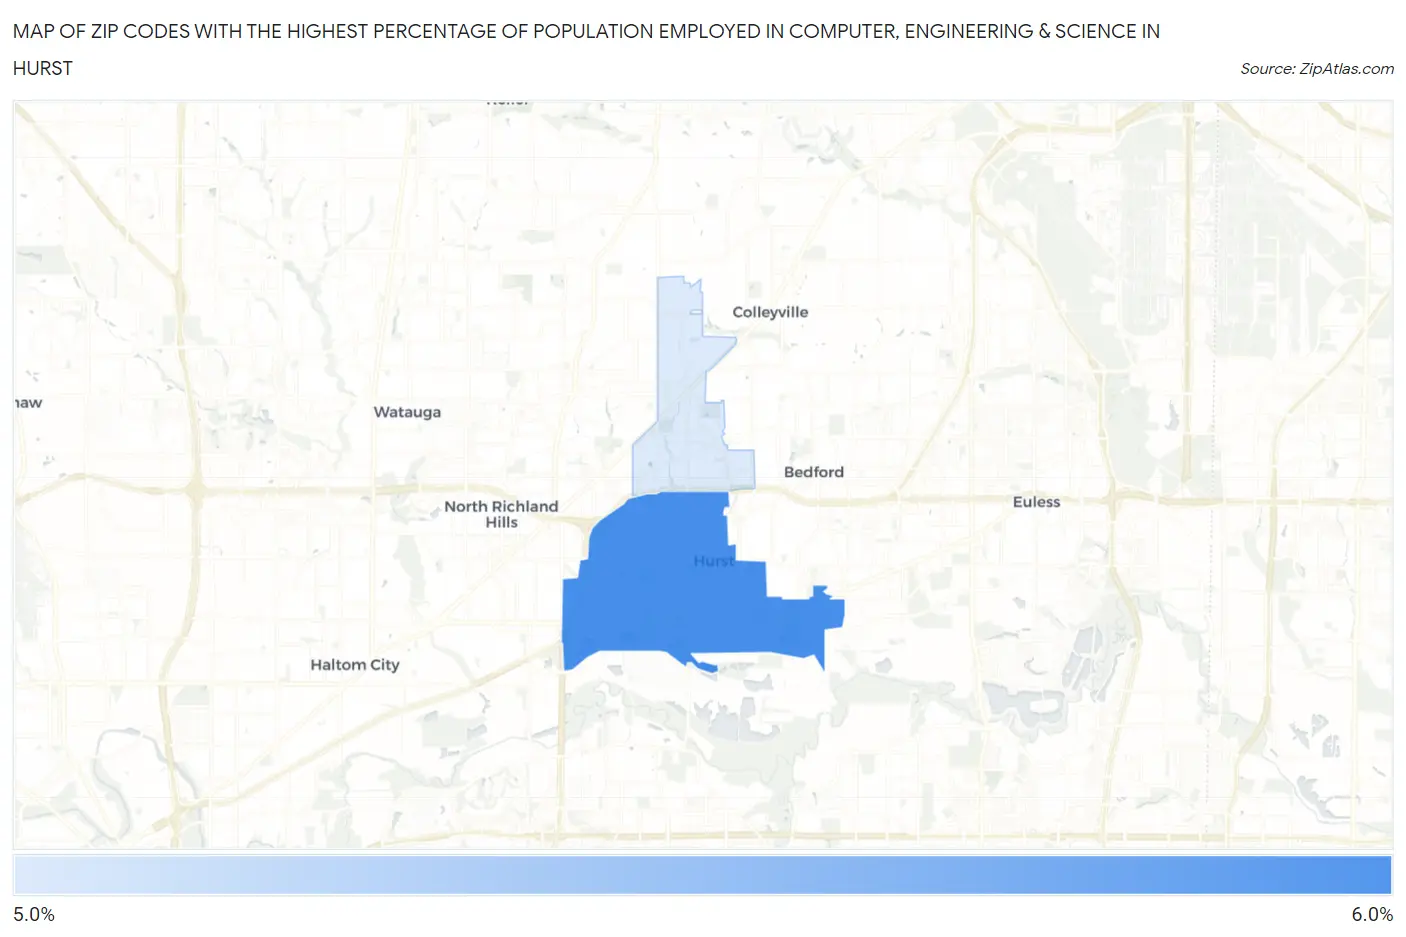
Map of Zip Codes with the Highest Percentage of Population Employed in Computer, Engineering & Science in Hurst
0.0%
6.0%
Zip Codes with the Highest Percentage of Population Employed in Computer, Engineering & Science in Hurst, TX
| Zip Code | % Employed | vs State | vs National | |
| 1. | 76053 | 5.7% | 6.5%(-0.770)#491 | 6.8%(-1.03)#9,483 |
| 2. | 76054 | 5.7% | 6.5%(-0.811)#497 | 6.8%(-1.08)#9,578 |
1
Common Questions
What are the Top Zip Codes with the Highest Percentage of Population Employed in Computer, Engineering & Science in Hurst, TX?
Top Zip Codes with the Highest Percentage of Population Employed in Computer, Engineering & Science in Hurst, TX are:
What zip code has the Highest Percentage of Population Employed in Computer, Engineering & Science in Hurst, TX?
76053 has the Highest Percentage of Population Employed in Computer, Engineering & Science in Hurst, TX with 5.7%.
What is the Percentage of Population Employed in Computer, Engineering & Science in Hurst, TX?
Percentage of Population Employed in Computer, Engineering & Science in Hurst is 5.2%.
What is the Percentage of Population Employed in Computer, Engineering & Science in Texas?
Percentage of Population Employed in Computer, Engineering & Science in Texas is 6.5%.
What is the Percentage of Population Employed in Computer, Engineering & Science in the United States?
Percentage of Population Employed in Computer, Engineering & Science in the United States is 6.8%.