Zip Codes with the Highest Percentage of Population Employed in Office & Administration in Amarillo, TX
RELATED REPORTS & OPTIONS
Office & Administration
Amarillo
Compare Zip Codes
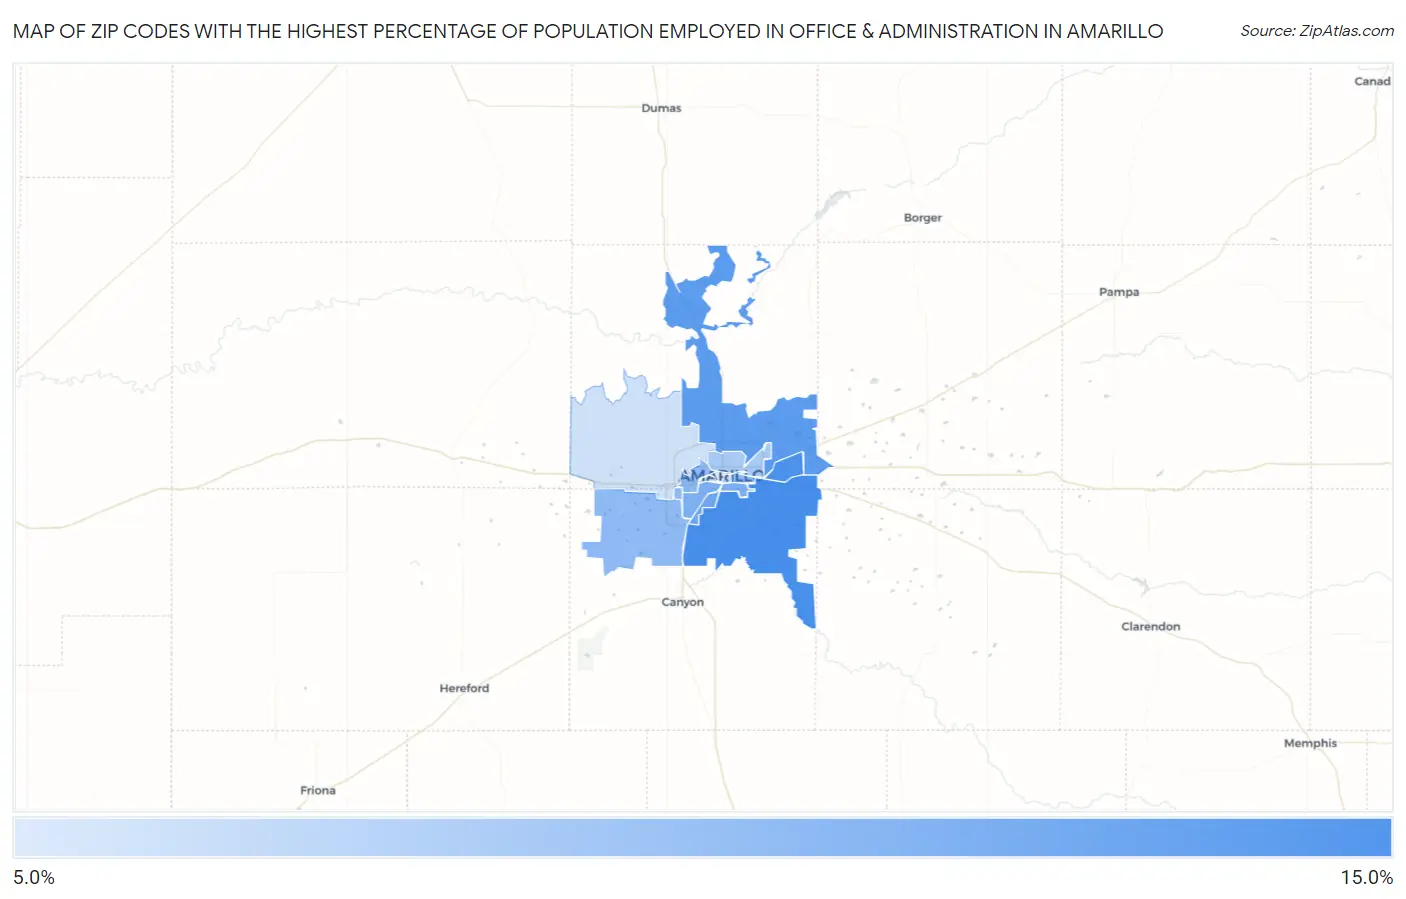
Map of Zip Codes with the Highest Percentage of Population Employed in Office & Administration in Amarillo
0.0%
15.0%
Zip Codes with the Highest Percentage of Population Employed in Office & Administration in Amarillo, TX
| Zip Code | % Employed | vs State | vs National | |
| 1. | 79118 | 14.6% | 11.0%(+3.67)#306 | 10.9%(+3.79)#5,052 |
| 2. | 79111 | 14.3% | 11.0%(+3.34)#337 | 10.9%(+3.45)#5,511 |
| 3. | 79108 | 13.4% | 11.0%(+2.43)#443 | 10.9%(+2.55)#7,138 |
| 4. | 79110 | 12.1% | 11.0%(+1.15)#637 | 10.9%(+1.27)#10,368 |
| 5. | 79109 | 11.2% | 11.0%(+0.221)#784 | 10.9%(+0.336)#13,228 |
| 6. | 79103 | 11.1% | 11.0%(+0.153)#799 | 10.9%(+0.268)#13,440 |
| 7. | 79104 | 10.1% | 11.0%(-0.863)#1,014 | 10.9%(-0.747)#16,766 |
| 8. | 79106 | 9.9% | 11.0%(-1.03)#1,050 | 10.9%(-0.918)#17,318 |
| 9. | 79119 | 9.9% | 11.0%(-1.08)#1,065 | 10.9%(-0.965)#17,491 |
| 10. | 79121 | 9.6% | 11.0%(-1.36)#1,130 | 10.9%(-1.25)#18,389 |
| 11. | 79107 | 8.4% | 11.0%(-2.58)#1,316 | 10.9%(-2.46)#21,963 |
| 12. | 79102 | 6.8% | 11.0%(-4.15)#1,513 | 10.9%(-4.03)#25,528 |
| 13. | 79124 | 5.9% | 11.0%(-5.10)#1,586 | 10.9%(-4.98)#27,041 |
| 14. | 79101 | 5.0% | 11.0%(-5.94)#1,637 | 10.9%(-5.83)#28,080 |
1
Common Questions
What are the Top 10 Zip Codes with the Highest Percentage of Population Employed in Office & Administration in Amarillo, TX?
Top 10 Zip Codes with the Highest Percentage of Population Employed in Office & Administration in Amarillo, TX are:
What zip code has the Highest Percentage of Population Employed in Office & Administration in Amarillo, TX?
79118 has the Highest Percentage of Population Employed in Office & Administration in Amarillo, TX with 14.6%.
What is the Percentage of Population Employed in Office & Administration in Amarillo, TX?
Percentage of Population Employed in Office & Administration in Amarillo is 10.6%.
What is the Percentage of Population Employed in Office & Administration in Texas?
Percentage of Population Employed in Office & Administration in Texas is 11.0%.
What is the Percentage of Population Employed in Office & Administration in the United States?
Percentage of Population Employed in Office & Administration in the United States is 10.9%.