Zip Codes with the Highest Percentage of Population with a Degree in Physical and Health Sciences in Amarillo, TX
RELATED REPORTS & OPTIONS
Physical and Health Sciences
Amarillo
Compare Zip Codes
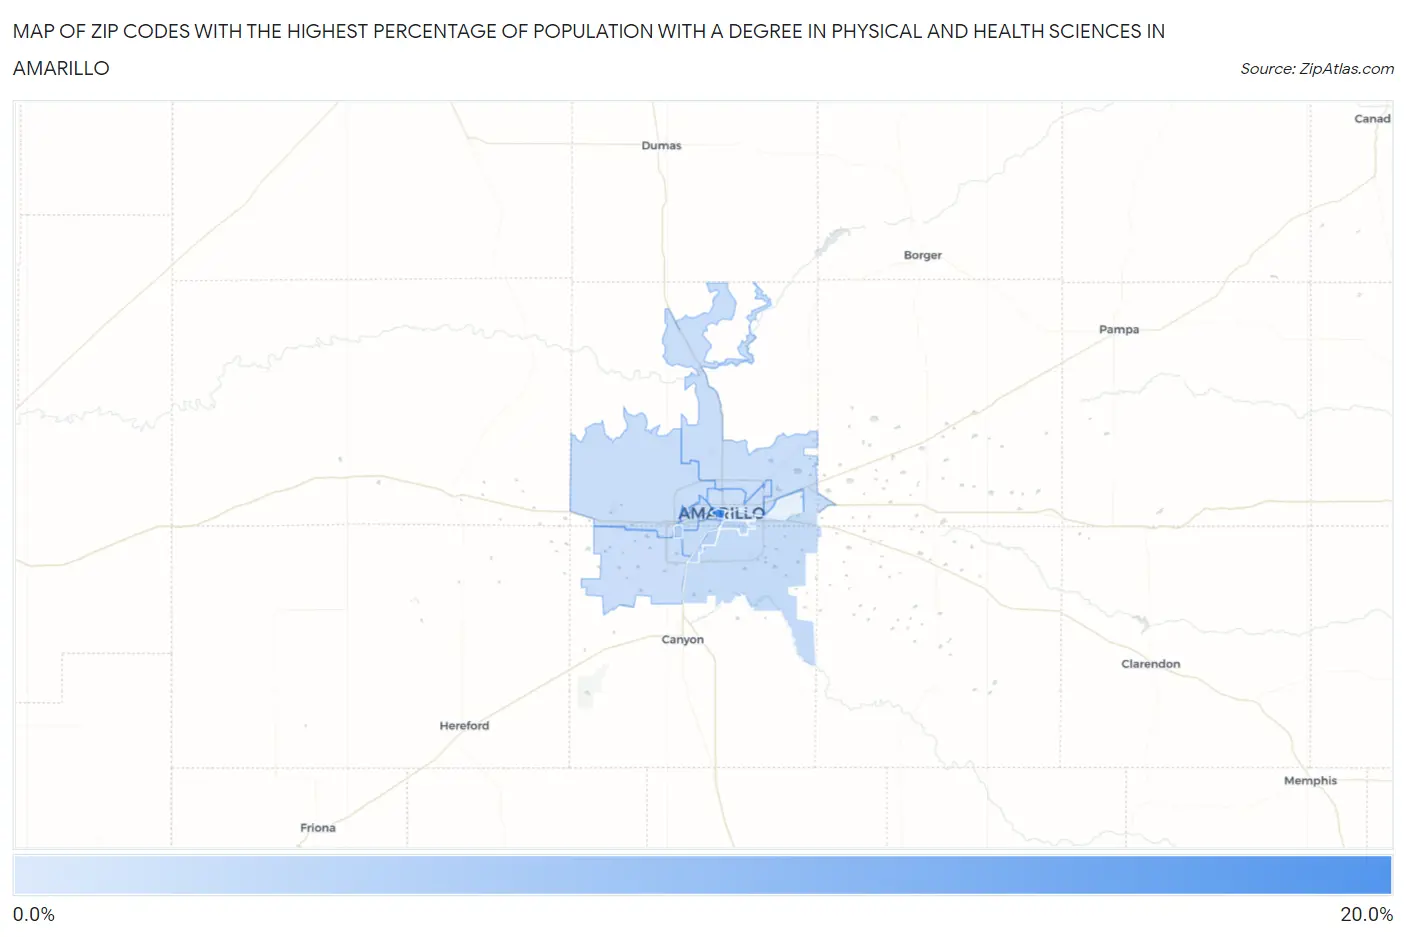
Map of Zip Codes with the Highest Percentage of Population with a Degree in Physical and Health Sciences in Amarillo
0.0%
20.0%
Zip Codes with the Highest Percentage of Population with a Degree in Physical and Health Sciences in Amarillo, TX
| Zip Code | % Graduates | vs State | vs National | |
| 1. | 79101 | 20.0% | 3.3%(+16.7)#32 | 3.1%(+16.9)#404 |
| 2. | 79121 | 6.1% | 3.3%(+2.75)#224 | 3.1%(+2.97)#3,194 |
| 3. | 79110 | 5.4% | 3.3%(+2.05)#267 | 3.1%(+2.27)#3,996 |
| 4. | 79103 | 5.1% | 3.3%(+1.80)#286 | 3.1%(+2.02)#4,368 |
| 5. | 79118 | 4.1% | 3.3%(+0.773)#411 | 3.1%(+0.992)#6,493 |
| 6. | 79104 | 3.9% | 3.3%(+0.591)#453 | 3.1%(+0.811)#7,012 |
| 7. | 79106 | 3.6% | 3.3%(+0.326)#525 | 3.1%(+0.546)#7,899 |
| 8. | 79109 | 3.6% | 3.3%(+0.307)#532 | 3.1%(+0.527)#7,962 |
| 9. | 79124 | 3.5% | 3.3%(+0.204)#559 | 3.1%(+0.424)#8,347 |
| 10. | 79108 | 3.4% | 3.3%(+0.122)#575 | 3.1%(+0.342)#8,659 |
| 11. | 79119 | 3.1% | 3.3%(-0.195)#640 | 3.1%(+0.024)#9,886 |
| 12. | 79107 | 3.1% | 3.3%(-0.266)#660 | 3.1%(-0.046)#10,192 |
| 13. | 79102 | 1.0% | 3.3%(-2.30)#1,196 | 3.1%(-2.08)#19,183 |
1
Common Questions
What are the Top 10 Zip Codes with the Highest Percentage of Population with a Degree in Physical and Health Sciences in Amarillo, TX?
Top 10 Zip Codes with the Highest Percentage of Population with a Degree in Physical and Health Sciences in Amarillo, TX are:
What zip code has the Highest Percentage of Population with a Degree in Physical and Health Sciences in Amarillo, TX?
79101 has the Highest Percentage of Population with a Degree in Physical and Health Sciences in Amarillo, TX with 20.0%.
What is the Percentage of Population with a Degree in Physical and Health Sciences in Amarillo, TX?
Percentage of Population with a Degree in Physical and Health Sciences in Amarillo is 4.0%.
What is the Percentage of Population with a Degree in Physical and Health Sciences in Texas?
Percentage of Population with a Degree in Physical and Health Sciences in Texas is 3.3%.
What is the Percentage of Population with a Degree in Physical and Health Sciences in the United States?
Percentage of Population with a Degree in Physical and Health Sciences in the United States is 3.1%.