Zip Codes with the Highest Percentage of Population Employed in Legal Services & Support in Amarillo, TX
RELATED REPORTS & OPTIONS
Legal Services & Support
Amarillo
Compare Zip Codes
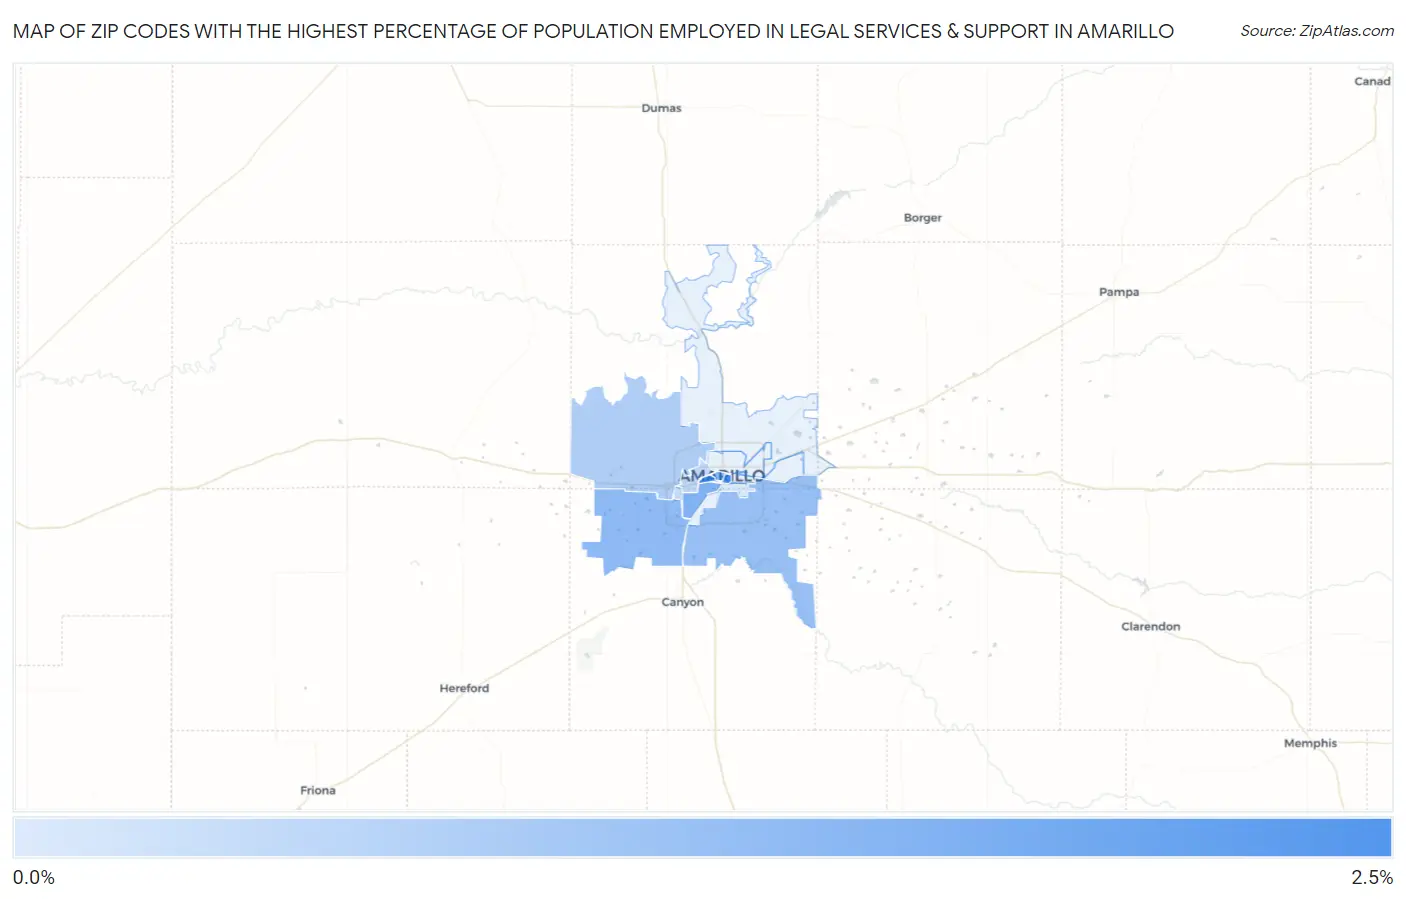
Map of Zip Codes with the Highest Percentage of Population Employed in Legal Services & Support in Amarillo
0.0%
2.5%
Zip Codes with the Highest Percentage of Population Employed in Legal Services & Support in Amarillo, TX
| Zip Code | % Employed | vs State | vs National | |
| 1. | 79102 | 2.3% | 1.0%(+1.33)#149 | 1.2%(+1.15)#2,785 |
| 2. | 79109 | 1.5% | 1.0%(+0.458)#275 | 1.2%(+0.282)#5,191 |
| 3. | 79101 | 1.3% | 1.0%(+0.342)#311 | 1.2%(+0.166)#5,687 |
| 4. | 79119 | 1.3% | 1.0%(+0.267)#329 | 1.2%(+0.092)#6,060 |
| 5. | 79118 | 1.1% | 1.0%(+0.106)#384 | 1.2%(-0.070)#7,063 |
| 6. | 79124 | 0.77% | 1.0%(-0.236)#545 | 1.2%(-0.412)#9,733 |
| 7. | 79106 | 0.50% | 1.0%(-0.506)#741 | 1.2%(-0.682)#12,603 |
| 8. | 79121 | 0.39% | 1.0%(-0.614)#846 | 1.2%(-0.789)#13,899 |
| 9. | 79103 | 0.098% | 1.0%(-0.910)#1,073 | 1.2%(-1.09)#17,143 |
1
Common Questions
What are the Top 10 Zip Codes with the Highest Percentage of Population Employed in Legal Services & Support in Amarillo, TX?
Top 10 Zip Codes with the Highest Percentage of Population Employed in Legal Services & Support in Amarillo, TX are:
What zip code has the Highest Percentage of Population Employed in Legal Services & Support in Amarillo, TX?
79102 has the Highest Percentage of Population Employed in Legal Services & Support in Amarillo, TX with 2.3%.
What is the Percentage of Population Employed in Legal Services & Support in Amarillo, TX?
Percentage of Population Employed in Legal Services & Support in Amarillo is 0.78%.
What is the Percentage of Population Employed in Legal Services & Support in Texas?
Percentage of Population Employed in Legal Services & Support in Texas is 1.0%.
What is the Percentage of Population Employed in Legal Services & Support in the United States?
Percentage of Population Employed in Legal Services & Support in the United States is 1.2%.