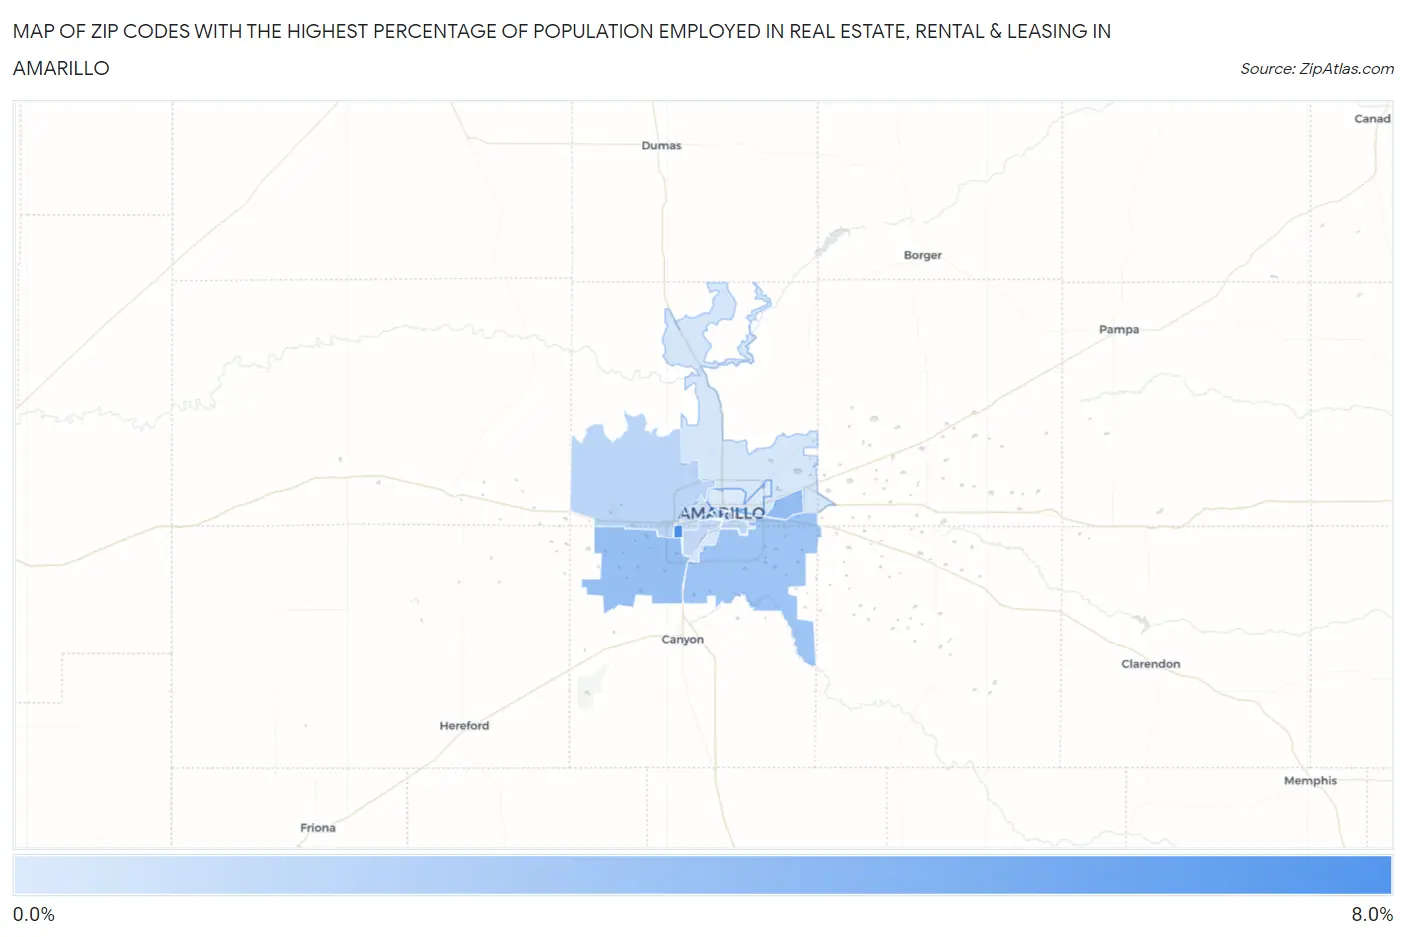
Zip Codes with the Highest Percentage of Population Employed in Real Estate, Rental & Leasing in Amarillo, TX
RELATED REPORTS & OPTIONS
Real Estate, Rental & Leasing
Amarillo
Compare Zip Codes
Map of Zip Codes with the Highest Percentage of Population Employed in Real Estate, Rental & Leasing in Amarillo
0.0%
8.0%
Zip Codes with the Highest Percentage of Population Employed in Real Estate, Rental & Leasing in Amarillo, TX
| Zip Code | % Employed | vs State | vs National | |
| 1. | 79121 | 6.1% | 2.0%(+4.12)#42 | 1.9%(+4.24)#933 |
| 2. | 79111 | 3.2% | 2.0%(+1.22)#212 | 1.9%(+1.34)#3,349 |
| 3. | 79119 | 3.1% | 2.0%(+1.09)#235 | 1.9%(+1.20)#3,629 |
| 4. | 79118 | 2.8% | 2.0%(+0.743)#323 | 1.9%(+0.859)#4,584 |
| 5. | 79124 | 1.8% | 2.0%(-0.238)#668 | 1.9%(-0.122)#9,318 |
| 6. | 79101 | 1.7% | 2.0%(-0.290)#693 | 1.9%(-0.174)#9,642 |
| 7. | 79102 | 1.6% | 2.0%(-0.402)#745 | 1.9%(-0.286)#10,405 |
| 8. | 79103 | 1.5% | 2.0%(-0.497)#799 | 1.9%(-0.381)#11,070 |
| 9. | 79109 | 1.5% | 2.0%(-0.528)#817 | 1.9%(-0.412)#11,300 |
| 10. | 79106 | 1.1% | 2.0%(-0.900)#984 | 1.9%(-0.784)#14,231 |
| 11. | 79108 | 0.77% | 2.0%(-1.24)#1,128 | 1.9%(-1.12)#16,904 |
| 12. | 79110 | 0.62% | 2.0%(-1.39)#1,183 | 1.9%(-1.28)#18,152 |
| 13. | 79107 | 0.48% | 2.0%(-1.52)#1,239 | 1.9%(-1.41)#19,200 |
1
Common Questions
What are the Top 10 Zip Codes with the Highest Percentage of Population Employed in Real Estate, Rental & Leasing in Amarillo, TX?
Top 10 Zip Codes with the Highest Percentage of Population Employed in Real Estate, Rental & Leasing in Amarillo, TX are:
What zip code has the Highest Percentage of Population Employed in Real Estate, Rental & Leasing in Amarillo, TX?
79121 has the Highest Percentage of Population Employed in Real Estate, Rental & Leasing in Amarillo, TX with 6.1%.
What is the Percentage of Population Employed in Real Estate, Rental & Leasing in Amarillo, TX?
Percentage of Population Employed in Real Estate, Rental & Leasing in Amarillo is 1.6%.
What is the Percentage of Population Employed in Real Estate, Rental & Leasing in Texas?
Percentage of Population Employed in Real Estate, Rental & Leasing in Texas is 2.0%.
What is the Percentage of Population Employed in Real Estate, Rental & Leasing in the United States?
Percentage of Population Employed in Real Estate, Rental & Leasing in the United States is 1.9%.