Tioga, ND
Tioga Map
Tioga Overview
1,376
TOTAL POPULATION
754
MALE POPULATION
622
FEMALE POPULATION
121.22
MALES / 100 FEMALES
82.49
FEMALES / 100 MALES
36.0
MEDIAN AGE
2.9
AVG FAMILY SIZE
1.9
AVG HOUSEHOLD SIZE
$40,409
PER CAPITA INCOME
$98,819
AVG FAMILY INCOME
$63,920
AVG HOUSEHOLD INCOME
48.8%
WAGE / INCOME GAP [ % ]
51.2¢/ $1
WAGE / INCOME GAP [ $ ]
0.40
INEQUALITY / GINI INDEX
718
LABOR FORCE [ PEOPLE ]
61.3%
PERCENT IN LABOR FORCE
4.9%
UNEMPLOYMENT RATE
Tioga Zip Codes
Tioga Area Codes
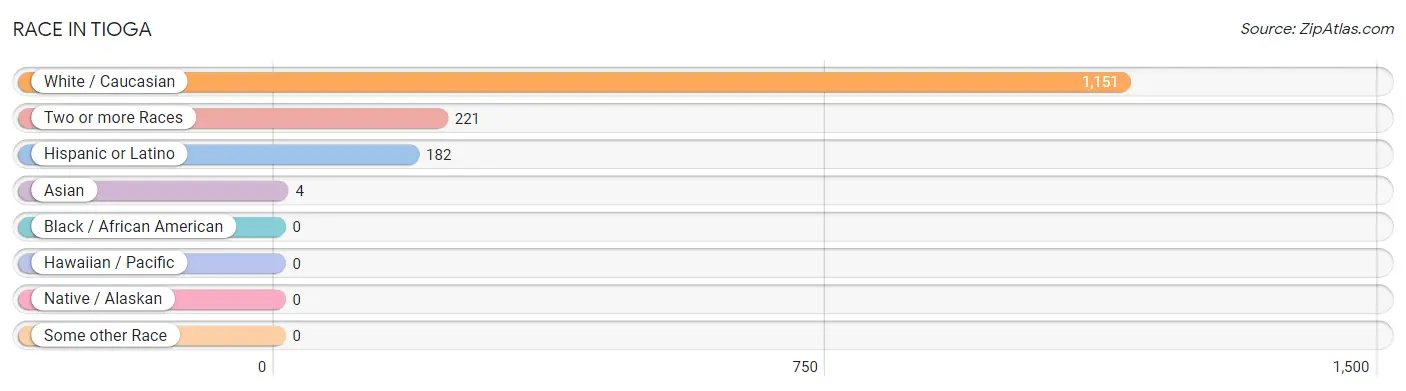
Race in Tioga
The most populous races in Tioga are White / Caucasian (1,151 | 83.7%), Two or more Races (221 | 16.1%), and Hispanic or Latino (182 | 13.2%).
| Race | # Population | % Population |
| Asian | 4 | 0.3% |
| Black / African American | 0 | 0.0% |
| Hawaiian / Pacific | 0 | 0.0% |
| Hispanic or Latino | 182 | 13.2% |
| Native / Alaskan | 0 | 0.0% |
| White / Caucasian | 1,151 | 83.7% |
| Two or more Races | 221 | 16.1% |
| Some other Race | 0 | 0.0% |
| Total | 1,376 | 100.0% |
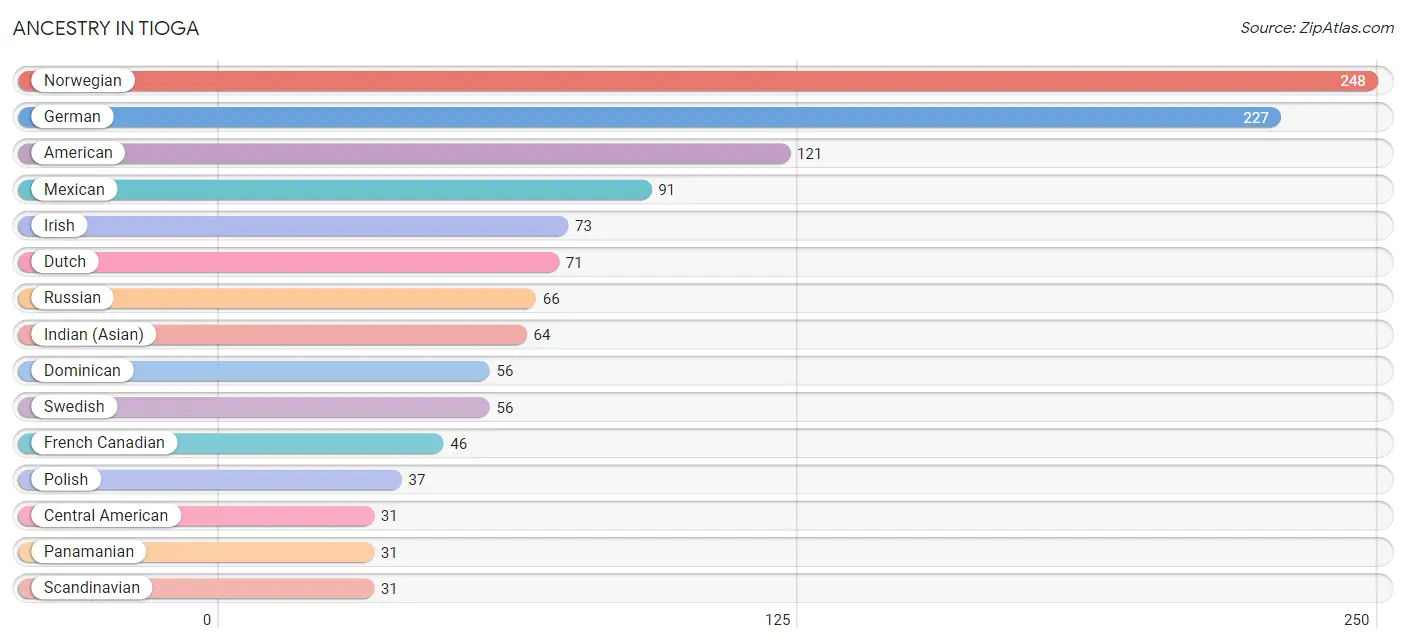
Ancestry in Tioga
The most populous ancestries reported in Tioga are Norwegian (248 | 18.0%), German (227 | 16.5%), American (121 | 8.8%), Mexican (91 | 6.6%), and Irish (73 | 5.3%), together accounting for 55.2% of all Tioga residents.
| Ancestry | # Population | % Population |
| American | 121 | 8.8% |
| Austrian | 20 | 1.5% |
| Burmese | 4 | 0.3% |
| Central American | 31 | 2.2% |
| Cherokee | 15 | 1.1% |
| Czech | 3 | 0.2% |
| Dominican | 56 | 4.1% |
| Dutch | 71 | 5.2% |
| English | 27 | 2.0% |
| European | 14 | 1.0% |
| French Canadian | 46 | 3.3% |
| German | 227 | 16.5% |
| Indian (Asian) | 64 | 4.6% |
| Irish | 73 | 5.3% |
| Italian | 27 | 2.0% |
| Mexican | 91 | 6.6% |
| Native Hawaiian | 4 | 0.3% |
| Norwegian | 248 | 18.0% |
| Panamanian | 31 | 2.2% |
| Polish | 37 | 2.7% |
| Russian | 66 | 4.8% |
| Scandinavian | 31 | 2.2% |
| Swedish | 56 | 4.1% |
| Ukrainian | 14 | 1.0% | View All 24 Rows |
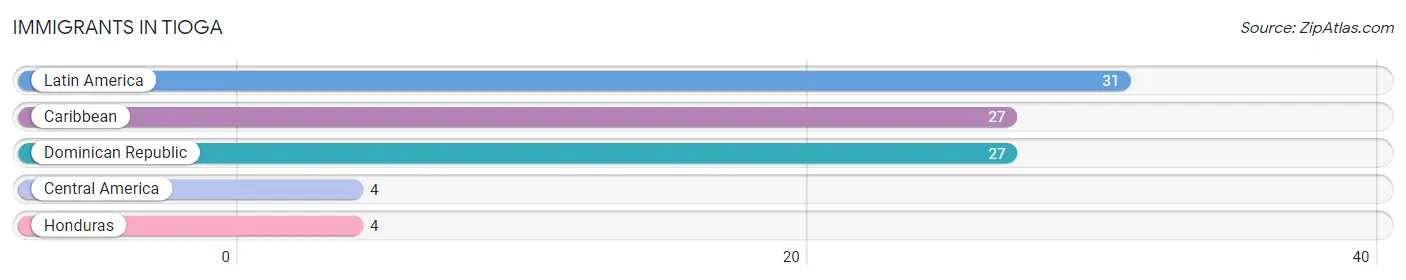
Immigrants in Tioga
The most numerous immigrant groups reported in Tioga came from Latin America (31 | 2.2%), Caribbean (27 | 2.0%), Dominican Republic (27 | 2.0%), Central America (4 | 0.3%), and Honduras (4 | 0.3%), together accounting for 6.7% of all Tioga residents.
| Immigration Origin | # Population | % Population |
| Caribbean | 27 | 2.0% |
| Central America | 4 | 0.3% |
| Dominican Republic | 27 | 2.0% |
| Honduras | 4 | 0.3% |
| Latin America | 31 | 2.2% | View All 5 Rows |
Sex and Age in Tioga
Sex and Age in Tioga
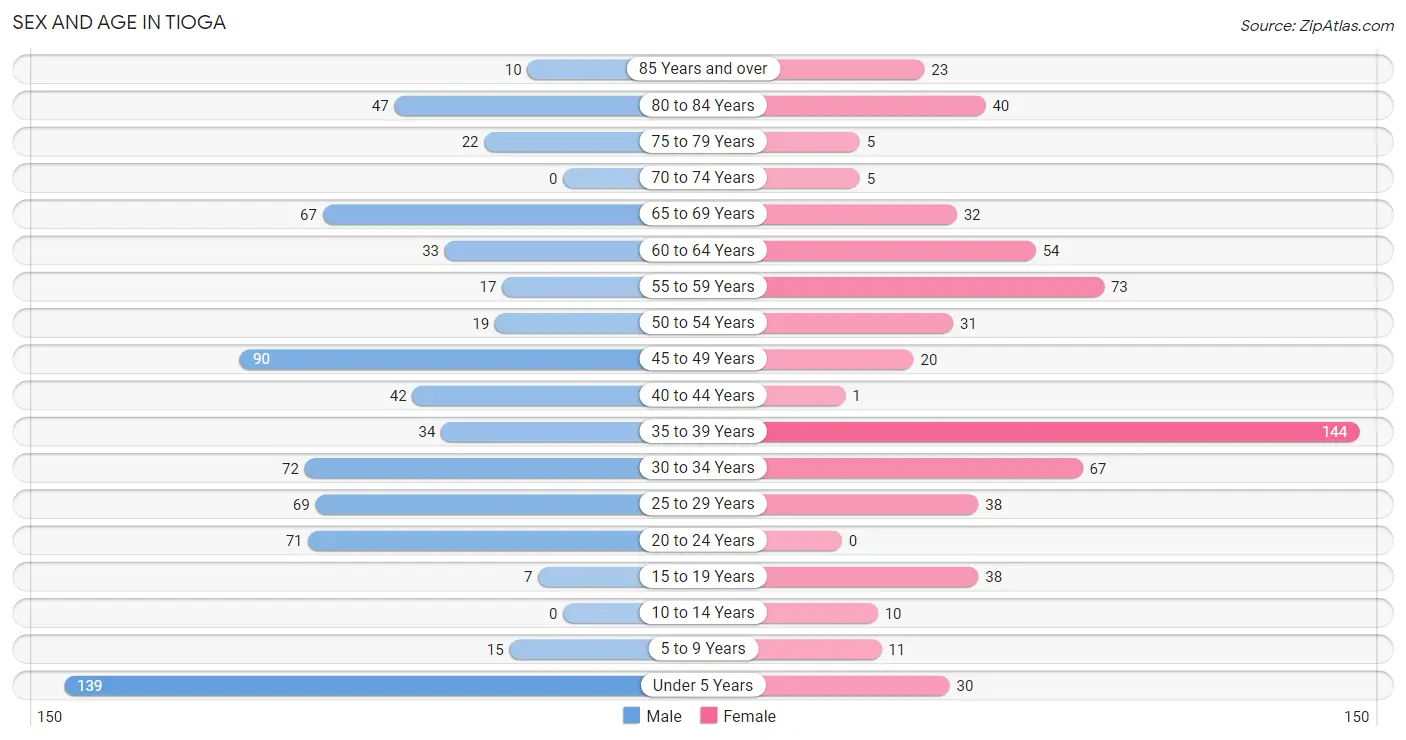
The most populous age groups in Tioga are Under 5 Years (139 | 18.4%) for men and 35 to 39 Years (144 | 23.2%) for women.
| Age Bracket | Male | Female |
| Under 5 Years | 139 (18.4%) | 30 (4.8%) |
| 5 to 9 Years | 15 (2.0%) | 11 (1.8%) |
| 10 to 14 Years | 0 (0.0%) | 10 (1.6%) |
| 15 to 19 Years | 7 (0.9%) | 38 (6.1%) |
| 20 to 24 Years | 71 (9.4%) | 0 (0.0%) |
| 25 to 29 Years | 69 (9.1%) | 38 (6.1%) |
| 30 to 34 Years | 72 (9.6%) | 67 (10.8%) |
| 35 to 39 Years | 34 (4.5%) | 144 (23.2%) |
| 40 to 44 Years | 42 (5.6%) | 1 (0.2%) |
| 45 to 49 Years | 90 (11.9%) | 20 (3.2%) |
| 50 to 54 Years | 19 (2.5%) | 31 (5.0%) |
| 55 to 59 Years | 17 (2.2%) | 73 (11.7%) |
| 60 to 64 Years | 33 (4.4%) | 54 (8.7%) |
| 65 to 69 Years | 67 (8.9%) | 32 (5.1%) |
| 70 to 74 Years | 0 (0.0%) | 5 (0.8%) |
| 75 to 79 Years | 22 (2.9%) | 5 (0.8%) |
| 80 to 84 Years | 47 (6.2%) | 40 (6.4%) |
| 85 Years and over | 10 (1.3%) | 23 (3.7%) |
| Total | 754 (100.0%) | 622 (100.0%) |
Families and Households in Tioga
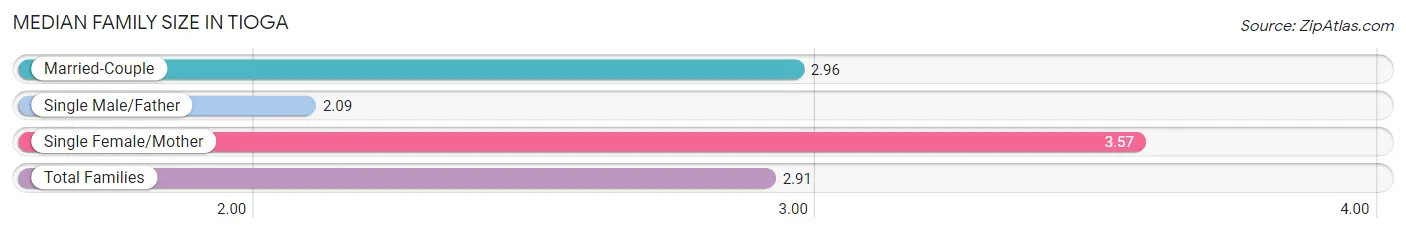
Median Family Size in Tioga
The median family size in Tioga is 2.91 persons per family, with single female/mother families (47 | 14.1%) accounting for the largest median family size of 3.57 persons per family. On the other hand, single male/father families (53 | 15.9%) represent the smallest median family size with 2.09 persons per family.
| Family Type | # Families | Family Size |
| Married-Couple | 233 (70.0%) | 2.96 |
| Single Male/Father | 53 (15.9%) | 2.09 |
| Single Female/Mother | 47 (14.1%) | 3.57 |
| Total Families | 333 (100.0%) | 2.91 |
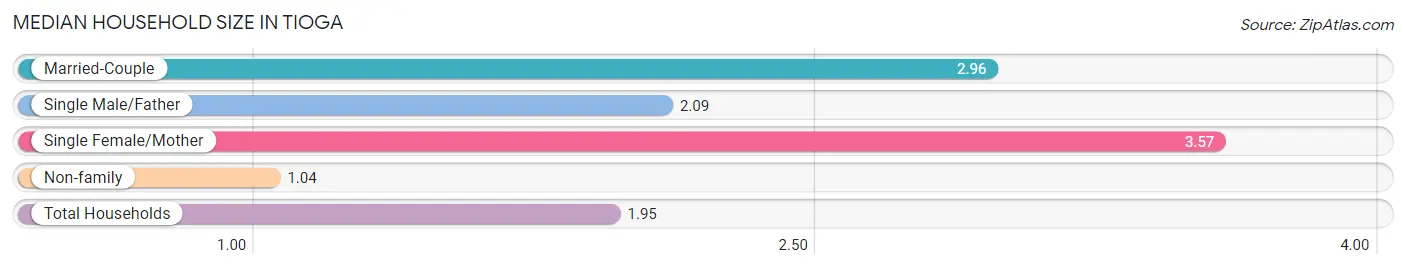
Median Household Size in Tioga
The median household size in Tioga is 1.95 persons per household, with single female/mother households (47 | 6.8%) accounting for the largest median household size of 3.57 persons per household. non-family households (355 | 51.6%) represent the smallest median household size with 1.04 persons per household.
| Household Type | # Households | Household Size |
| Married-Couple | 233 (33.9%) | 2.96 |
| Single Male/Father | 53 (7.7%) | 2.09 |
| Single Female/Mother | 47 (6.8%) | 3.57 |
| Non-family | 355 (51.6%) | 1.04 |
| Total Households | 688 (100.0%) | 1.95 |
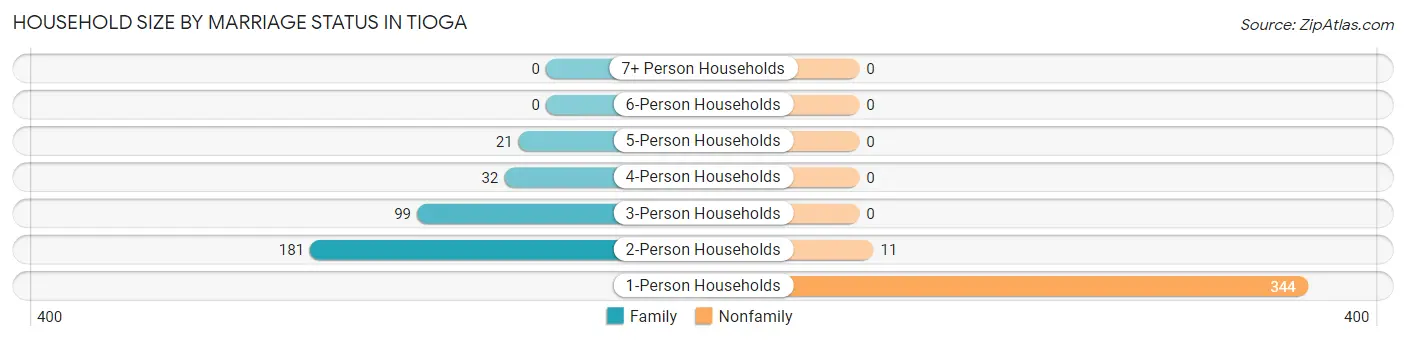
Household Size by Marriage Status in Tioga
Out of a total of 688 households in Tioga, 333 (48.4%) are family households, while 355 (51.6%) are nonfamily households. The most numerous type of family households are 2-person households, comprising 181, and the most common type of nonfamily households are 1-person households, comprising 344.
| Household Size | Family Households | Nonfamily Households |
| 1-Person Households | - | 344 (50.0%) |
| 2-Person Households | 181 (26.3%) | 11 (1.6%) |
| 3-Person Households | 99 (14.4%) | 0 (0.0%) |
| 4-Person Households | 32 (4.6%) | 0 (0.0%) |
| 5-Person Households | 21 (3.0%) | 0 (0.0%) |
| 6-Person Households | 0 (0.0%) | 0 (0.0%) |
| 7+ Person Households | 0 (0.0%) | 0 (0.0%) |
| Total | 333 (48.4%) | 355 (51.6%) |
Female Fertility in Tioga
Fertility by Age in Tioga
Average fertility rate in Tioga is 153.0 births per 1,000 women. Women in the age bracket of 35 to 50 years have the highest fertility rate with 273.0 births per 1,000 women. Women in the age bracket of 35 to 50 years acount for 95.7% of all women with births.
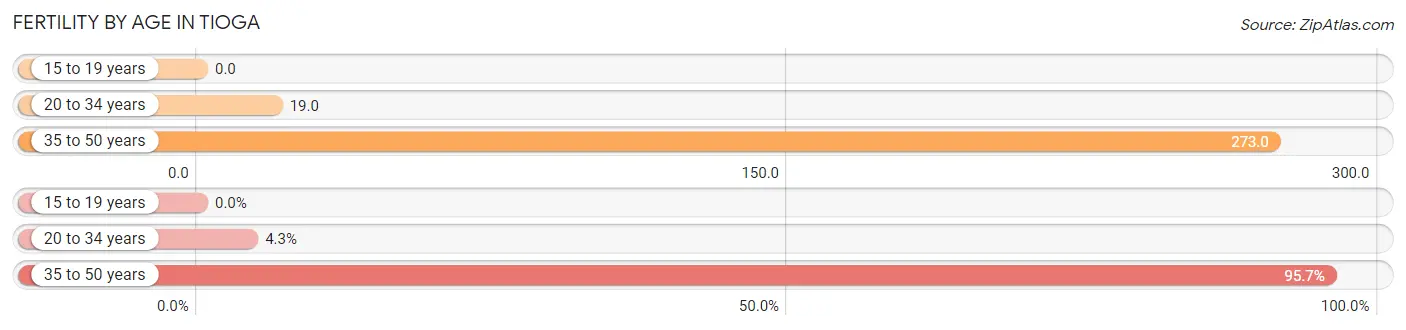
| Age Bracket | Women with Births | Births / 1,000 Women |
| 15 to 19 years | 0 (0.0%) | 0.0 |
| 20 to 34 years | 2 (4.3%) | 19.0 |
| 35 to 50 years | 45 (95.7%) | 273.0 |
| Total | 47 (100.0%) | 153.0 |
Fertility by Age by Marriage Status in Tioga
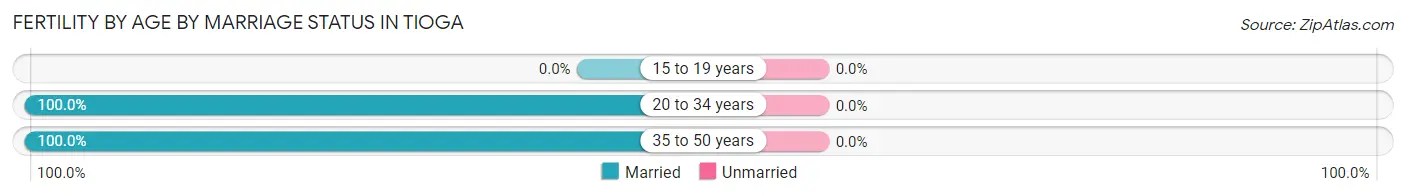
| Age Bracket | Married | Unmarried |
| 15 to 19 years | 0 (0.0%) | 0 (0.0%) |
| 20 to 34 years | 2 (100.0%) | 0 (0.0%) |
| 35 to 50 years | 45 (100.0%) | 0 (0.0%) |
| Total | 47 (100.0%) | 0 (0.0%) |
Fertility by Education in Tioga
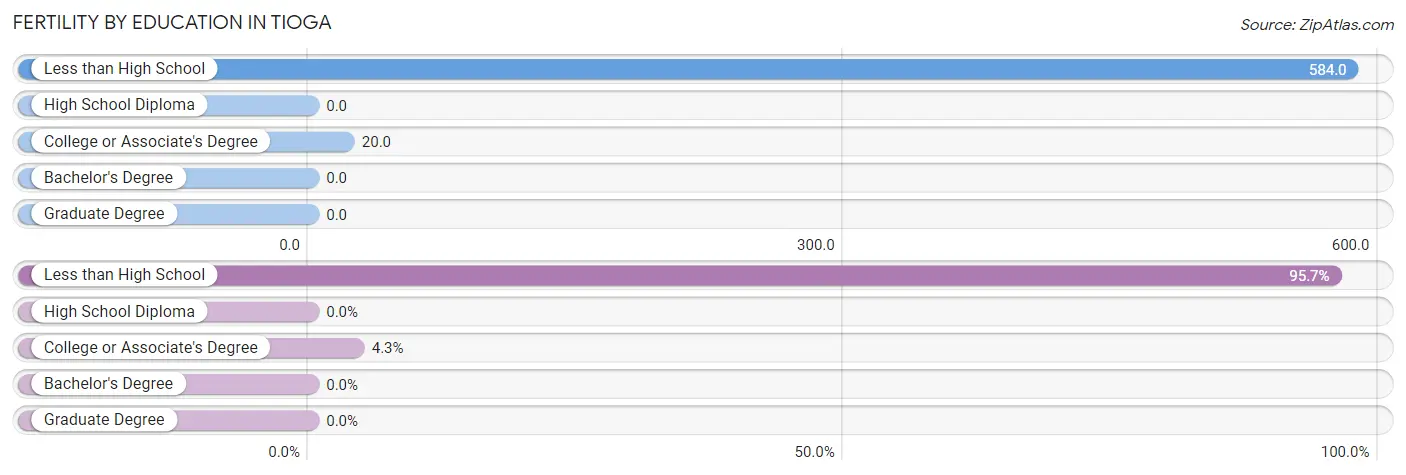
| Educational Attainment | Women with Births | Births / 1,000 Women |
| Less than High School | 45 (95.7%) | 584.0 |
| High School Diploma | 0 (0.0%) | 0.0 |
| College or Associate's Degree | 2 (4.3%) | 20.0 |
| Bachelor's Degree | 0 (0.0%) | 0.0 |
| Graduate Degree | 0 (0.0%) | 0.0 |
| Total | 47 (100.0%) | 153.0 |
Fertility by Education by Marriage Status in Tioga
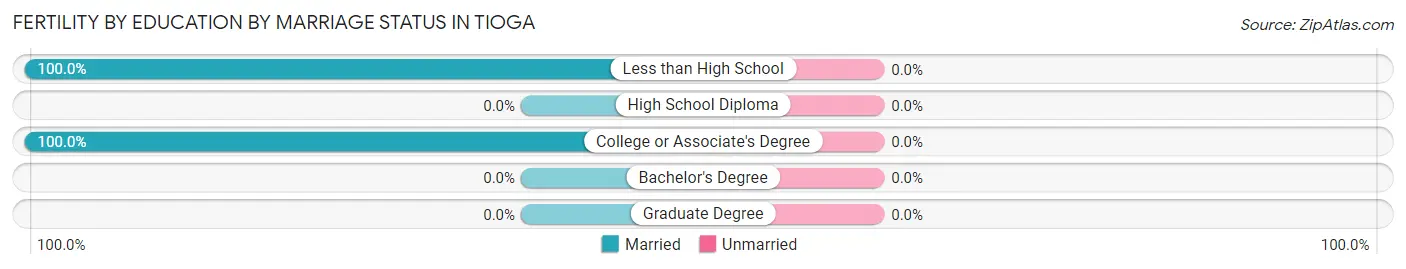
| Educational Attainment | Married | Unmarried |
| Less than High School | 45 (100.0%) | 0 (0.0%) |
| High School Diploma | 0 (0.0%) | 0 (0.0%) |
| College or Associate's Degree | 2 (100.0%) | 0 (0.0%) |
| Bachelor's Degree | 0 (0.0%) | 0 (0.0%) |
| Graduate Degree | 0 (0.0%) | 0 (0.0%) |
| Total | 47 (100.0%) | 0 (0.0%) |
Income in Tioga
Income Overview in Tioga
Per Capita Income in Tioga is $40,409, while median incomes of families and households are $98,819 and $63,920 respectively.
| Characteristic | Number | Measure |
| Per Capita Income | 1,376 | $40,409 |
| Median Family Income | 333 | $98,819 |
| Mean Family Income | 333 | $101,588 |
| Median Household Income | 688 | $63,920 |
| Mean Household Income | 688 | $79,828 |
| Income Deficit | 333 | $0 |
| Wage / Income Gap (%) | 1,376 | 48.79% |
| Wage / Income Gap ($) | 1,376 | 51.21¢ per $1 |
| Gini / Inequality Index | 1,376 | 0.40 |
Earnings by Sex in Tioga
Average Earnings in Tioga are $46,563, $56,389 for men and $28,877 for women, a difference of 48.8%.
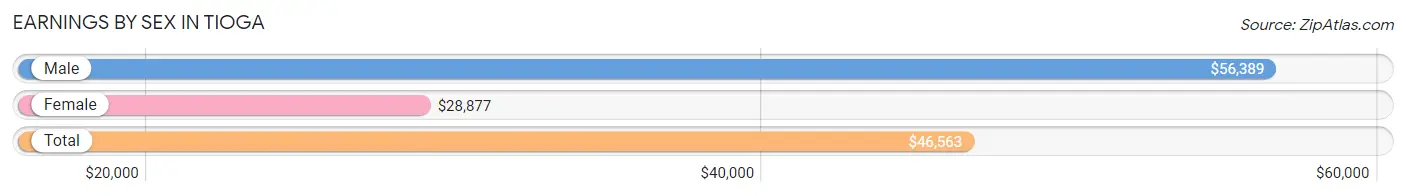
| Sex | Number | Average Earnings |
| Male | 430 (53.4%) | $56,389 |
| Female | 375 (46.6%) | $28,877 |
| Total | 805 (100.0%) | $46,563 |
Earnings by Sex by Income Bracket in Tioga
The most common earnings brackets in Tioga are $100,000+ for men (95 | 22.1%) and $55,000 to $64,999 for women (94 | 25.1%).
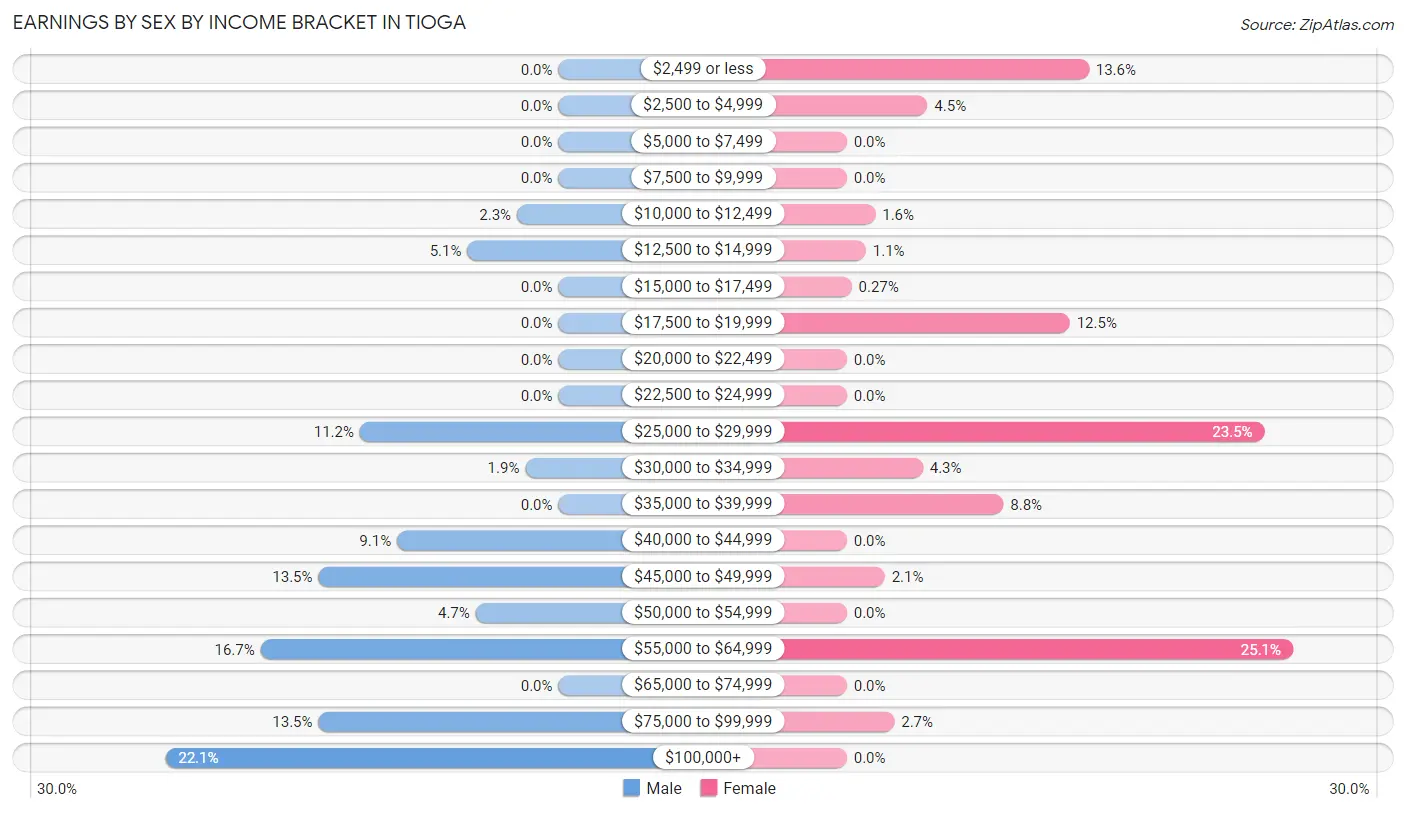
| Income | Male | Female |
| $2,499 or less | 0 (0.0%) | 51 (13.6%) |
| $2,500 to $4,999 | 0 (0.0%) | 17 (4.5%) |
| $5,000 to $7,499 | 0 (0.0%) | 0 (0.0%) |
| $7,500 to $9,999 | 0 (0.0%) | 0 (0.0%) |
| $10,000 to $12,499 | 10 (2.3%) | 6 (1.6%) |
| $12,500 to $14,999 | 22 (5.1%) | 4 (1.1%) |
| $15,000 to $17,499 | 0 (0.0%) | 1 (0.3%) |
| $17,500 to $19,999 | 0 (0.0%) | 47 (12.5%) |
| $20,000 to $22,499 | 0 (0.0%) | 0 (0.0%) |
| $22,500 to $24,999 | 0 (0.0%) | 0 (0.0%) |
| $25,000 to $29,999 | 48 (11.2%) | 88 (23.5%) |
| $30,000 to $34,999 | 8 (1.9%) | 16 (4.3%) |
| $35,000 to $39,999 | 0 (0.0%) | 33 (8.8%) |
| $40,000 to $44,999 | 39 (9.1%) | 0 (0.0%) |
| $45,000 to $49,999 | 58 (13.5%) | 8 (2.1%) |
| $50,000 to $54,999 | 20 (4.6%) | 0 (0.0%) |
| $55,000 to $64,999 | 72 (16.7%) | 94 (25.1%) |
| $65,000 to $74,999 | 0 (0.0%) | 0 (0.0%) |
| $75,000 to $99,999 | 58 (13.5%) | 10 (2.7%) |
| $100,000+ | 95 (22.1%) | 0 (0.0%) |
| Total | 430 (100.0%) | 375 (100.0%) |
Earnings by Sex by Educational Attainment in Tioga
Average earnings in Tioga are $58,836 for men and $29,682 for women, a difference of 49.5%. Men with an educational attainment of college or associate's degree enjoy the highest average annual earnings of $57,672, while those with college or associate's degree education earn the least with $57,672. Women with an educational attainment of college or associate's degree earn the most with the average annual earnings of $39,554, while those with bachelor's degree education have the smallest earnings of $28,983.
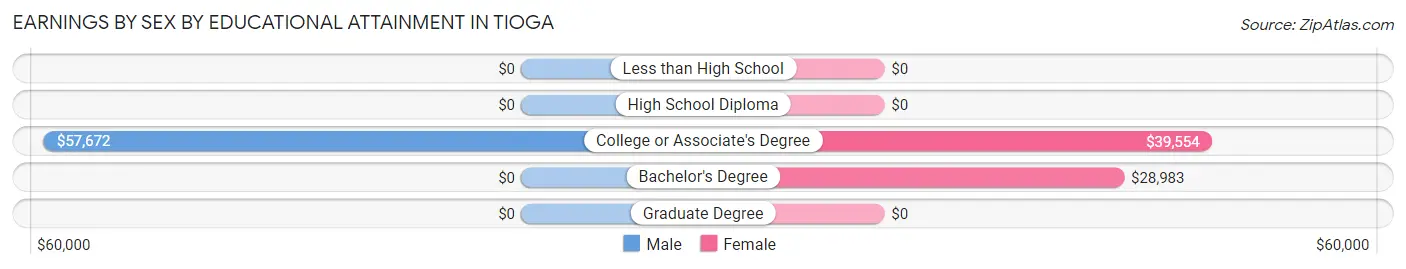
| Educational Attainment | Male Income | Female Income |
| Less than High School | - | - |
| High School Diploma | - | - |
| College or Associate's Degree | $57,672 | $39,554 |
| Bachelor's Degree | - | - |
| Graduate Degree | - | - |
| Total | $58,836 | $29,682 |
Family Income in Tioga
Family Income Brackets in Tioga
According to the Tioga family income data, there are 104 families falling into the $100,000 to $149,999 income range, which is the most common income bracket and makes up 31.2% of all families.
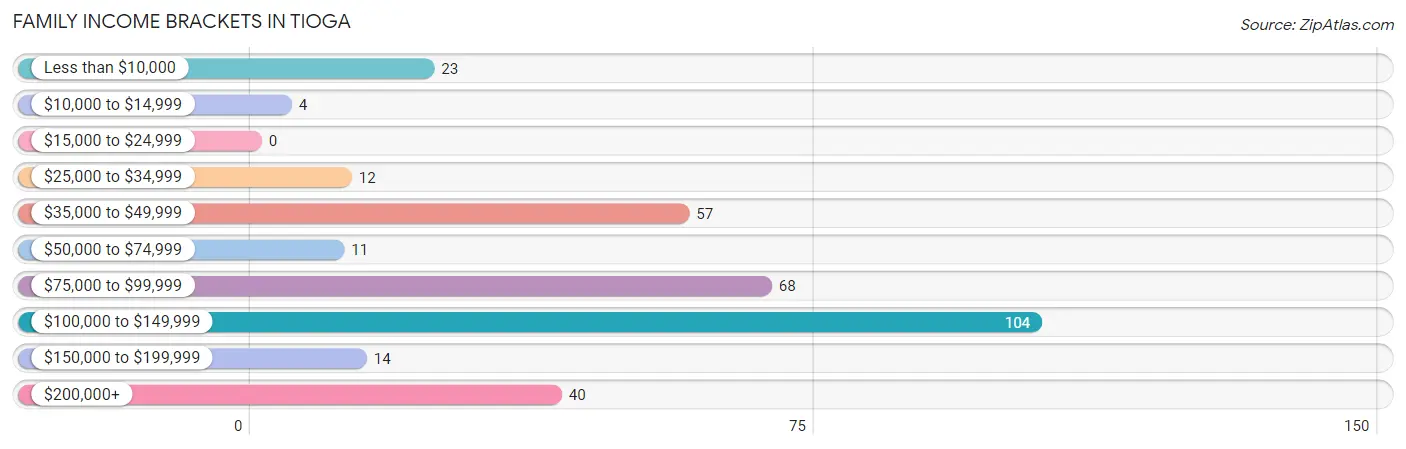
| Income Bracket | # Families | % Families |
| Less than $10,000 | 23 | 6.9% |
| $10,000 to $14,999 | 4 | 1.2% |
| $15,000 to $24,999 | 0 | 0.0% |
| $25,000 to $34,999 | 12 | 3.6% |
| $35,000 to $49,999 | 57 | 17.1% |
| $50,000 to $74,999 | 11 | 3.3% |
| $75,000 to $99,999 | 68 | 20.4% |
| $100,000 to $149,999 | 104 | 31.2% |
| $150,000 to $199,999 | 14 | 4.2% |
| $200,000+ | 40 | 12.0% |
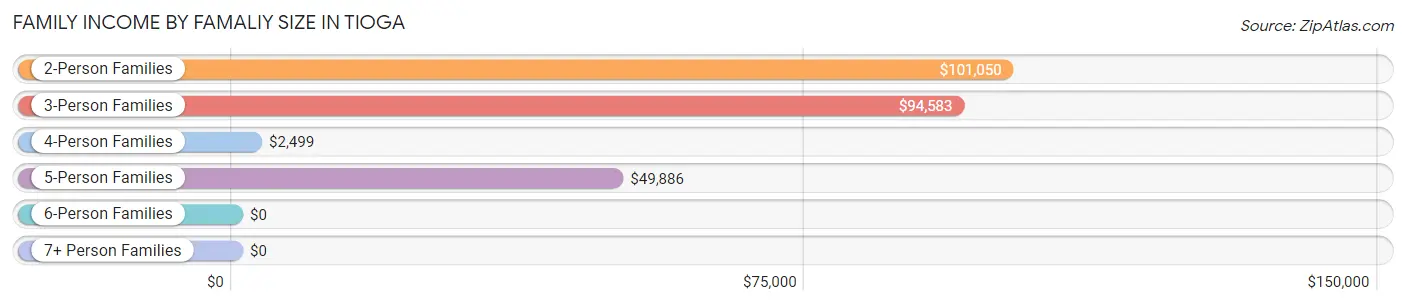
Family Income by Famaliy Size in Tioga
2-person families (181 | 54.3%) account for the highest median family income in Tioga with $101,050 per family, while 2-person families (181 | 54.3%) have the highest median income of $50,525 per family member.
| Income Bracket | # Families | Median Income |
| 2-Person Families | 181 (54.3%) | $101,050 |
| 3-Person Families | 99 (29.7%) | $94,583 |
| 4-Person Families | 32 (9.6%) | $2,499 |
| 5-Person Families | 21 (6.3%) | $49,886 |
| 6-Person Families | 0 (0.0%) | $0 |
| 7+ Person Families | 0 (0.0%) | $0 |
| Total | 333 (100.0%) | $98,819 |
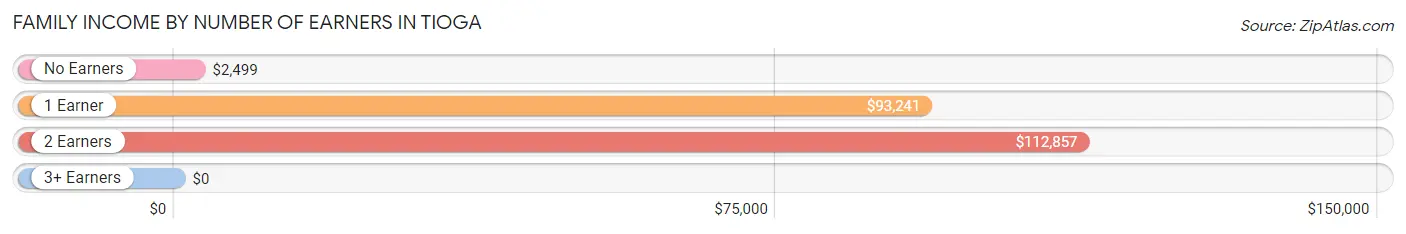
Family Income by Number of Earners in Tioga
| Number of Earners | # Families | Median Income |
| No Earners | 32 (9.6%) | $2,499 |
| 1 Earner | 138 (41.4%) | $93,241 |
| 2 Earners | 138 (41.4%) | $112,857 |
| 3+ Earners | 25 (7.5%) | $0 |
| Total | 333 (100.0%) | $98,819 |
Household Income in Tioga
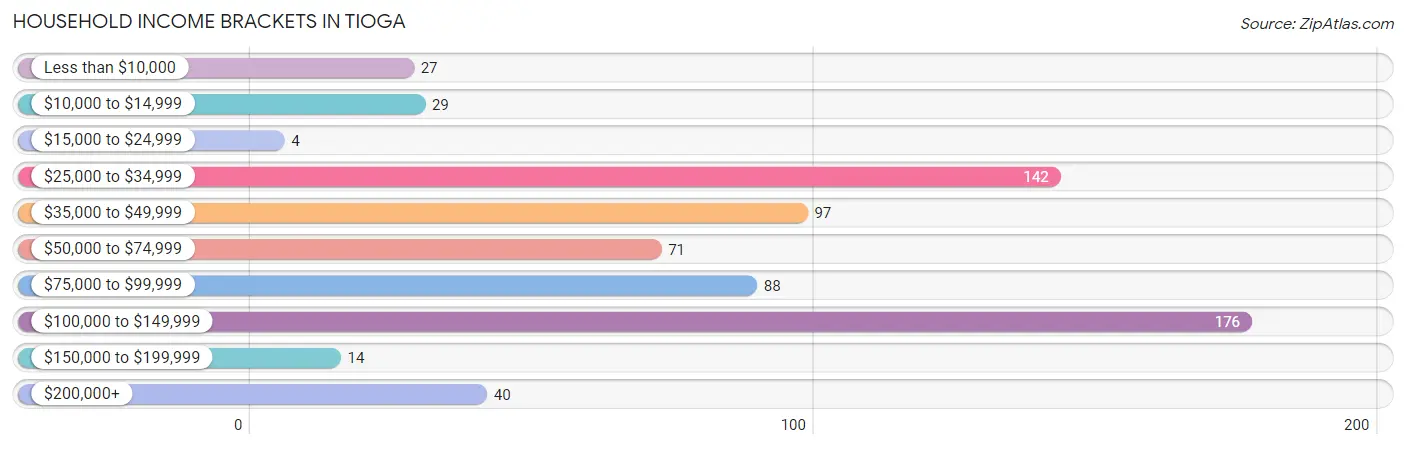
Household Income Brackets in Tioga
With 176 households falling in the category, the $100,000 to $149,999 income range is the most frequent in Tioga, accounting for 25.6% of all households. In contrast, only 4 households (0.6%) fall into the $15,000 to $24,999 income bracket, making it the least populous group.
| Income Bracket | # Households | % Households |
| Less than $10,000 | 27 | 3.9% |
| $10,000 to $14,999 | 29 | 4.2% |
| $15,000 to $24,999 | 4 | 0.6% |
| $25,000 to $34,999 | 142 | 20.6% |
| $35,000 to $49,999 | 97 | 14.1% |
| $50,000 to $74,999 | 71 | 10.3% |
| $75,000 to $99,999 | 88 | 12.8% |
| $100,000 to $149,999 | 176 | 25.6% |
| $150,000 to $199,999 | 14 | 2.0% |
| $200,000+ | 40 | 5.8% |
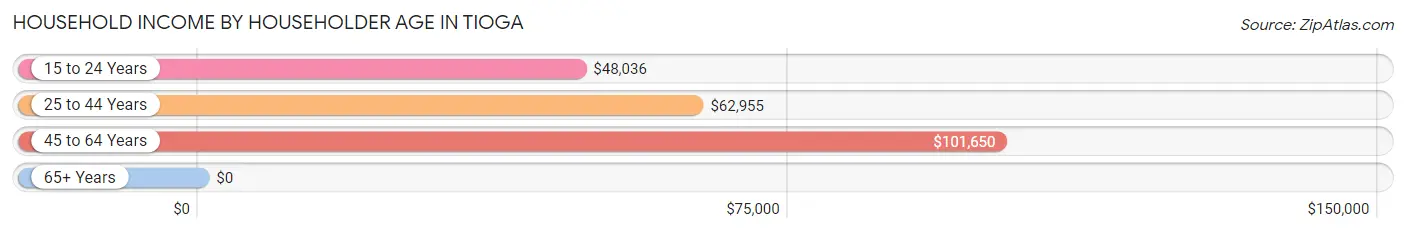
Household Income by Householder Age in Tioga
The median household income in Tioga is $63,920, with the highest median household income of $101,650 found in the 45 to 64 years age bracket for the primary householder. A total of 233 households (33.9%) fall into this category. Meanwhile, the 65+ years age bracket for the primary householder has the lowest median household income of $0, with 130 households (18.9%) in this group.
| Income Bracket | # Households | Median Income |
| 15 to 24 Years | 43 (6.2%) | $48,036 |
| 25 to 44 Years | 282 (41.0%) | $62,955 |
| 45 to 64 Years | 233 (33.9%) | $101,650 |
| 65+ Years | 130 (18.9%) | $0 |
| Total | 688 (100.0%) | $63,920 |
Poverty in Tioga
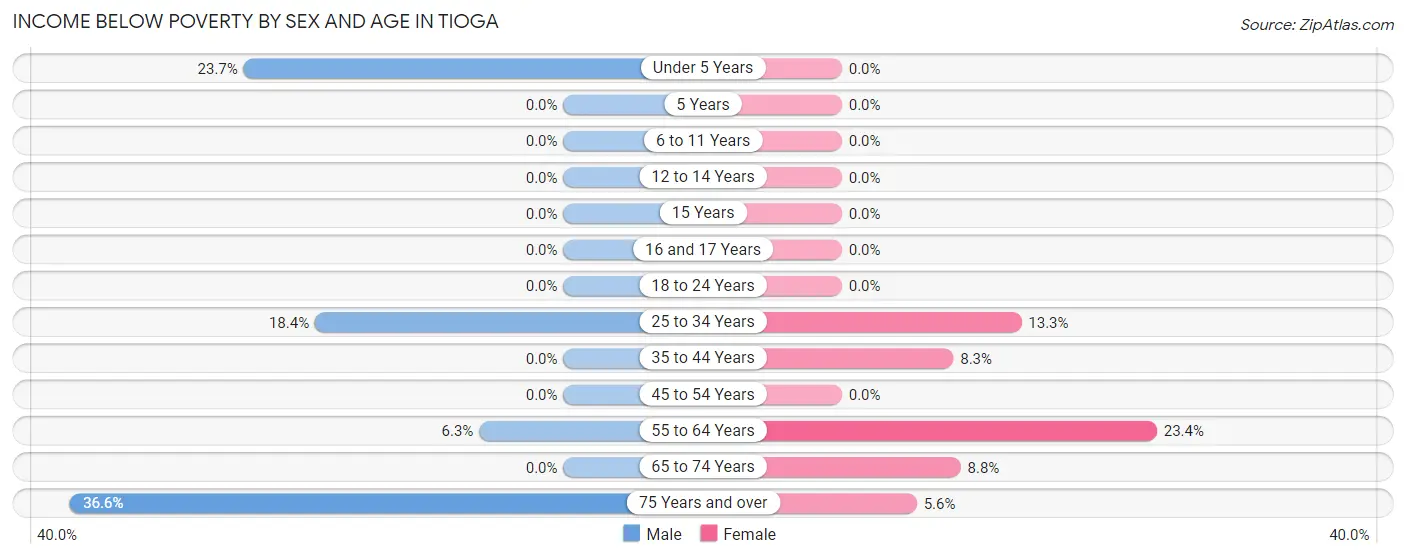
Income Below Poverty by Sex and Age in Tioga
With 11.8% poverty level for males and 10.1% for females among the residents of Tioga, 75 year old and over males and 55 to 64 year old females are the most vulnerable to poverty, with 26 males (36.6%) and 29 females (23.4%) in their respective age groups living below the poverty level.
| Age Bracket | Male | Female |
| Under 5 Years | 33 (23.7%) | 0 (0.0%) |
| 5 Years | 0 (0.0%) | 0 (0.0%) |
| 6 to 11 Years | 0 (0.0%) | 0 (0.0%) |
| 12 to 14 Years | 0 (0.0%) | 0 (0.0%) |
| 15 Years | 0 (0.0%) | 0 (0.0%) |
| 16 and 17 Years | 0 (0.0%) | 0 (0.0%) |
| 18 to 24 Years | 0 (0.0%) | 0 (0.0%) |
| 25 to 34 Years | 26 (18.4%) | 14 (13.3%) |
| 35 to 44 Years | 0 (0.0%) | 12 (8.3%) |
| 45 to 54 Years | 0 (0.0%) | 0 (0.0%) |
| 55 to 64 Years | 3 (6.2%) | 29 (23.4%) |
| 65 to 74 Years | 0 (0.0%) | 3 (8.8%) |
| 75 Years and over | 26 (36.6%) | 3 (5.6%) |
| Total | 88 (11.8%) | 61 (10.1%) |
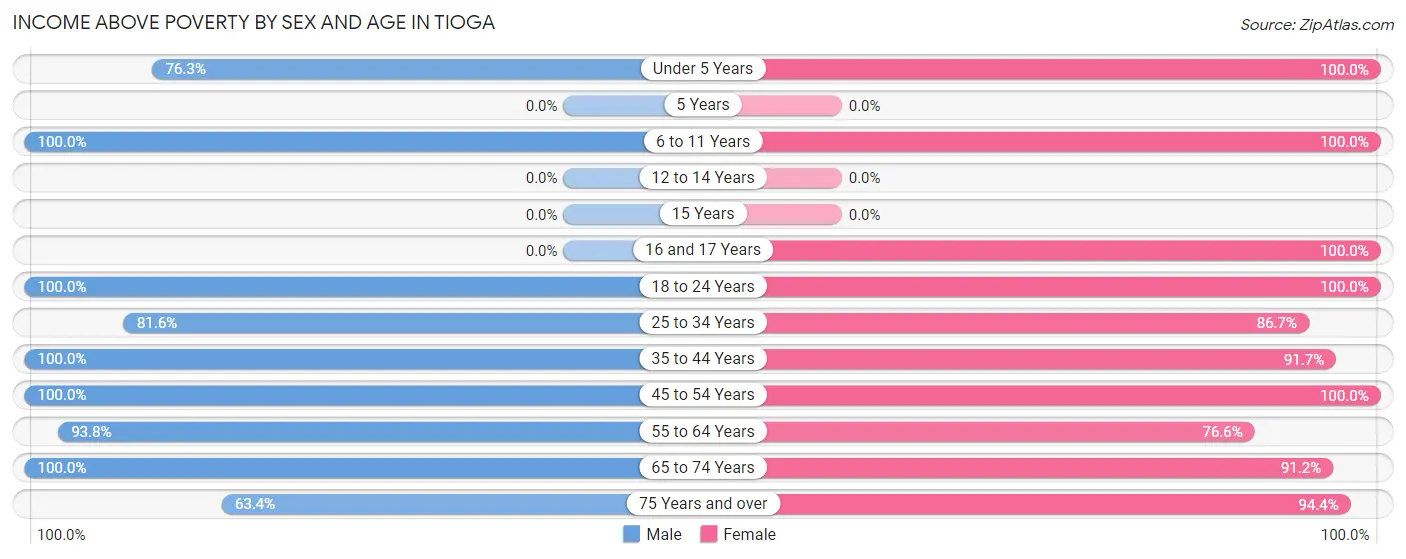
Income Above Poverty by Sex and Age in Tioga
According to the poverty statistics in Tioga, males aged 6 to 11 years and females aged under 5 years are the age groups that are most secure financially, with 100.0% of males and 100.0% of females in these age groups living above the poverty line.
| Age Bracket | Male | Female |
| Under 5 Years | 106 (76.3%) | 30 (100.0%) |
| 5 Years | 0 (0.0%) | 0 (0.0%) |
| 6 to 11 Years | 15 (100.0%) | 21 (100.0%) |
| 12 to 14 Years | 0 (0.0%) | 0 (0.0%) |
| 15 Years | 0 (0.0%) | 0 (0.0%) |
| 16 and 17 Years | 0 (0.0%) | 32 (100.0%) |
| 18 to 24 Years | 78 (100.0%) | 6 (100.0%) |
| 25 to 34 Years | 115 (81.6%) | 91 (86.7%) |
| 35 to 44 Years | 76 (100.0%) | 133 (91.7%) |
| 45 to 54 Years | 109 (100.0%) | 51 (100.0%) |
| 55 to 64 Years | 45 (93.8%) | 95 (76.6%) |
| 65 to 74 Years | 67 (100.0%) | 31 (91.2%) |
| 75 Years and over | 45 (63.4%) | 51 (94.4%) |
| Total | 656 (88.2%) | 541 (89.9%) |
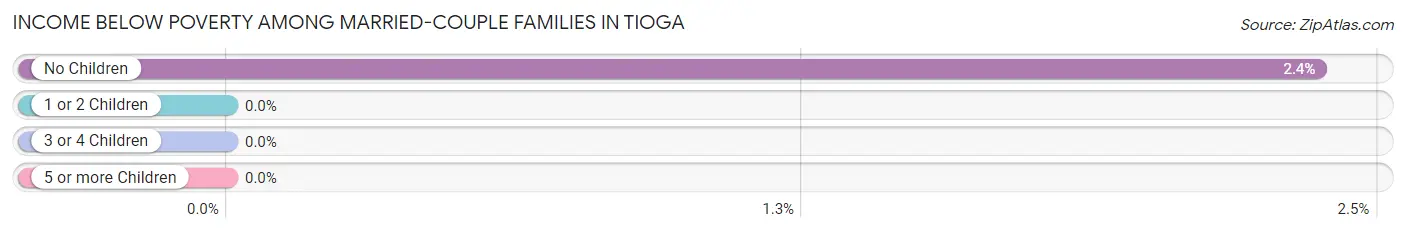
Income Below Poverty Among Married-Couple Families in Tioga
The poverty statistics for married-couple families in Tioga show that 1.7% or 4 of the total 233 families live below the poverty line. Families with no children have the highest poverty rate of 2.4%, comprising of 4 families. On the other hand, families with 1 or 2 children have the lowest poverty rate of 0.0%, which includes 0 families.
| Children | Above Poverty | Below Poverty |
| No Children | 165 (97.6%) | 4 (2.4%) |
| 1 or 2 Children | 43 (100.0%) | 0 (0.0%) |
| 3 or 4 Children | 21 (100.0%) | 0 (0.0%) |
| 5 or more Children | 0 (0.0%) | 0 (0.0%) |
| Total | 229 (98.3%) | 4 (1.7%) |
Income Below Poverty Among Single-Parent Households in Tioga
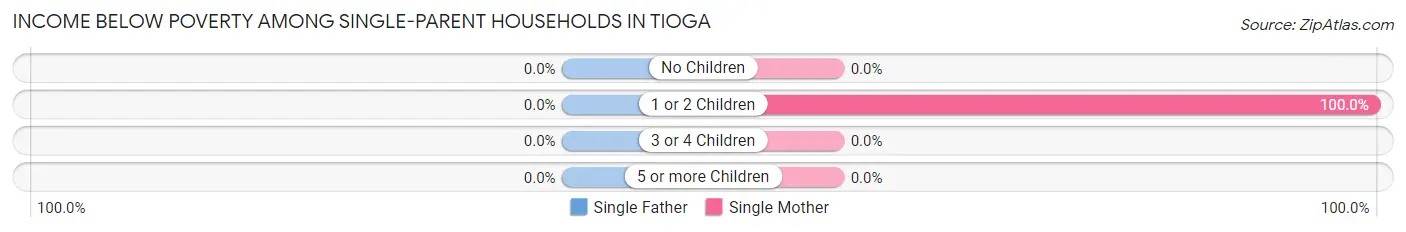
| Children | Single Father | Single Mother |
| No Children | 0 (0.0%) | 0 (0.0%) |
| 1 or 2 Children | 0 (0.0%) | 23 (100.0%) |
| 3 or 4 Children | 0 (0.0%) | 0 (0.0%) |
| 5 or more Children | 0 (0.0%) | 0 (0.0%) |
| Total | 0 (0.0%) | 23 (48.9%) |
Income Below Poverty Among Married-Couple vs Single-Parent Households in Tioga
The poverty data for Tioga shows that 4 of the married-couple family households (1.7%) and 23 of the single-parent households (23.0%) are living below the poverty level. Within the married-couple family households, those with no children have the highest poverty rate, with 4 households (2.4%) falling below the poverty line. Among the single-parent households, those with 1 or 2 children have the highest poverty rate, with 23 household (41.1%) living below poverty.
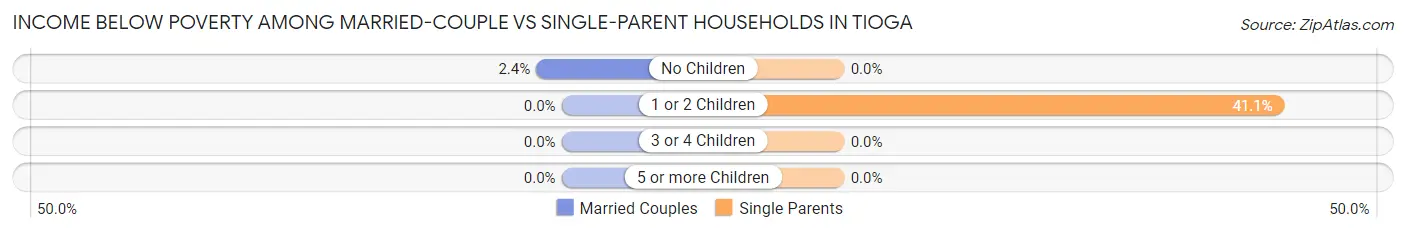
| Children | Married-Couple Families | Single-Parent Households |
| No Children | 4 (2.4%) | 0 (0.0%) |
| 1 or 2 Children | 0 (0.0%) | 23 (41.1%) |
| 3 or 4 Children | 0 (0.0%) | 0 (0.0%) |
| 5 or more Children | 0 (0.0%) | 0 (0.0%) |
| Total | 4 (1.7%) | 23 (23.0%) |
Employment Characteristics in Tioga
Employment by Class of Employer in Tioga
Among the 661 employed individuals in Tioga, private company employees (434 | 65.7%), not-for-profit organizations (119 | 18.0%), and state government employees (59 | 8.9%) make up the most common classes of employment.
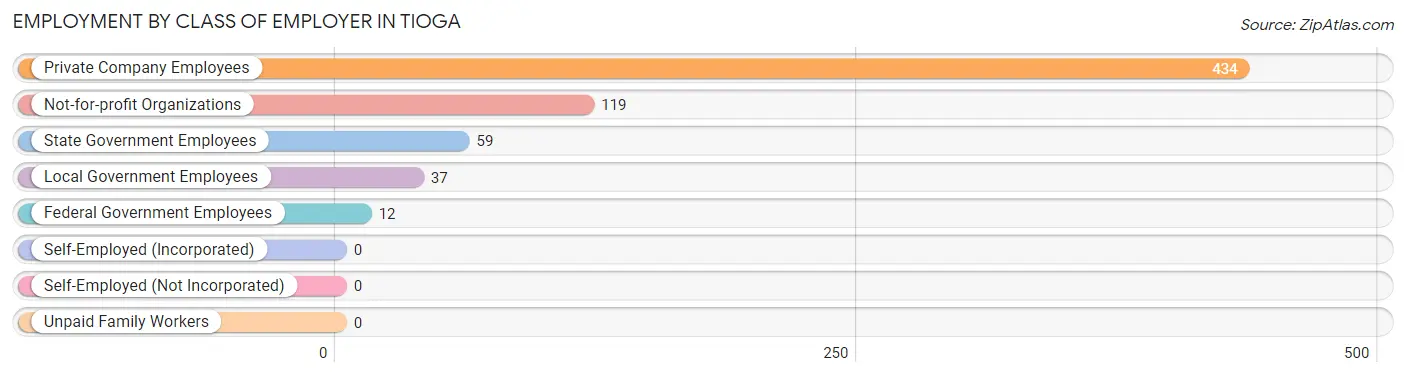
| Employer Class | # Employees | % Employees |
| Private Company Employees | 434 | 65.7% |
| Self-Employed (Incorporated) | 0 | 0.0% |
| Self-Employed (Not Incorporated) | 0 | 0.0% |
| Not-for-profit Organizations | 119 | 18.0% |
| Local Government Employees | 37 | 5.6% |
| State Government Employees | 59 | 8.9% |
| Federal Government Employees | 12 | 1.8% |
| Unpaid Family Workers | 0 | 0.0% |
| Total | 661 | 100.0% |
Employment Status by Age in Tioga
According to the labor force statistics for Tioga, out of the total population over 16 years of age (1,171), 61.3% or 718 individuals are in the labor force, with 4.9% or 35 of them unemployed. The age group with the highest labor force participation rate is 20 to 24 years, with 100.0% or 71 individuals in the labor force. Within the labor force, the 20 to 24 years age range has the highest percentage of unemployed individuals, with 39.4% or 28 of them being unemployed.
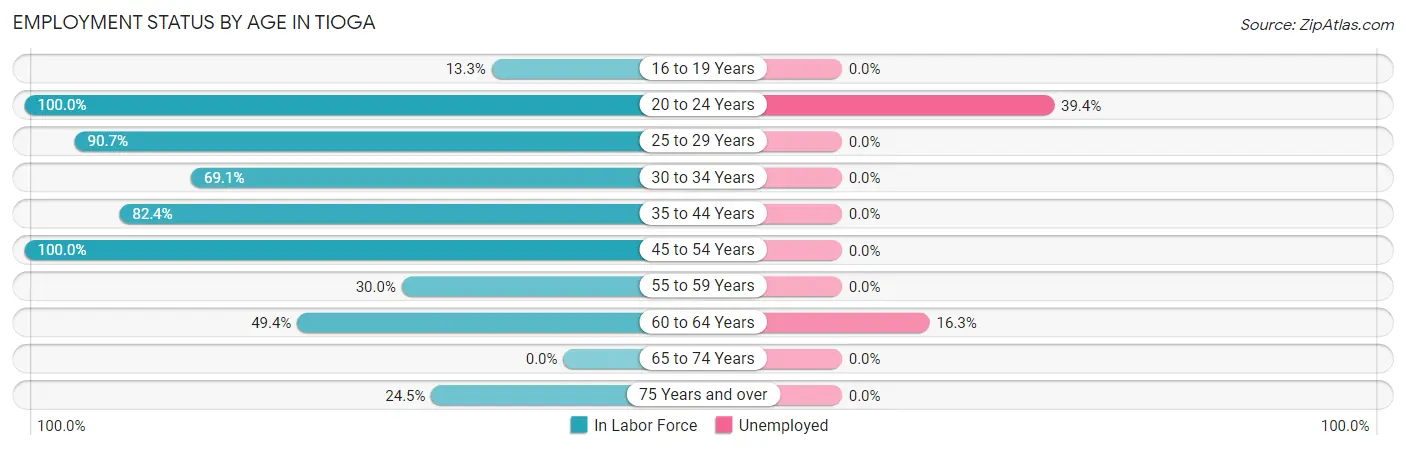
| Age Bracket | In Labor Force | Unemployed |
| 16 to 19 Years | 6 (13.3%) | 0 (0.0%) |
| 20 to 24 Years | 71 (100.0%) | 28 (39.4%) |
| 25 to 29 Years | 97 (90.7%) | 0 (0.0%) |
| 30 to 34 Years | 96 (69.1%) | 0 (0.0%) |
| 35 to 44 Years | 182 (82.4%) | 0 (0.0%) |
| 45 to 54 Years | 160 (100.0%) | 0 (0.0%) |
| 55 to 59 Years | 27 (30.0%) | 0 (0.0%) |
| 60 to 64 Years | 43 (49.4%) | 7 (16.3%) |
| 65 to 74 Years | 0 (0.0%) | 0 (0.0%) |
| 75 Years and over | 36 (24.5%) | 0 (0.0%) |
| Total | 718 (61.3%) | 35 (4.9%) |
Employment Status by Educational Attainment in Tioga
According to labor force statistics for Tioga, 75.2% of individuals (605) out of the total population between 25 and 64 years of age (804) are in the labor force, with 1.2% or 7 of them being unemployed. The group with the highest labor force participation rate are those with the educational attainment of college / associate degree, with 80.3% or 220 individuals in the labor force. Within the labor force, individuals with college / associate degree education have the highest percentage of unemployment, with 3.2% or 7 of them being unemployed.
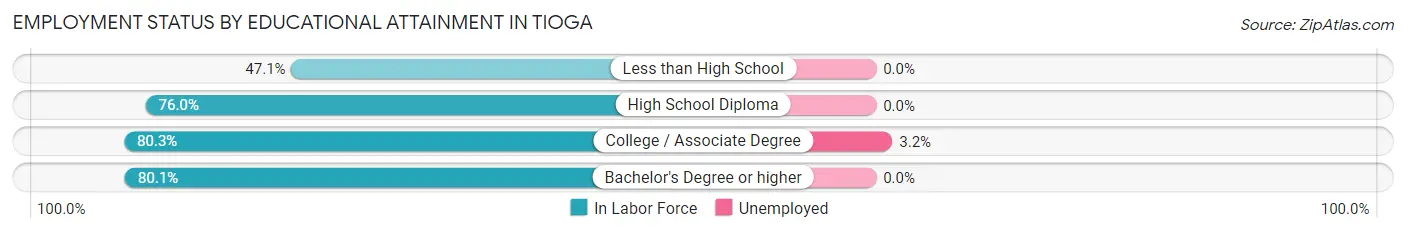
| Educational Attainment | In Labor Force | Unemployed |
| Less than High School | 41 (47.1%) | 0 (0.0%) |
| High School Diploma | 203 (76.0%) | 0 (0.0%) |
| College / Associate Degree | 220 (80.3%) | 9 (3.2%) |
| Bachelor's Degree or higher | 141 (80.1%) | 0 (0.0%) |
| Total | 605 (75.2%) | 10 (1.2%) |
Employment Occupations by Sex in Tioga
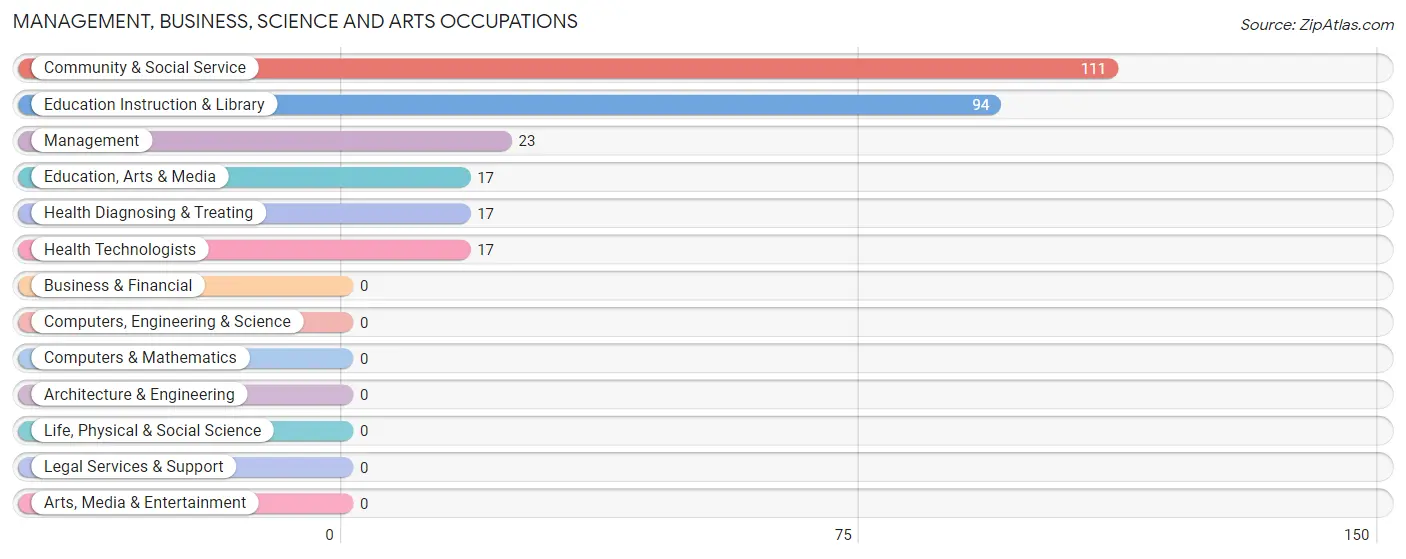
Management, Business, Science and Arts Occupations
The most common Management, Business, Science and Arts occupations in Tioga are Community & Social Service (111 | 16.3%), Education Instruction & Library (94 | 13.8%), Management (23 | 3.4%), Education, Arts & Media (17 | 2.5%), and Health Diagnosing & Treating (17 | 2.5%).
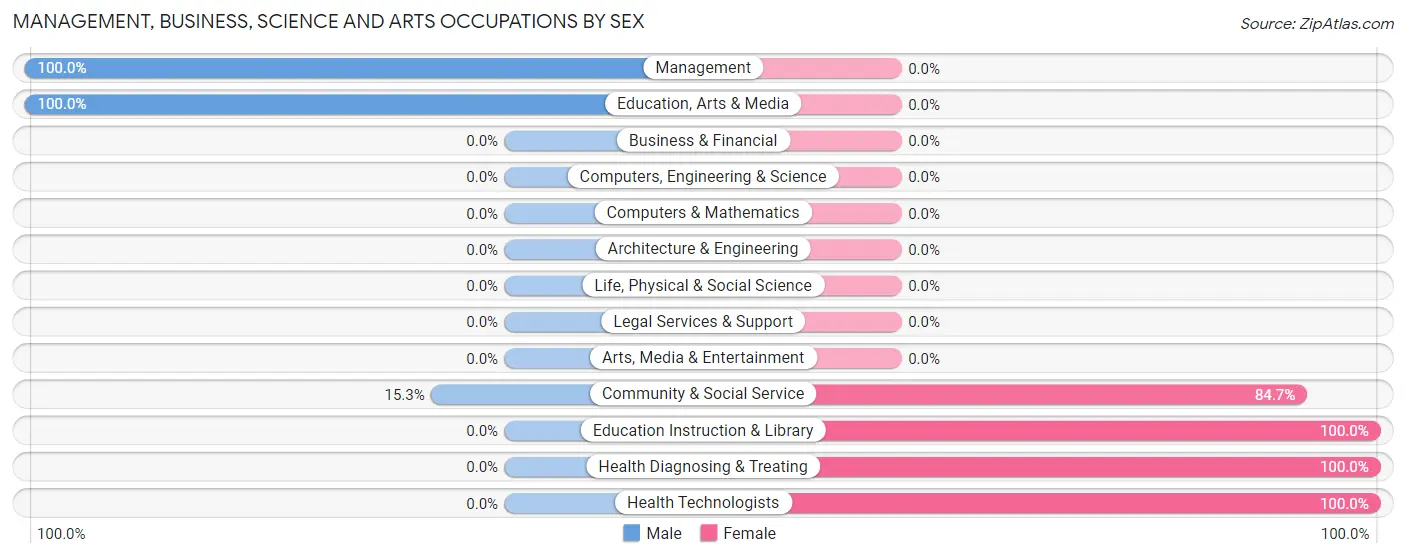
Management, Business, Science and Arts Occupations by Sex
Within the Management, Business, Science and Arts occupations in Tioga, the most male-oriented occupations are Management (100.0%), Education, Arts & Media (100.0%), and Community & Social Service (15.3%), while the most female-oriented occupations are Education Instruction & Library (100.0%), Health Diagnosing & Treating (100.0%), and Health Technologists (100.0%).
| Occupation | Male | Female |
| Management | 23 (100.0%) | 0 (0.0%) |
| Business & Financial | 0 (0.0%) | 0 (0.0%) |
| Computers, Engineering & Science | 0 (0.0%) | 0 (0.0%) |
| Computers & Mathematics | 0 (0.0%) | 0 (0.0%) |
| Architecture & Engineering | 0 (0.0%) | 0 (0.0%) |
| Life, Physical & Social Science | 0 (0.0%) | 0 (0.0%) |
| Community & Social Service | 17 (15.3%) | 94 (84.7%) |
| Education, Arts & Media | 17 (100.0%) | 0 (0.0%) |
| Legal Services & Support | 0 (0.0%) | 0 (0.0%) |
| Education Instruction & Library | 0 (0.0%) | 94 (100.0%) |
| Arts, Media & Entertainment | 0 (0.0%) | 0 (0.0%) |
| Health Diagnosing & Treating | 0 (0.0%) | 17 (100.0%) |
| Health Technologists | 0 (0.0%) | 17 (100.0%) |
| Total (Category) | 40 (26.5%) | 111 (73.5%) |
| Total (Overall) | 374 (54.8%) | 309 (45.2%) |
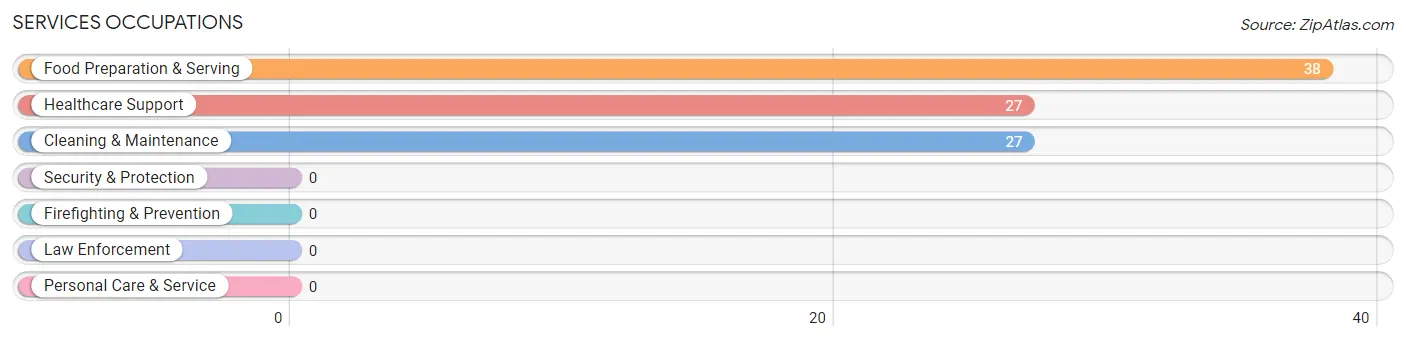
Services Occupations
The most common Services occupations in Tioga are Food Preparation & Serving (38 | 5.6%), Healthcare Support (27 | 4.0%), and Cleaning & Maintenance (27 | 4.0%).
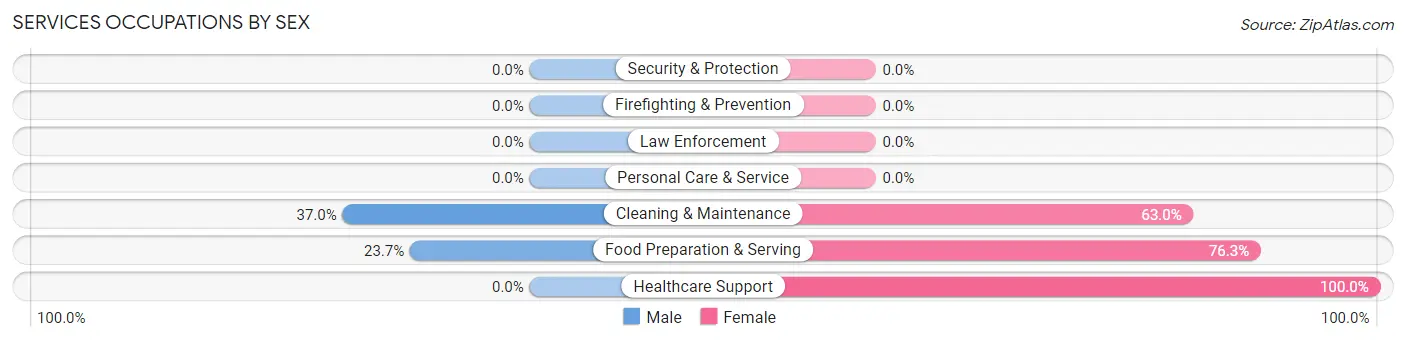
Services Occupations by Sex
Within the Services occupations in Tioga, the most male-oriented occupations are Cleaning & Maintenance (37.0%), and Food Preparation & Serving (23.7%), while the most female-oriented occupations are Healthcare Support (100.0%), Food Preparation & Serving (76.3%), and Cleaning & Maintenance (63.0%).
| Occupation | Male | Female |
| Healthcare Support | 0 (0.0%) | 27 (100.0%) |
| Security & Protection | 0 (0.0%) | 0 (0.0%) |
| Firefighting & Prevention | 0 (0.0%) | 0 (0.0%) |
| Law Enforcement | 0 (0.0%) | 0 (0.0%) |
| Food Preparation & Serving | 9 (23.7%) | 29 (76.3%) |
| Cleaning & Maintenance | 10 (37.0%) | 17 (63.0%) |
| Personal Care & Service | 0 (0.0%) | 0 (0.0%) |
| Total (Category) | 19 (20.6%) | 73 (79.3%) |
| Total (Overall) | 374 (54.8%) | 309 (45.2%) |
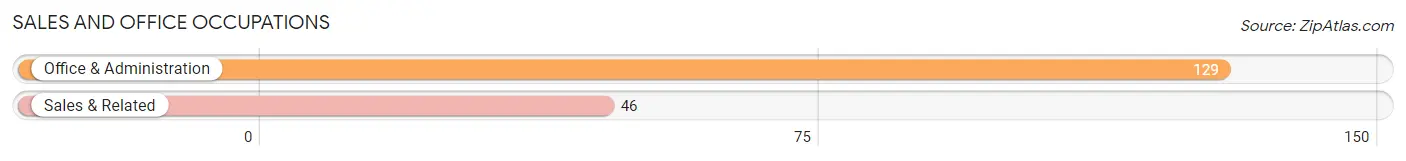
Sales and Office Occupations
The most common Sales and Office occupations in Tioga are Office & Administration (129 | 18.9%), and Sales & Related (46 | 6.7%).
Sales and Office Occupations by Sex
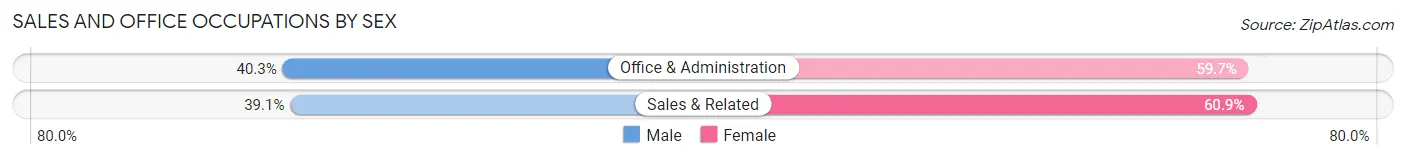
| Occupation | Male | Female |
| Sales & Related | 18 (39.1%) | 28 (60.9%) |
| Office & Administration | 52 (40.3%) | 77 (59.7%) |
| Total (Category) | 70 (40.0%) | 105 (60.0%) |
| Total (Overall) | 374 (54.8%) | 309 (45.2%) |
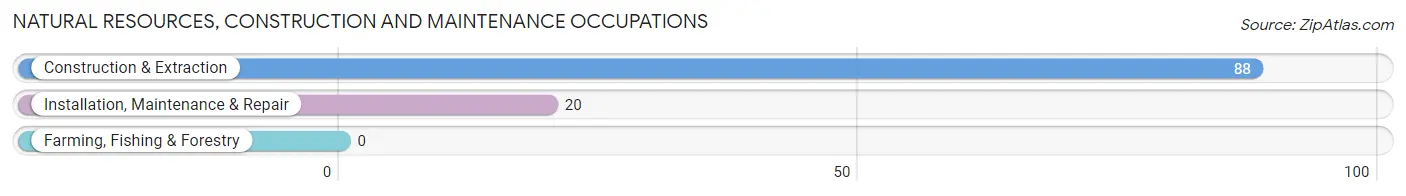
Natural Resources, Construction and Maintenance Occupations
The most common Natural Resources, Construction and Maintenance occupations in Tioga are Construction & Extraction (88 | 12.9%), and Installation, Maintenance & Repair (20 | 2.9%).
Natural Resources, Construction and Maintenance Occupations by Sex
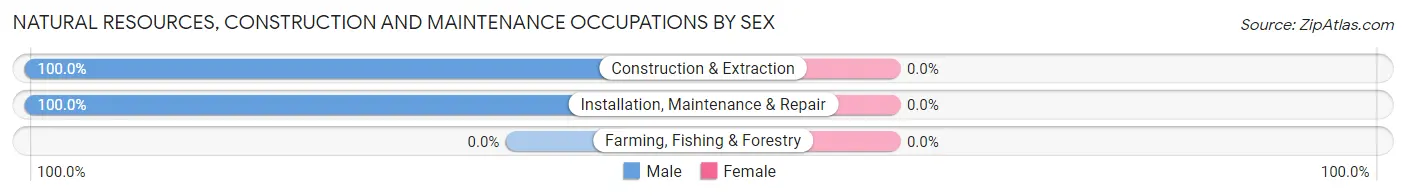
| Occupation | Male | Female |
| Farming, Fishing & Forestry | 0 (0.0%) | 0 (0.0%) |
| Construction & Extraction | 88 (100.0%) | 0 (0.0%) |
| Installation, Maintenance & Repair | 20 (100.0%) | 0 (0.0%) |
| Total (Category) | 108 (100.0%) | 0 (0.0%) |
| Total (Overall) | 374 (54.8%) | 309 (45.2%) |
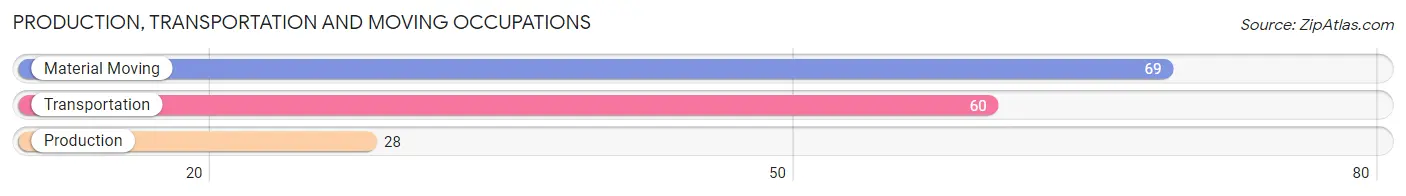
Production, Transportation and Moving Occupations
The most common Production, Transportation and Moving occupations in Tioga are Material Moving (69 | 10.1%), Transportation (60 | 8.8%), and Production (28 | 4.1%).
Production, Transportation and Moving Occupations by Sex
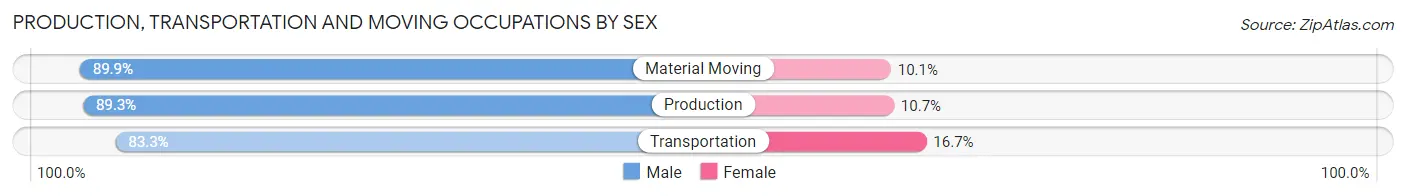
| Occupation | Male | Female |
| Production | 25 (89.3%) | 3 (10.7%) |
| Transportation | 50 (83.3%) | 10 (16.7%) |
| Material Moving | 62 (89.9%) | 7 (10.1%) |
| Total (Category) | 137 (87.3%) | 20 (12.7%) |
| Total (Overall) | 374 (54.8%) | 309 (45.2%) |
Employment Industries by Sex in Tioga
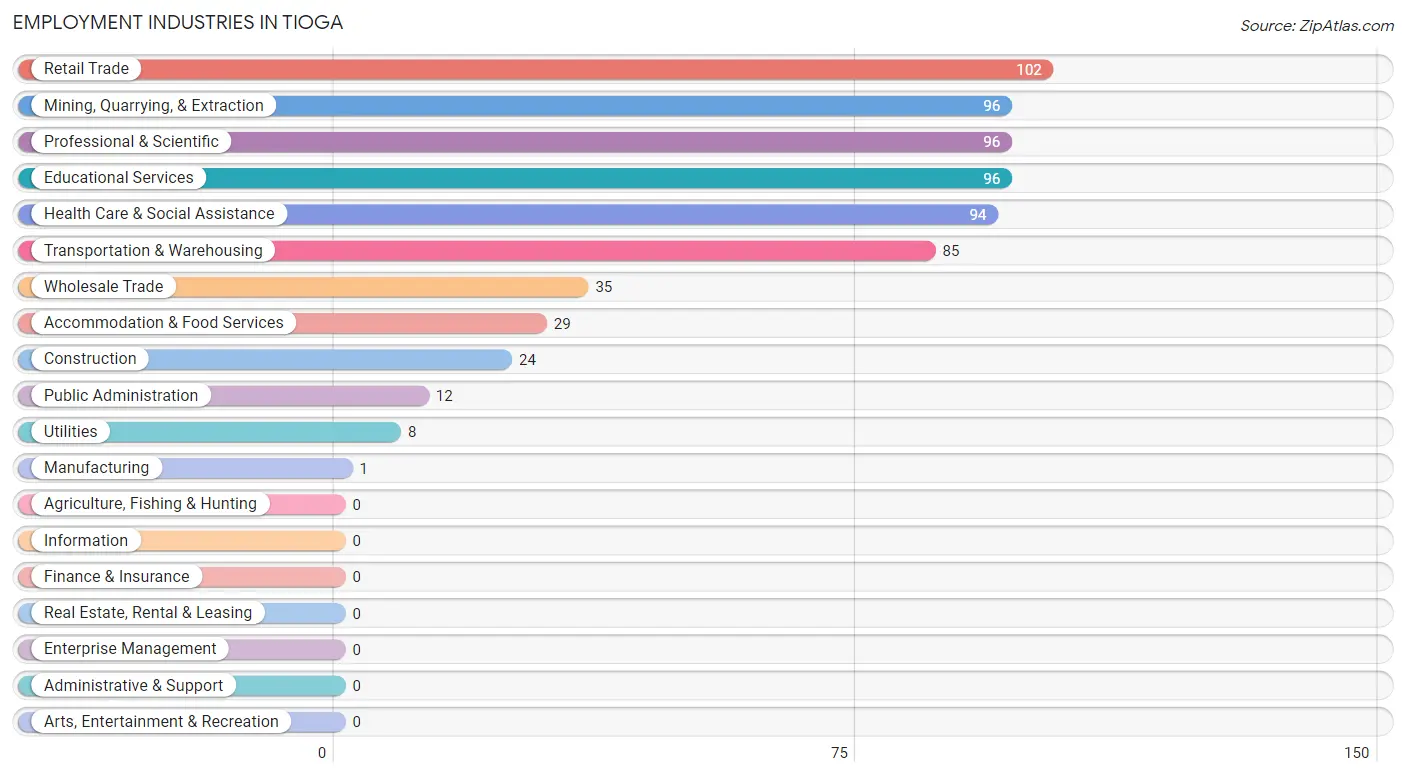
Employment Industries in Tioga
The major employment industries in Tioga include Retail Trade (102 | 14.9%), Mining, Quarrying, & Extraction (96 | 14.1%), Professional & Scientific (96 | 14.1%), Educational Services (96 | 14.1%), and Health Care & Social Assistance (94 | 13.8%).
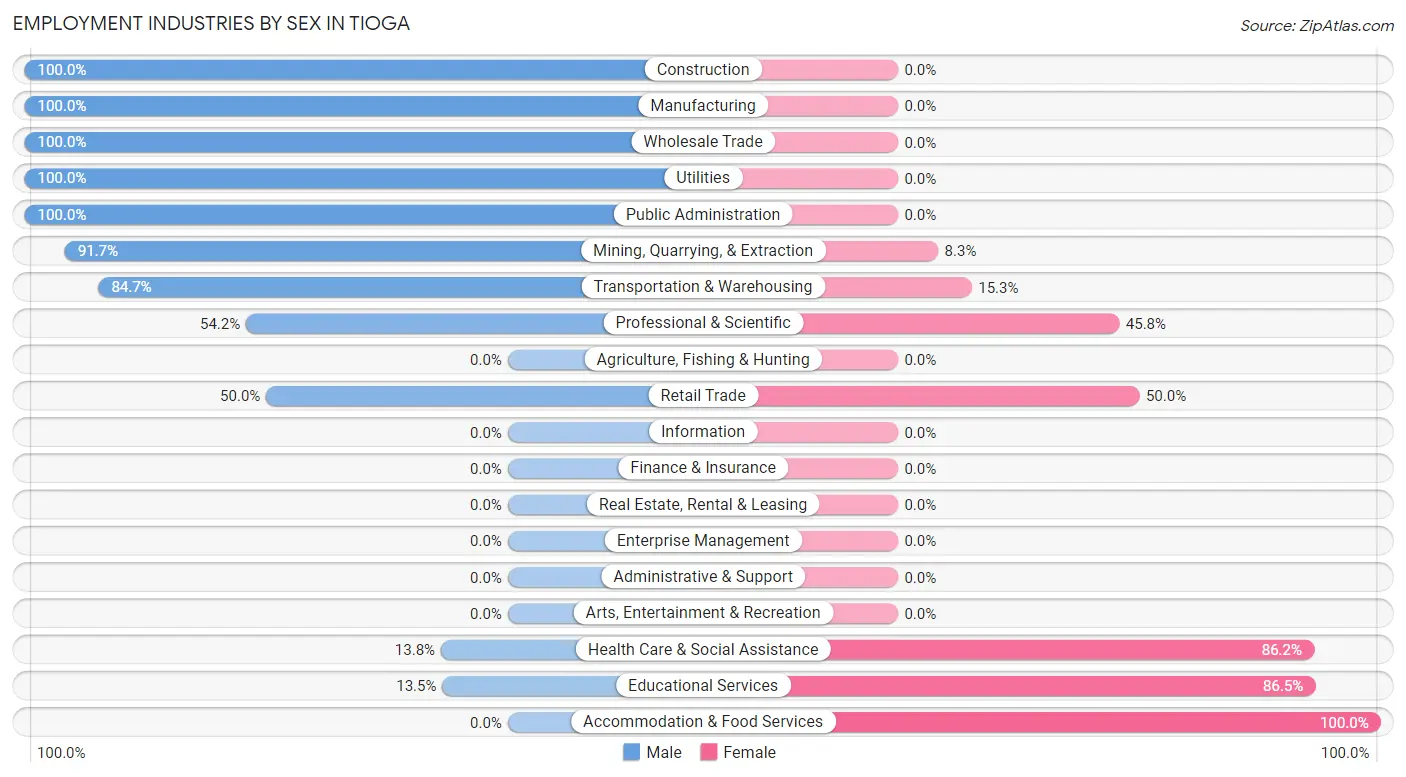
Employment Industries by Sex in Tioga
The Tioga industries that see more men than women are Construction (100.0%), Manufacturing (100.0%), and Wholesale Trade (100.0%), whereas the industries that tend to have a higher number of women are Accommodation & Food Services (100.0%), Educational Services (86.5%), and Health Care & Social Assistance (86.2%).
| Industry | Male | Female |
| Agriculture, Fishing & Hunting | 0 (0.0%) | 0 (0.0%) |
| Mining, Quarrying, & Extraction | 88 (91.7%) | 8 (8.3%) |
| Construction | 24 (100.0%) | 0 (0.0%) |
| Manufacturing | 1 (100.0%) | 0 (0.0%) |
| Wholesale Trade | 35 (100.0%) | 0 (0.0%) |
| Retail Trade | 51 (50.0%) | 51 (50.0%) |
| Transportation & Warehousing | 72 (84.7%) | 13 (15.3%) |
| Utilities | 8 (100.0%) | 0 (0.0%) |
| Information | 0 (0.0%) | 0 (0.0%) |
| Finance & Insurance | 0 (0.0%) | 0 (0.0%) |
| Real Estate, Rental & Leasing | 0 (0.0%) | 0 (0.0%) |
| Professional & Scientific | 52 (54.2%) | 44 (45.8%) |
| Enterprise Management | 0 (0.0%) | 0 (0.0%) |
| Administrative & Support | 0 (0.0%) | 0 (0.0%) |
| Educational Services | 13 (13.5%) | 83 (86.5%) |
| Health Care & Social Assistance | 13 (13.8%) | 81 (86.2%) |
| Arts, Entertainment & Recreation | 0 (0.0%) | 0 (0.0%) |
| Accommodation & Food Services | 0 (0.0%) | 29 (100.0%) |
| Public Administration | 12 (100.0%) | 0 (0.0%) |
| Total | 374 (54.8%) | 309 (45.2%) |
Education in Tioga
School Enrollment in Tioga
The most common levels of schooling among the 136 students in Tioga are nursery / preschool (56 | 41.2%), high school (39 | 28.7%), and elementary school (15 | 11.0%).
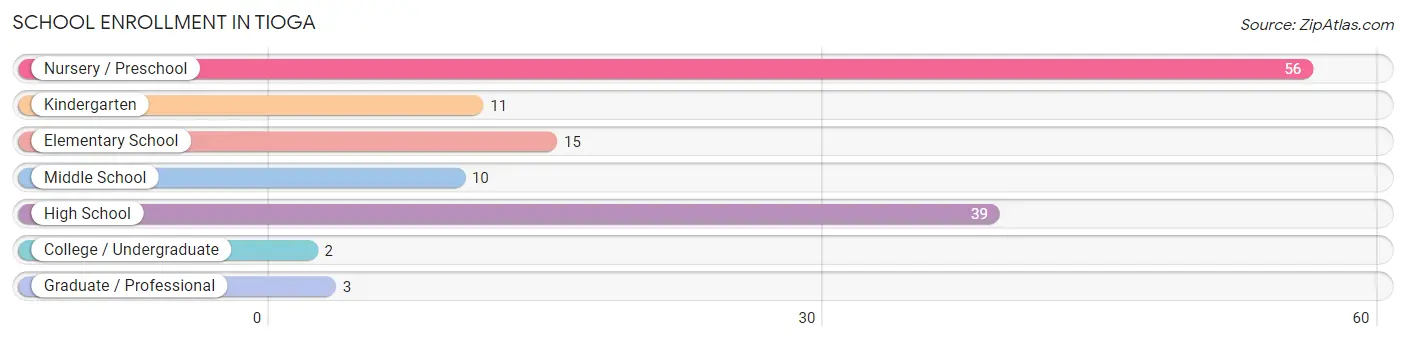
| School Level | # Students | % Students |
| Nursery / Preschool | 56 | 41.2% |
| Kindergarten | 11 | 8.1% |
| Elementary School | 15 | 11.0% |
| Middle School | 10 | 7.3% |
| High School | 39 | 28.7% |
| College / Undergraduate | 2 | 1.5% |
| Graduate / Professional | 3 | 2.2% |
| Total | 136 | 100.0% |
School Enrollment by Age by Funding Source in Tioga
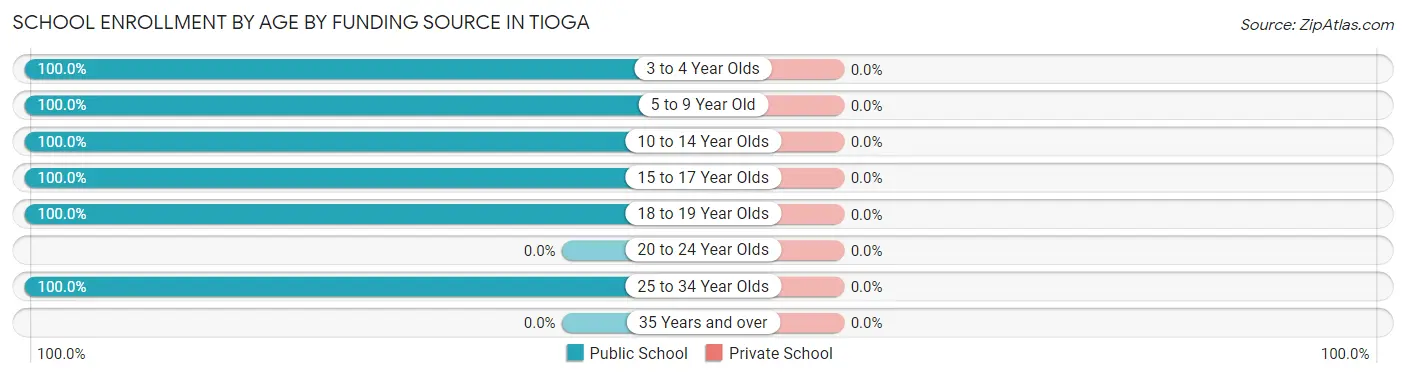
| Age Bracket | Public School | Private School |
| 3 to 4 Year Olds | 56 (100.0%) | 0 (0.0%) |
| 5 to 9 Year Old | 26 (100.0%) | 0 (0.0%) |
| 10 to 14 Year Olds | 10 (100.0%) | 0 (0.0%) |
| 15 to 17 Year Olds | 32 (100.0%) | 0 (0.0%) |
| 18 to 19 Year Olds | 7 (100.0%) | 0 (0.0%) |
| 20 to 24 Year Olds | 0 (0.0%) | 0 (0.0%) |
| 25 to 34 Year Olds | 5 (100.0%) | 0 (0.0%) |
| 35 Years and over | 0 (0.0%) | 0 (0.0%) |
| Total | 136 (100.0%) | 0 (0.0%) |
Educational Attainment by Field of Study in Tioga
Science & technology (109 | 60.6%), education (50 | 27.8%), business (16 | 8.9%), and arts & humanities (5 | 2.8%) are the most common fields of study among 180 individuals in Tioga who have obtained a bachelor's degree or higher.
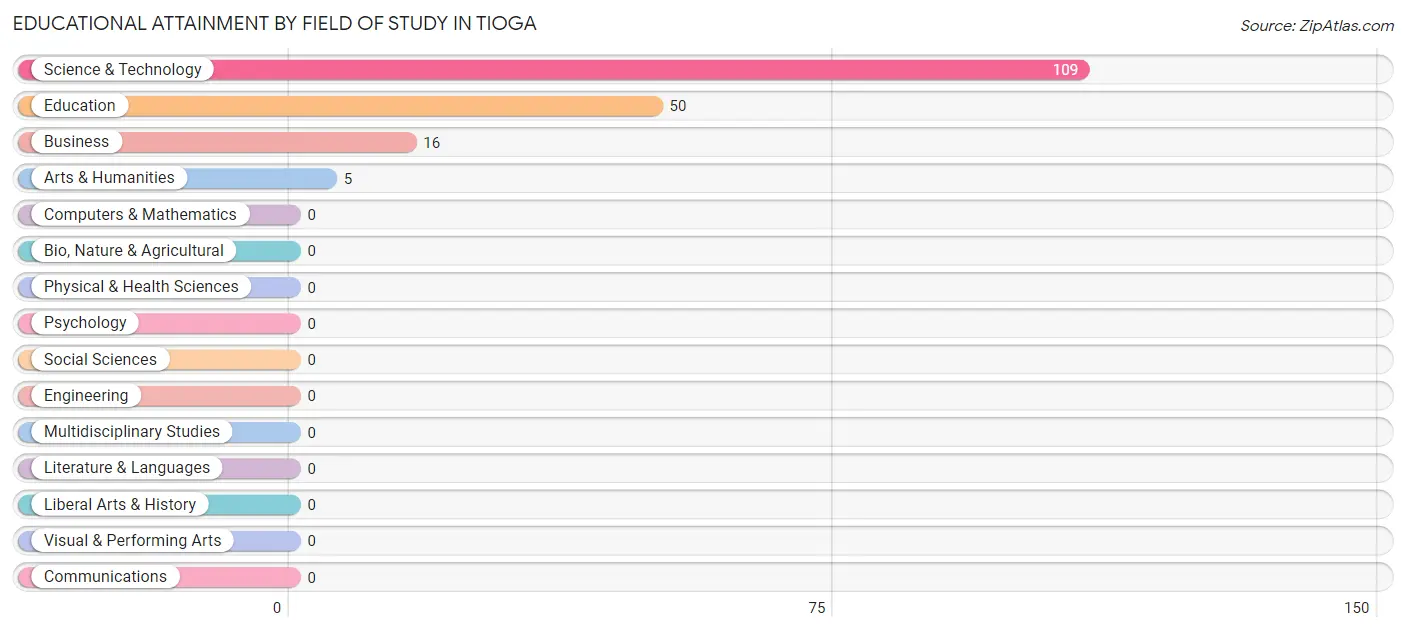
| Field of Study | # Graduates | % Graduates |
| Computers & Mathematics | 0 | 0.0% |
| Bio, Nature & Agricultural | 0 | 0.0% |
| Physical & Health Sciences | 0 | 0.0% |
| Psychology | 0 | 0.0% |
| Social Sciences | 0 | 0.0% |
| Engineering | 0 | 0.0% |
| Multidisciplinary Studies | 0 | 0.0% |
| Science & Technology | 109 | 60.6% |
| Business | 16 | 8.9% |
| Education | 50 | 27.8% |
| Literature & Languages | 0 | 0.0% |
| Liberal Arts & History | 0 | 0.0% |
| Visual & Performing Arts | 0 | 0.0% |
| Communications | 0 | 0.0% |
| Arts & Humanities | 5 | 2.8% |
| Total | 180 | 100.0% |
Transportation & Commute in Tioga
Vehicle Availability by Sex in Tioga
The most prevalent vehicle ownership categories in Tioga are males with 2 vehicles (134, accounting for 36.3%) and females with 2 vehicles (34, making up 46.1%).
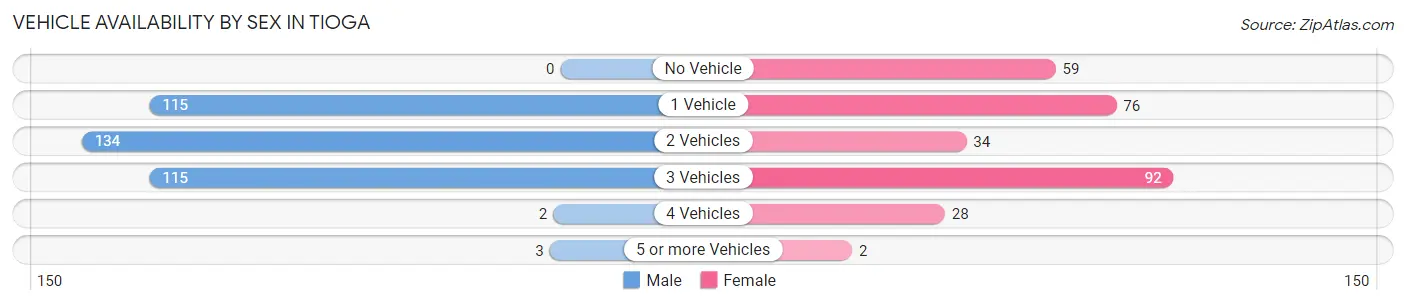
| Vehicles Available | Male | Female |
| No Vehicle | 0 (0.0%) | 59 (20.3%) |
| 1 Vehicle | 115 (31.2%) | 76 (26.1%) |
| 2 Vehicles | 134 (36.3%) | 34 (11.7%) |
| 3 Vehicles | 115 (31.2%) | 92 (31.6%) |
| 4 Vehicles | 2 (0.5%) | 28 (9.6%) |
| 5 or more Vehicles | 3 (0.8%) | 2 (0.7%) |
| Total | 369 (100.0%) | 291 (100.0%) |
Commute Time in Tioga
The most frequently occuring commute durations in Tioga are 5 to 9 minutes (179 commuters, 27.3%), less than 5 minutes (162 commuters, 24.7%), and 10 to 14 minutes (94 commuters, 14.3%).
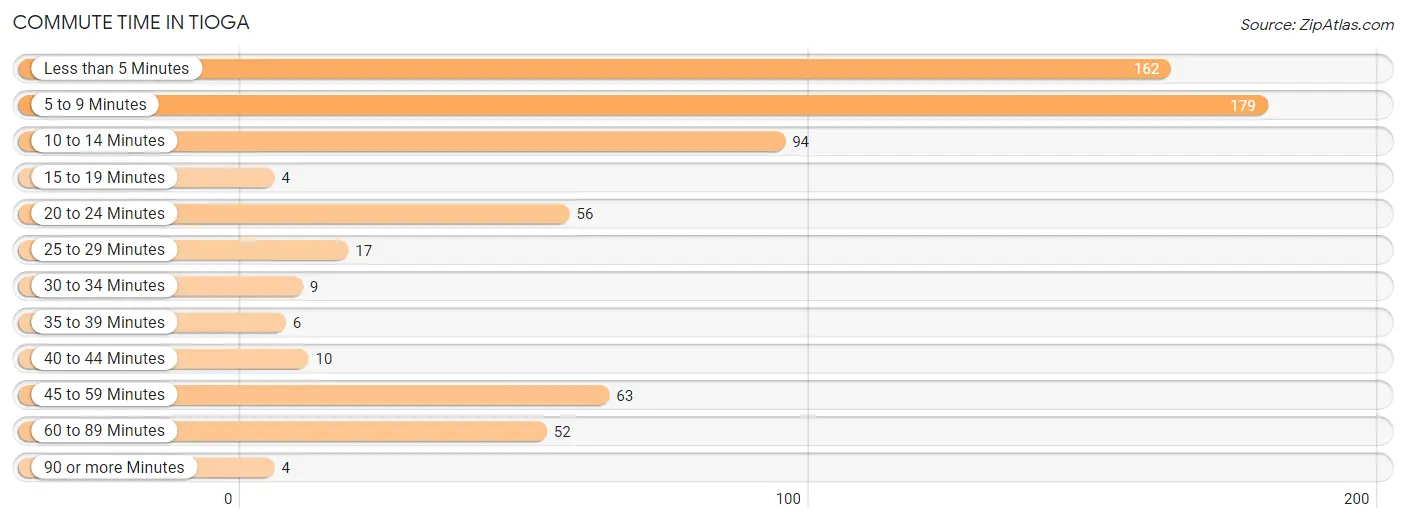
| Commute Time | # Commuters | % Commuters |
| Less than 5 Minutes | 162 | 24.7% |
| 5 to 9 Minutes | 179 | 27.3% |
| 10 to 14 Minutes | 94 | 14.3% |
| 15 to 19 Minutes | 4 | 0.6% |
| 20 to 24 Minutes | 56 | 8.5% |
| 25 to 29 Minutes | 17 | 2.6% |
| 30 to 34 Minutes | 9 | 1.4% |
| 35 to 39 Minutes | 6 | 0.9% |
| 40 to 44 Minutes | 10 | 1.5% |
| 45 to 59 Minutes | 63 | 9.6% |
| 60 to 89 Minutes | 52 | 7.9% |
| 90 or more Minutes | 4 | 0.6% |
Commute Time by Sex in Tioga
The most common commute times in Tioga are 5 to 9 minutes (64 commuters, 17.6%) for males and 5 to 9 minutes (115 commuters, 39.4%) for females.
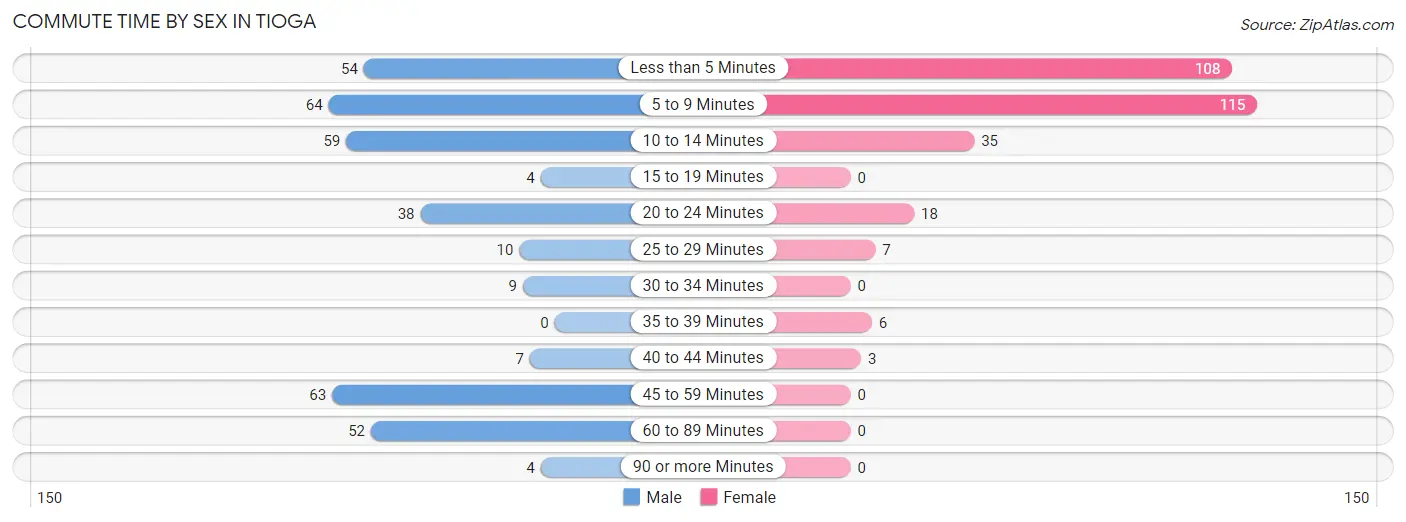
| Commute Time | Male | Female |
| Less than 5 Minutes | 54 (14.8%) | 108 (37.0%) |
| 5 to 9 Minutes | 64 (17.6%) | 115 (39.4%) |
| 10 to 14 Minutes | 59 (16.2%) | 35 (12.0%) |
| 15 to 19 Minutes | 4 (1.1%) | 0 (0.0%) |
| 20 to 24 Minutes | 38 (10.4%) | 18 (6.2%) |
| 25 to 29 Minutes | 10 (2.8%) | 7 (2.4%) |
| 30 to 34 Minutes | 9 (2.5%) | 0 (0.0%) |
| 35 to 39 Minutes | 0 (0.0%) | 6 (2.1%) |
| 40 to 44 Minutes | 7 (1.9%) | 3 (1.0%) |
| 45 to 59 Minutes | 63 (17.3%) | 0 (0.0%) |
| 60 to 89 Minutes | 52 (14.3%) | 0 (0.0%) |
| 90 or more Minutes | 4 (1.1%) | 0 (0.0%) |
Time of Departure to Work by Sex in Tioga
The most frequent times of departure to work in Tioga are 6:00 AM to 6:29 AM (73, 20.1%) for males and 7:00 AM to 7:29 AM (84, 28.8%) for females.
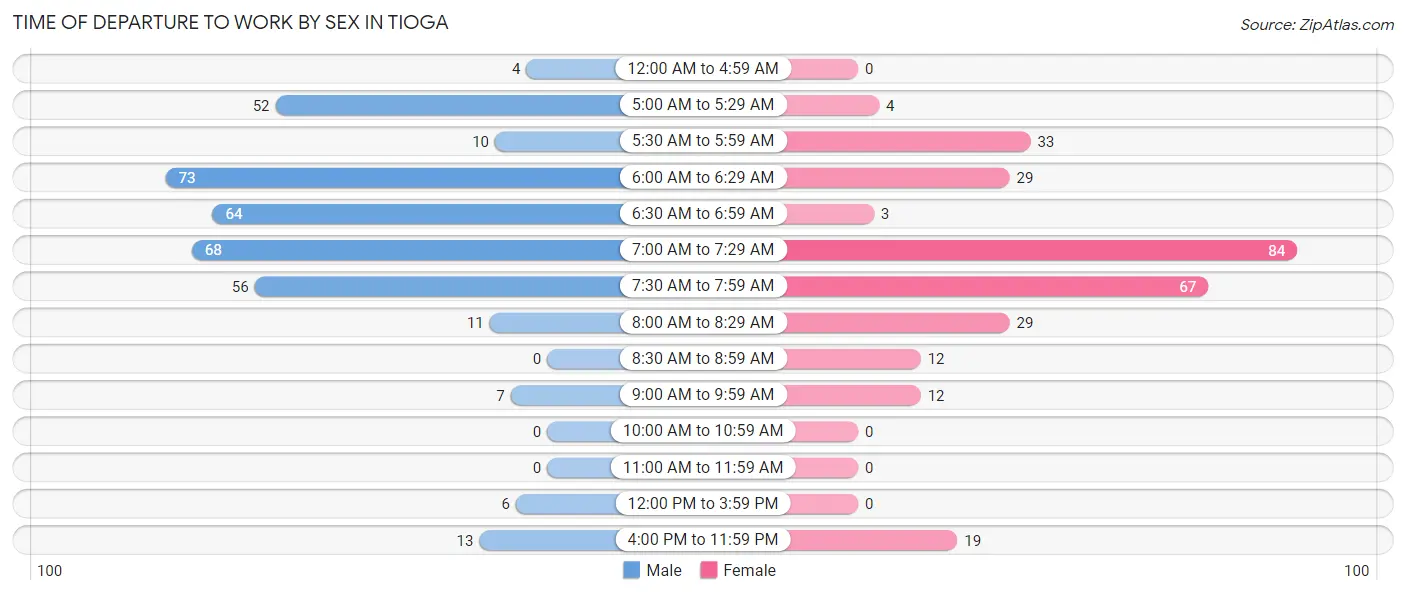
| Time of Departure | Male | Female |
| 12:00 AM to 4:59 AM | 4 (1.1%) | 0 (0.0%) |
| 5:00 AM to 5:29 AM | 52 (14.3%) | 4 (1.4%) |
| 5:30 AM to 5:59 AM | 10 (2.8%) | 33 (11.3%) |
| 6:00 AM to 6:29 AM | 73 (20.1%) | 29 (9.9%) |
| 6:30 AM to 6:59 AM | 64 (17.6%) | 3 (1.0%) |
| 7:00 AM to 7:29 AM | 68 (18.7%) | 84 (28.8%) |
| 7:30 AM to 7:59 AM | 56 (15.4%) | 67 (23.0%) |
| 8:00 AM to 8:29 AM | 11 (3.0%) | 29 (9.9%) |
| 8:30 AM to 8:59 AM | 0 (0.0%) | 12 (4.1%) |
| 9:00 AM to 9:59 AM | 7 (1.9%) | 12 (4.1%) |
| 10:00 AM to 10:59 AM | 0 (0.0%) | 0 (0.0%) |
| 11:00 AM to 11:59 AM | 0 (0.0%) | 0 (0.0%) |
| 12:00 PM to 3:59 PM | 6 (1.7%) | 0 (0.0%) |
| 4:00 PM to 11:59 PM | 13 (3.6%) | 19 (6.5%) |
| Total | 364 (100.0%) | 292 (100.0%) |
Housing Occupancy in Tioga
Occupancy by Ownership in Tioga
Of the total 688 dwellings in Tioga, owner-occupied units account for 401 (58.3%), while renter-occupied units make up 287 (41.7%).
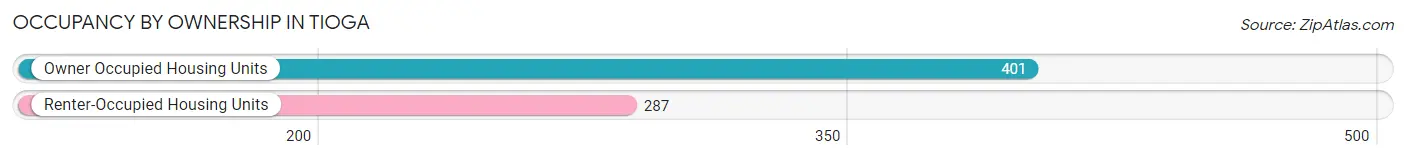
| Occupancy | # Housing Units | % Housing Units |
| Owner Occupied Housing Units | 401 | 58.3% |
| Renter-Occupied Housing Units | 287 | 41.7% |
| Total Occupied Housing Units | 688 | 100.0% |
Occupancy by Household Size in Tioga
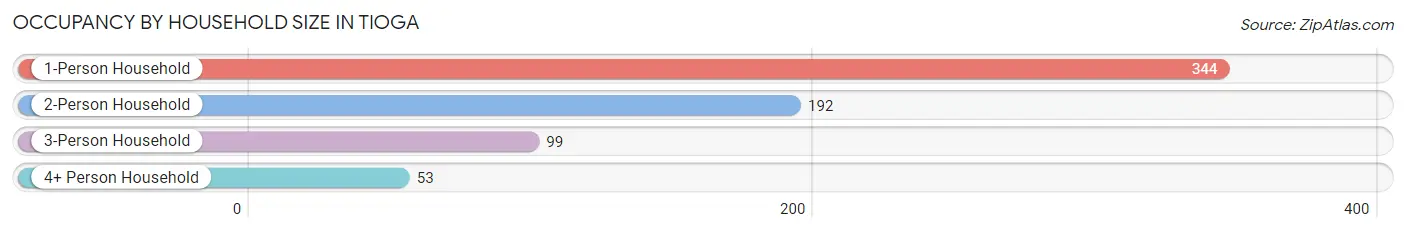
| Household Size | # Housing Units | % Housing Units |
| 1-Person Household | 344 | 50.0% |
| 2-Person Household | 192 | 27.9% |
| 3-Person Household | 99 | 14.4% |
| 4+ Person Household | 53 | 7.7% |
| Total Housing Units | 688 | 100.0% |
Occupancy by Ownership by Household Size in Tioga
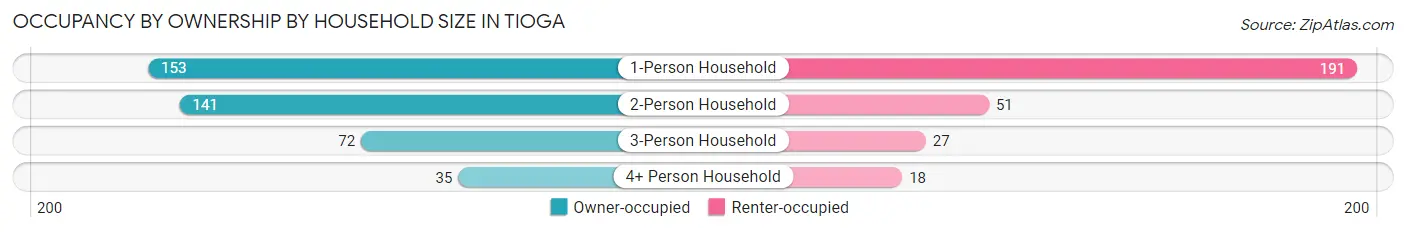
| Household Size | Owner-occupied | Renter-occupied |
| 1-Person Household | 153 (44.5%) | 191 (55.5%) |
| 2-Person Household | 141 (73.4%) | 51 (26.6%) |
| 3-Person Household | 72 (72.7%) | 27 (27.3%) |
| 4+ Person Household | 35 (66.0%) | 18 (34.0%) |
| Total Housing Units | 401 (58.3%) | 287 (41.7%) |
Occupancy by Educational Attainment in Tioga
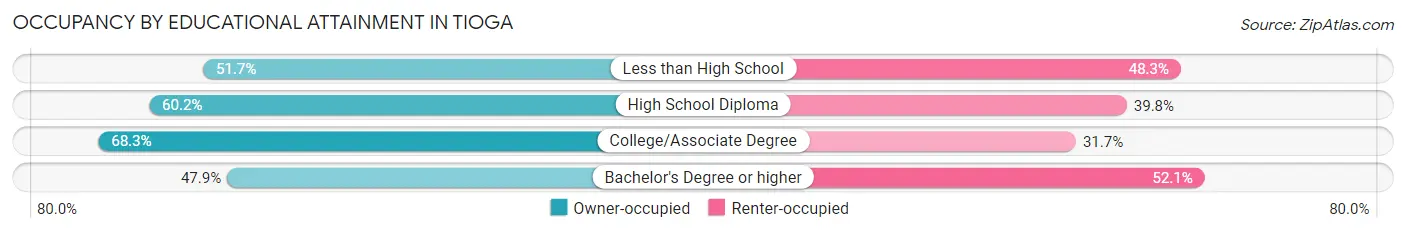
| Household Size | Owner-occupied | Renter-occupied |
| Less than High School | 46 (51.7%) | 43 (48.3%) |
| High School Diploma | 150 (60.2%) | 99 (39.8%) |
| College/Associate Degree | 125 (68.3%) | 58 (31.7%) |
| Bachelor's Degree or higher | 80 (47.9%) | 87 (52.1%) |
Occupancy by Age of Householder in Tioga
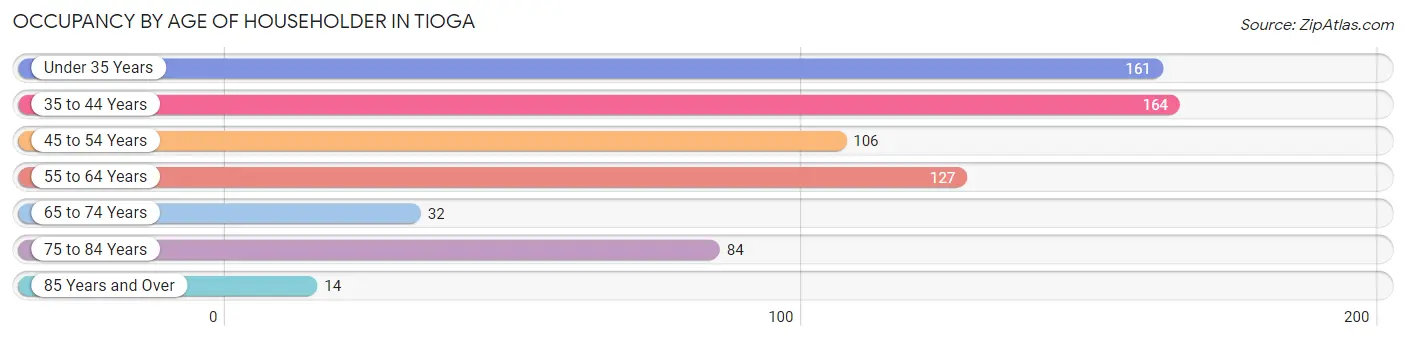
| Age Bracket | # Households | % Households |
| Under 35 Years | 161 | 23.4% |
| 35 to 44 Years | 164 | 23.8% |
| 45 to 54 Years | 106 | 15.4% |
| 55 to 64 Years | 127 | 18.5% |
| 65 to 74 Years | 32 | 4.6% |
| 75 to 84 Years | 84 | 12.2% |
| 85 Years and Over | 14 | 2.0% |
| Total | 688 | 100.0% |
Housing Finances in Tioga
Median Income by Occupancy in Tioga
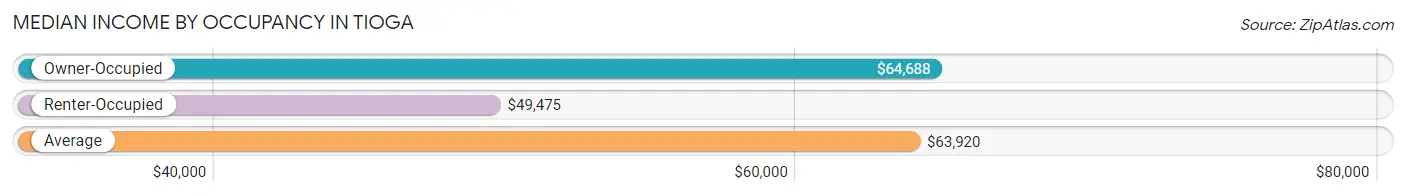
| Occupancy Type | # Households | Median Income |
| Owner-Occupied | 401 (58.3%) | $64,688 |
| Renter-Occupied | 287 (41.7%) | $49,475 |
| Average | 688 (100.0%) | $63,920 |
Occupancy by Householder Income Bracket in Tioga
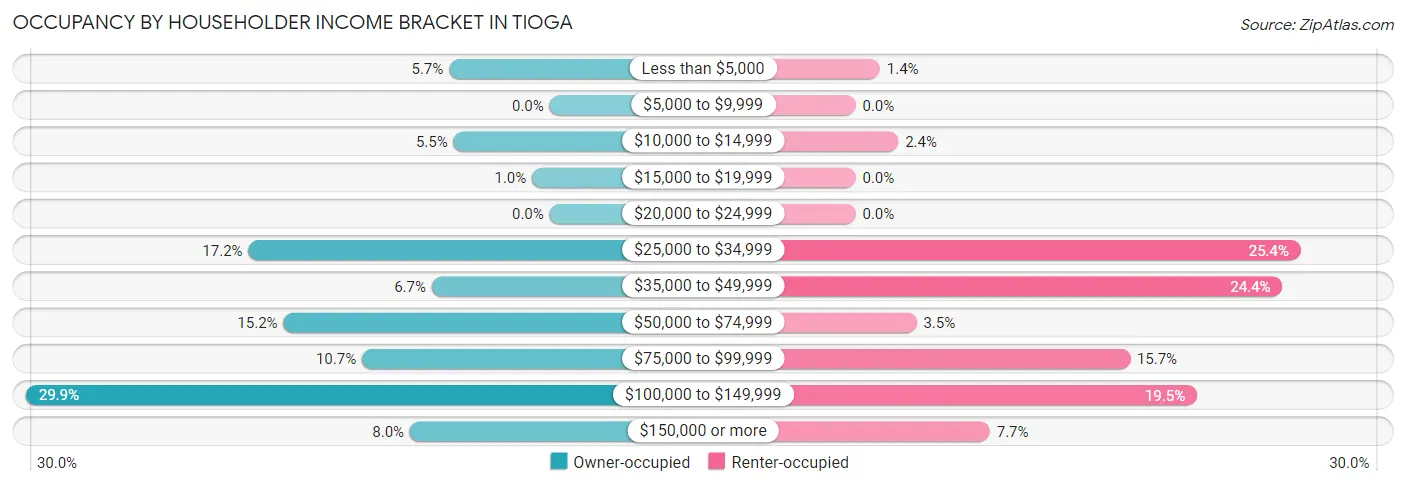
| Income Bracket | Owner-occupied | Renter-occupied |
| Less than $5,000 | 23 (5.7%) | 4 (1.4%) |
| $5,000 to $9,999 | 0 (0.0%) | 0 (0.0%) |
| $10,000 to $14,999 | 22 (5.5%) | 7 (2.4%) |
| $15,000 to $19,999 | 4 (1.0%) | 0 (0.0%) |
| $20,000 to $24,999 | 0 (0.0%) | 0 (0.0%) |
| $25,000 to $34,999 | 69 (17.2%) | 73 (25.4%) |
| $35,000 to $49,999 | 27 (6.7%) | 70 (24.4%) |
| $50,000 to $74,999 | 61 (15.2%) | 10 (3.5%) |
| $75,000 to $99,999 | 43 (10.7%) | 45 (15.7%) |
| $100,000 to $149,999 | 120 (29.9%) | 56 (19.5%) |
| $150,000 or more | 32 (8.0%) | 22 (7.7%) |
| Total | 401 (100.0%) | 287 (100.0%) |
Monthly Housing Cost Tiers in Tioga
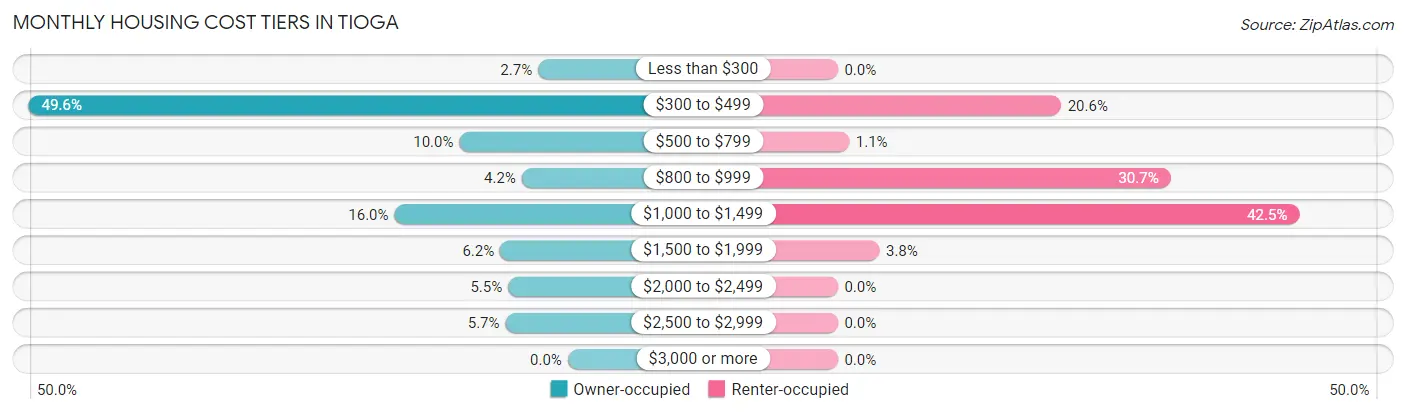
| Monthly Cost | Owner-occupied | Renter-occupied |
| Less than $300 | 11 (2.7%) | 0 (0.0%) |
| $300 to $499 | 199 (49.6%) | 59 (20.6%) |
| $500 to $799 | 40 (10.0%) | 3 (1.1%) |
| $800 to $999 | 17 (4.2%) | 88 (30.7%) |
| $1,000 to $1,499 | 64 (16.0%) | 122 (42.5%) |
| $1,500 to $1,999 | 25 (6.2%) | 11 (3.8%) |
| $2,000 to $2,499 | 22 (5.5%) | 0 (0.0%) |
| $2,500 to $2,999 | 23 (5.7%) | 0 (0.0%) |
| $3,000 or more | 0 (0.0%) | 0 (0.0%) |
| Total | 401 (100.0%) | 287 (100.0%) |
Physical Housing Characteristics in Tioga
Housing Structures in Tioga
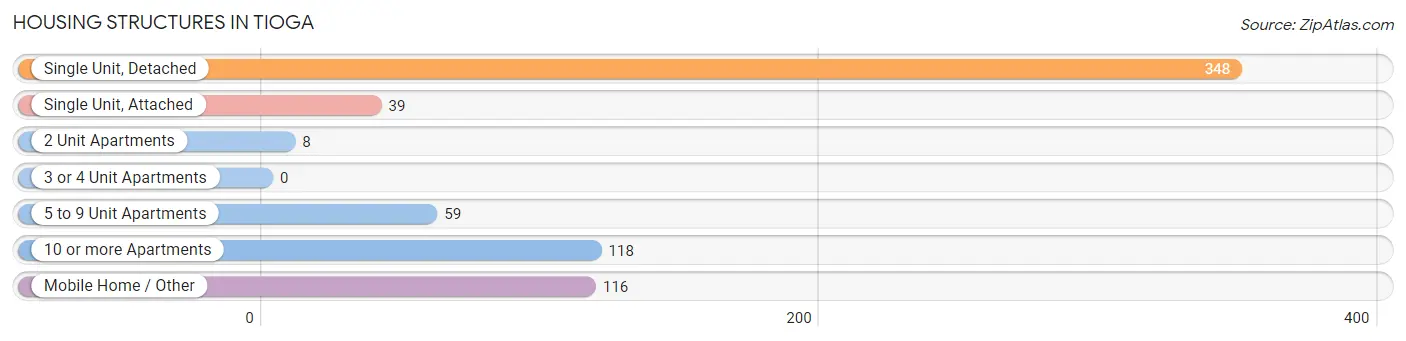
| Structure Type | # Housing Units | % Housing Units |
| Single Unit, Detached | 348 | 50.6% |
| Single Unit, Attached | 39 | 5.7% |
| 2 Unit Apartments | 8 | 1.2% |
| 3 or 4 Unit Apartments | 0 | 0.0% |
| 5 to 9 Unit Apartments | 59 | 8.6% |
| 10 or more Apartments | 118 | 17.2% |
| Mobile Home / Other | 116 | 16.9% |
| Total | 688 | 100.0% |
Housing Structures by Occupancy in Tioga
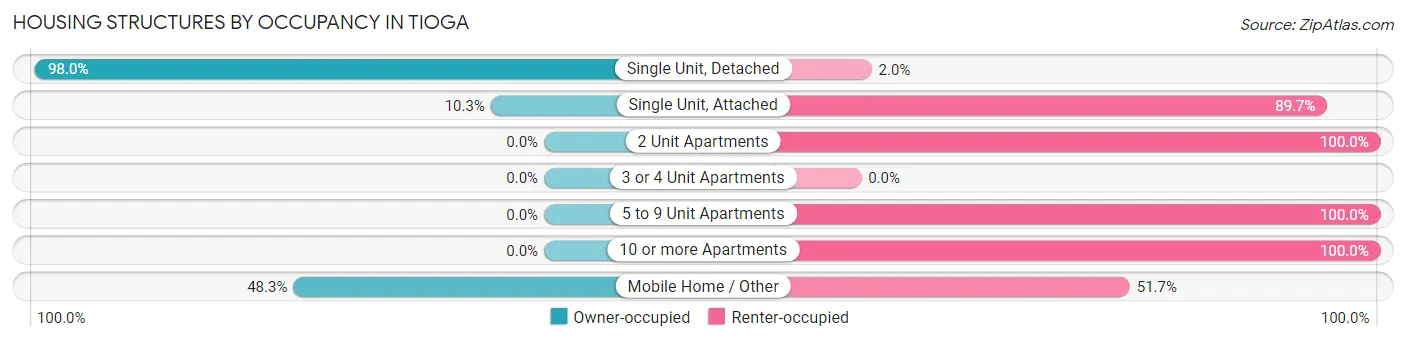
| Structure Type | Owner-occupied | Renter-occupied |
| Single Unit, Detached | 341 (98.0%) | 7 (2.0%) |
| Single Unit, Attached | 4 (10.3%) | 35 (89.7%) |
| 2 Unit Apartments | 0 (0.0%) | 8 (100.0%) |
| 3 or 4 Unit Apartments | 0 (0.0%) | 0 (0.0%) |
| 5 to 9 Unit Apartments | 0 (0.0%) | 59 (100.0%) |
| 10 or more Apartments | 0 (0.0%) | 118 (100.0%) |
| Mobile Home / Other | 56 (48.3%) | 60 (51.7%) |
| Total | 401 (58.3%) | 287 (41.7%) |
Housing Structures by Number of Rooms in Tioga
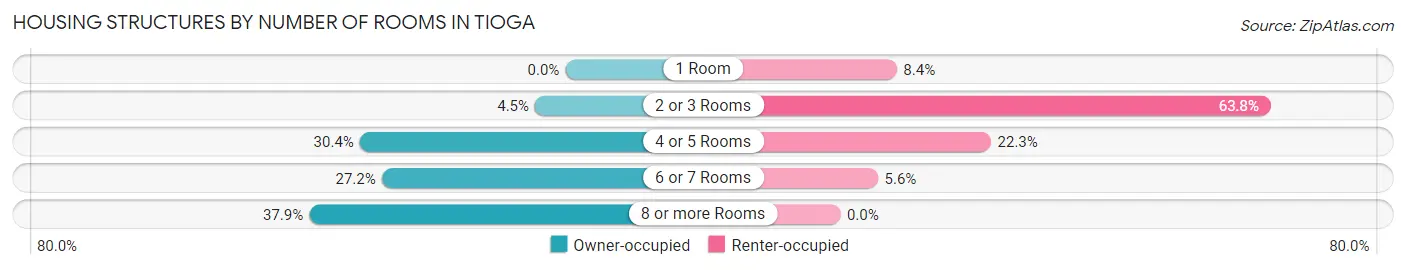
| Number of Rooms | Owner-occupied | Renter-occupied |
| 1 Room | 0 (0.0%) | 24 (8.4%) |
| 2 or 3 Rooms | 18 (4.5%) | 183 (63.8%) |
| 4 or 5 Rooms | 122 (30.4%) | 64 (22.3%) |
| 6 or 7 Rooms | 109 (27.2%) | 16 (5.6%) |
| 8 or more Rooms | 152 (37.9%) | 0 (0.0%) |
| Total | 401 (100.0%) | 287 (100.0%) |
Housing Structure by Heating Type in Tioga
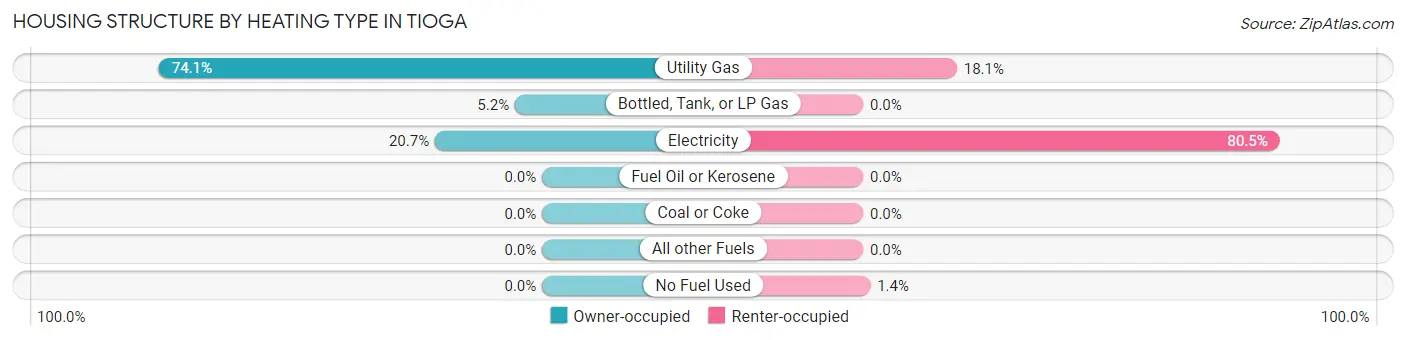
| Heating Type | Owner-occupied | Renter-occupied |
| Utility Gas | 297 (74.1%) | 52 (18.1%) |
| Bottled, Tank, or LP Gas | 21 (5.2%) | 0 (0.0%) |
| Electricity | 83 (20.7%) | 231 (80.5%) |
| Fuel Oil or Kerosene | 0 (0.0%) | 0 (0.0%) |
| Coal or Coke | 0 (0.0%) | 0 (0.0%) |
| All other Fuels | 0 (0.0%) | 0 (0.0%) |
| No Fuel Used | 0 (0.0%) | 4 (1.4%) |
| Total | 401 (100.0%) | 287 (100.0%) |
Household Vehicle Usage in Tioga
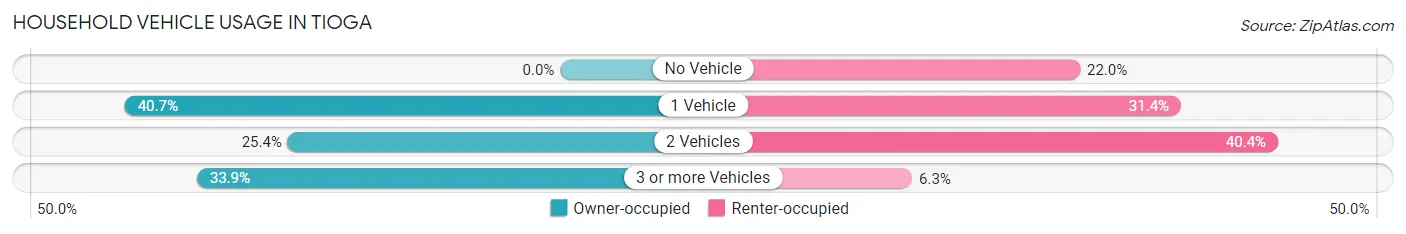
| Vehicles per Household | Owner-occupied | Renter-occupied |
| No Vehicle | 0 (0.0%) | 63 (22.0%) |
| 1 Vehicle | 163 (40.6%) | 90 (31.4%) |
| 2 Vehicles | 102 (25.4%) | 116 (40.4%) |
| 3 or more Vehicles | 136 (33.9%) | 18 (6.3%) |
| Total | 401 (100.0%) | 287 (100.0%) |
Real Estate & Mortgages in Tioga
Real Estate and Mortgage Overview in Tioga
| Characteristic | Without Mortgage | With Mortgage |
| Housing Units | 260 | 141 |
| Median Property Value | $160,200 | $214,600 |
| Median Household Income | $64,943 | $3 |
| Monthly Housing Costs | $415 | $0 |
| Real Estate Taxes | $1,184 | $23 |
Property Value by Mortgage Status in Tioga
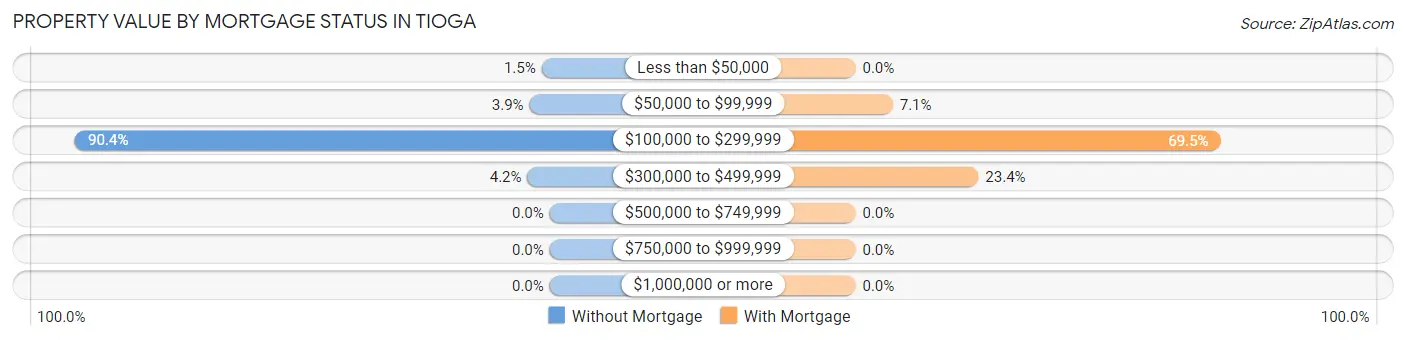
| Property Value | Without Mortgage | With Mortgage |
| Less than $50,000 | 4 (1.5%) | 0 (0.0%) |
| $50,000 to $99,999 | 10 (3.8%) | 10 (7.1%) |
| $100,000 to $299,999 | 235 (90.4%) | 98 (69.5%) |
| $300,000 to $499,999 | 11 (4.2%) | 33 (23.4%) |
| $500,000 to $749,999 | 0 (0.0%) | 0 (0.0%) |
| $750,000 to $999,999 | 0 (0.0%) | 0 (0.0%) |
| $1,000,000 or more | 0 (0.0%) | 0 (0.0%) |
| Total | 260 (100.0%) | 141 (100.0%) |
Household Income by Mortgage Status in Tioga
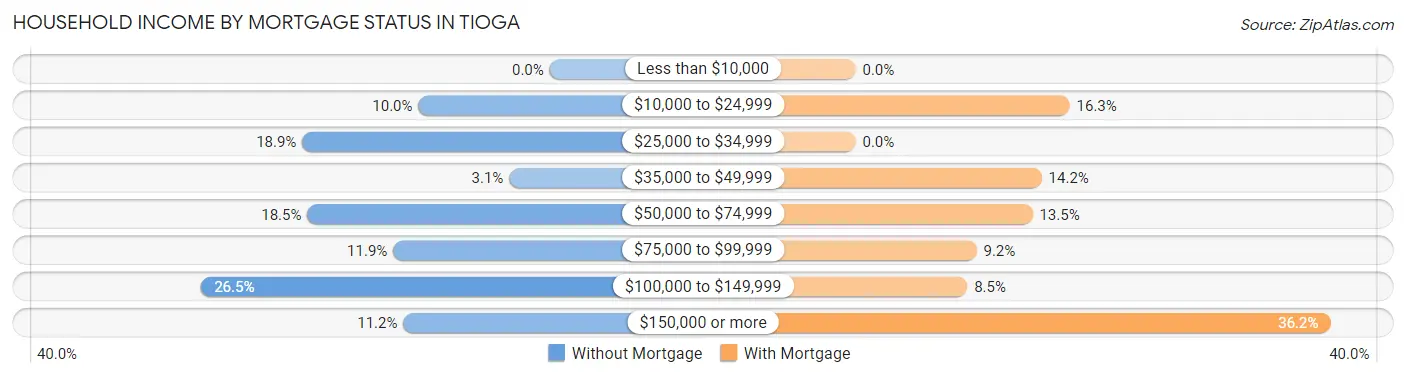
| Household Income | Without Mortgage | With Mortgage |
| Less than $10,000 | 0 (0.0%) | 0 (0.0%) |
| $10,000 to $24,999 | 26 (10.0%) | 23 (16.3%) |
| $25,000 to $34,999 | 49 (18.9%) | 0 (0.0%) |
| $35,000 to $49,999 | 8 (3.1%) | 20 (14.2%) |
| $50,000 to $74,999 | 48 (18.5%) | 19 (13.5%) |
| $75,000 to $99,999 | 31 (11.9%) | 13 (9.2%) |
| $100,000 to $149,999 | 69 (26.5%) | 12 (8.5%) |
| $150,000 or more | 29 (11.2%) | 51 (36.2%) |
| Total | 260 (100.0%) | 141 (100.0%) |
Property Value to Household Income Ratio in Tioga
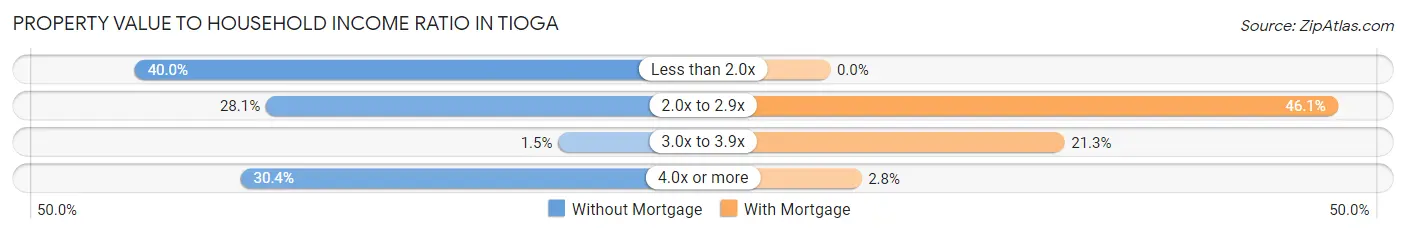
| Value-to-Income Ratio | Without Mortgage | With Mortgage |
| Less than 2.0x | 104 (40.0%) | 0 (0.0%) |
| 2.0x to 2.9x | 73 (28.1%) | 65 (46.1%) |
| 3.0x to 3.9x | 4 (1.5%) | 30 (21.3%) |
| 4.0x or more | 79 (30.4%) | 4 (2.8%) |
| Total | 260 (100.0%) | 141 (100.0%) |
Real Estate Taxes by Mortgage Status in Tioga
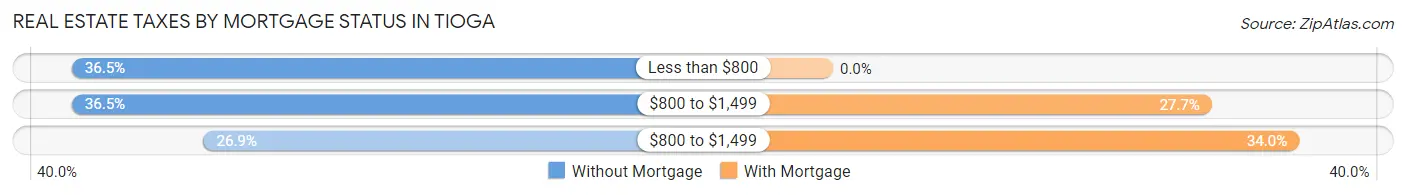
| Property Taxes | Without Mortgage | With Mortgage |
| Less than $800 | 95 (36.5%) | 0 (0.0%) |
| $800 to $1,499 | 95 (36.5%) | 39 (27.7%) |
| $800 to $1,499 | 70 (26.9%) | 48 (34.0%) |
| Total | 260 (100.0%) | 141 (100.0%) |
Health & Disability in Tioga
Health Insurance Coverage by Age in Tioga
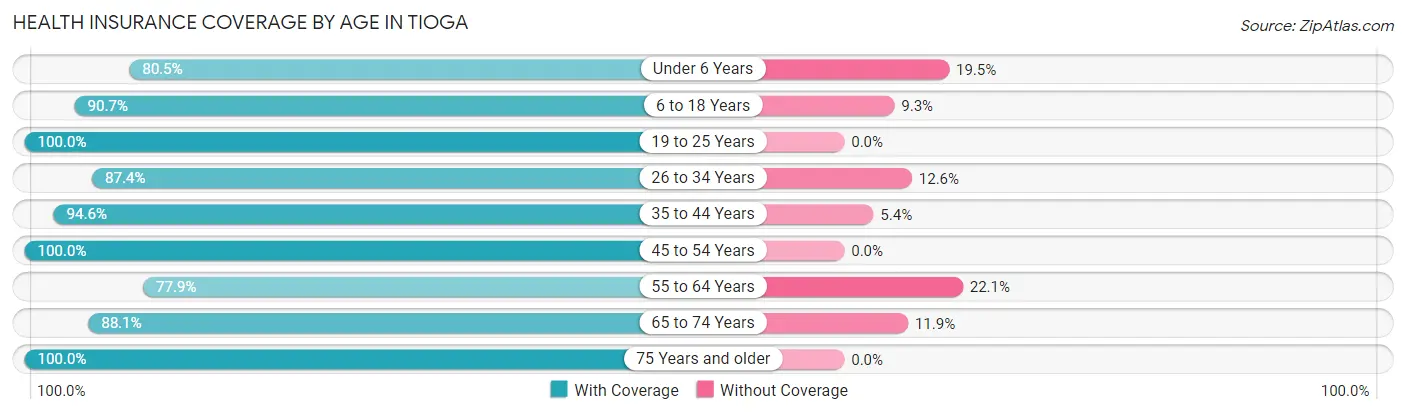
| Age Bracket | With Coverage | Without Coverage |
| Under 6 Years | 136 (80.5%) | 33 (19.5%) |
| 6 to 18 Years | 68 (90.7%) | 7 (9.3%) |
| 19 to 25 Years | 77 (100.0%) | 0 (0.0%) |
| 26 to 34 Years | 215 (87.4%) | 31 (12.6%) |
| 35 to 44 Years | 209 (94.6%) | 12 (5.4%) |
| 45 to 54 Years | 160 (100.0%) | 0 (0.0%) |
| 55 to 64 Years | 134 (77.9%) | 38 (22.1%) |
| 65 to 74 Years | 89 (88.1%) | 12 (11.9%) |
| 75 Years and older | 125 (100.0%) | 0 (0.0%) |
| Total | 1,213 (90.1%) | 133 (9.9%) |
Health Insurance Coverage by Citizenship Status in Tioga
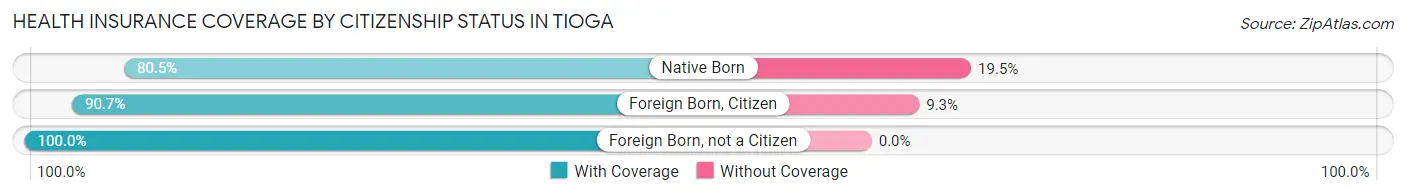
| Citizenship Status | With Coverage | Without Coverage |
| Native Born | 136 (80.5%) | 33 (19.5%) |
| Foreign Born, Citizen | 68 (90.7%) | 7 (9.3%) |
| Foreign Born, not a Citizen | 77 (100.0%) | 0 (0.0%) |
Health Insurance Coverage by Household Income in Tioga
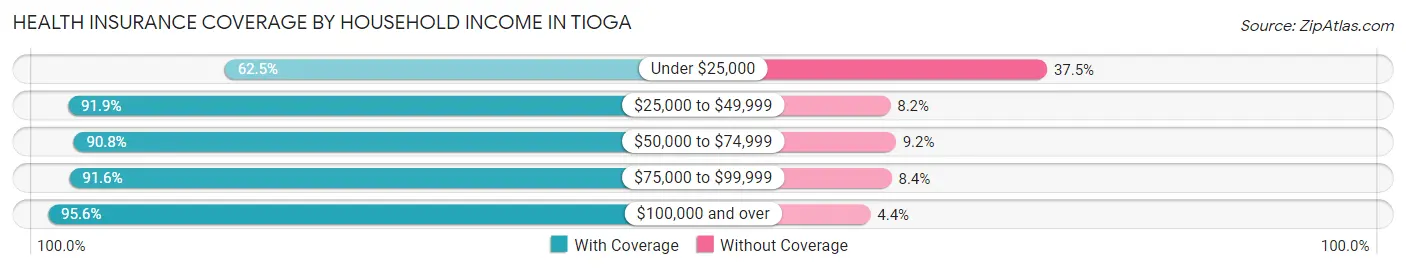
| Household Income | With Coverage | Without Coverage |
| Under $25,000 | 85 (62.5%) | 51 (37.5%) |
| $25,000 to $49,999 | 383 (91.8%) | 34 (8.2%) |
| $50,000 to $74,999 | 119 (90.8%) | 12 (9.2%) |
| $75,000 to $99,999 | 164 (91.6%) | 15 (8.4%) |
| $100,000 and over | 455 (95.6%) | 21 (4.4%) |
Public vs Private Health Insurance Coverage by Age in Tioga
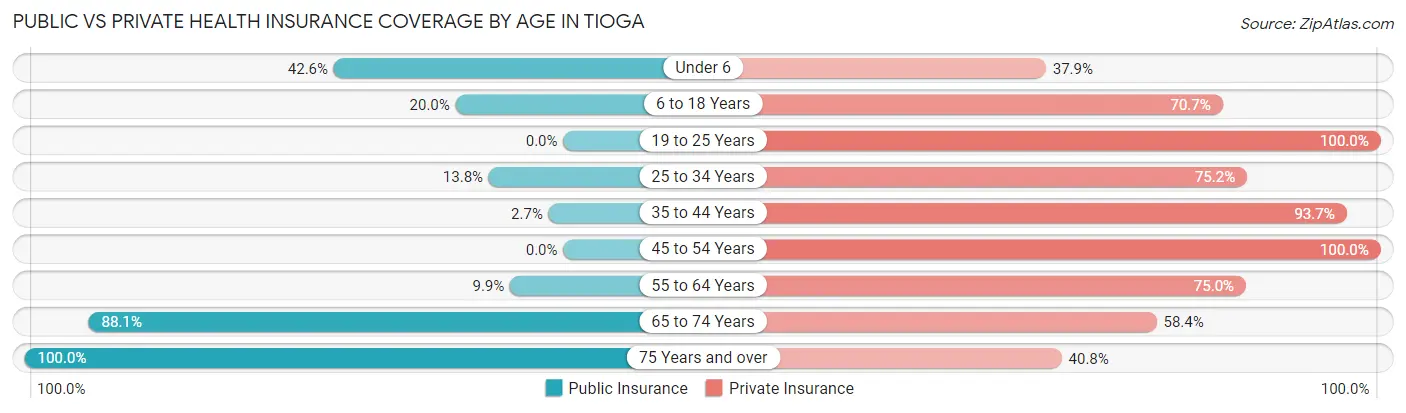
| Age Bracket | Public Insurance | Private Insurance |
| Under 6 | 72 (42.6%) | 64 (37.9%) |
| 6 to 18 Years | 15 (20.0%) | 53 (70.7%) |
| 19 to 25 Years | 0 (0.0%) | 77 (100.0%) |
| 25 to 34 Years | 34 (13.8%) | 185 (75.2%) |
| 35 to 44 Years | 6 (2.7%) | 207 (93.7%) |
| 45 to 54 Years | 0 (0.0%) | 160 (100.0%) |
| 55 to 64 Years | 17 (9.9%) | 129 (75.0%) |
| 65 to 74 Years | 89 (88.1%) | 59 (58.4%) |
| 75 Years and over | 125 (100.0%) | 51 (40.8%) |
| Total | 358 (26.6%) | 985 (73.2%) |
Disability Status by Sex by Age in Tioga
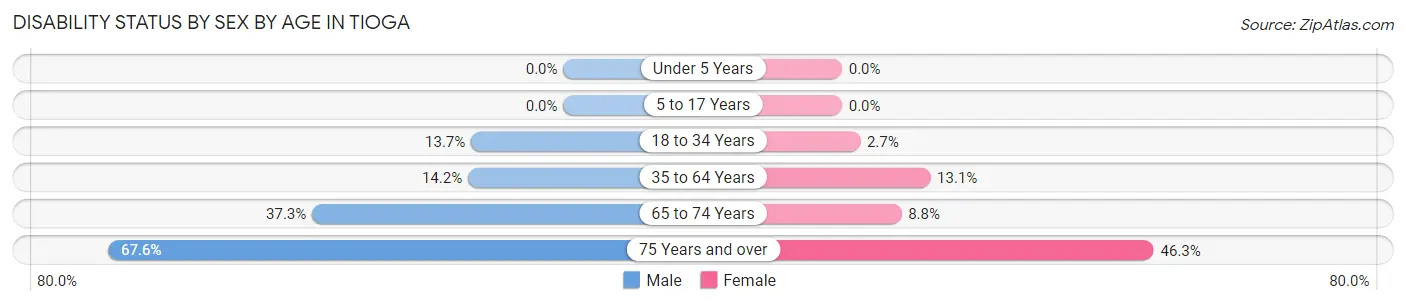
| Age Bracket | Male | Female |
| Under 5 Years | 0 (0.0%) | 0 (0.0%) |
| 5 to 17 Years | 0 (0.0%) | 0 (0.0%) |
| 18 to 34 Years | 30 (13.7%) | 3 (2.7%) |
| 35 to 64 Years | 33 (14.2%) | 42 (13.1%) |
| 65 to 74 Years | 25 (37.3%) | 3 (8.8%) |
| 75 Years and over | 48 (67.6%) | 25 (46.3%) |
Disability Class by Sex by Age in Tioga
Disability Class: Hearing Difficulty
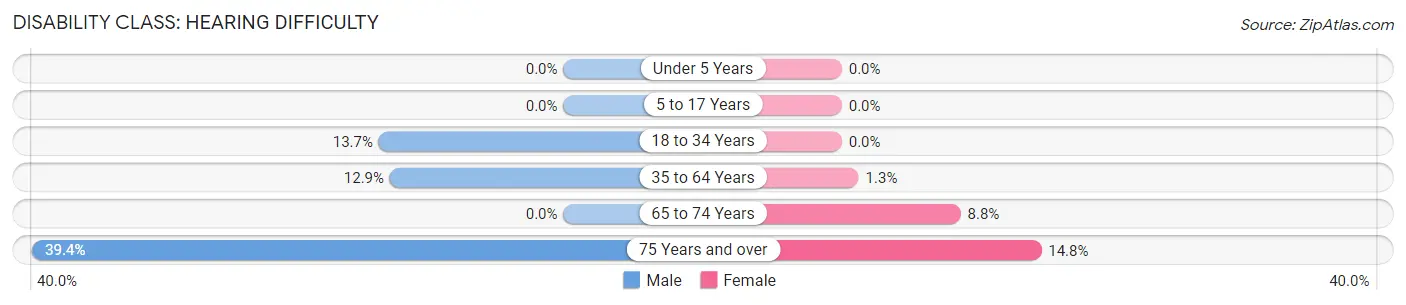
| Age Bracket | Male | Female |
| Under 5 Years | 0 (0.0%) | 0 (0.0%) |
| 5 to 17 Years | 0 (0.0%) | 0 (0.0%) |
| 18 to 34 Years | 30 (13.7%) | 0 (0.0%) |
| 35 to 64 Years | 30 (12.9%) | 4 (1.3%) |
| 65 to 74 Years | 0 (0.0%) | 3 (8.8%) |
| 75 Years and over | 28 (39.4%) | 8 (14.8%) |
Disability Class: Vision Difficulty
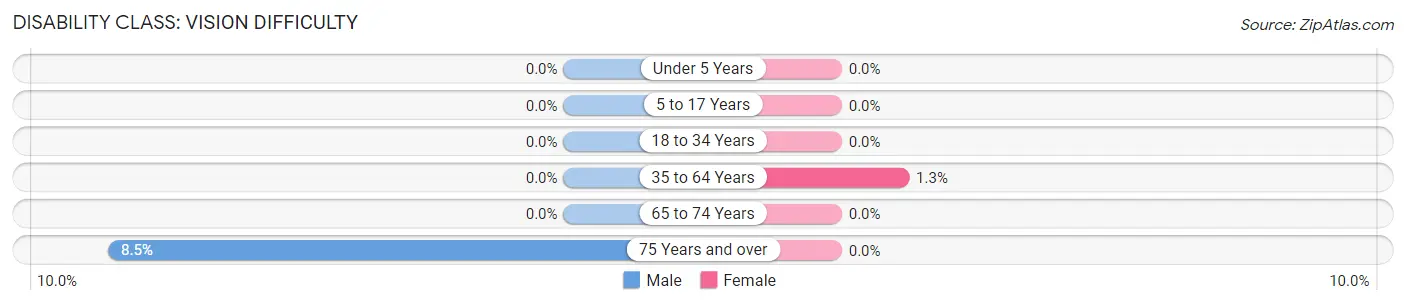
| Age Bracket | Male | Female |
| Under 5 Years | 0 (0.0%) | 0 (0.0%) |
| 5 to 17 Years | 0 (0.0%) | 0 (0.0%) |
| 18 to 34 Years | 0 (0.0%) | 0 (0.0%) |
| 35 to 64 Years | 0 (0.0%) | 4 (1.3%) |
| 65 to 74 Years | 0 (0.0%) | 0 (0.0%) |
| 75 Years and over | 6 (8.5%) | 0 (0.0%) |
Disability Class: Cognitive Difficulty
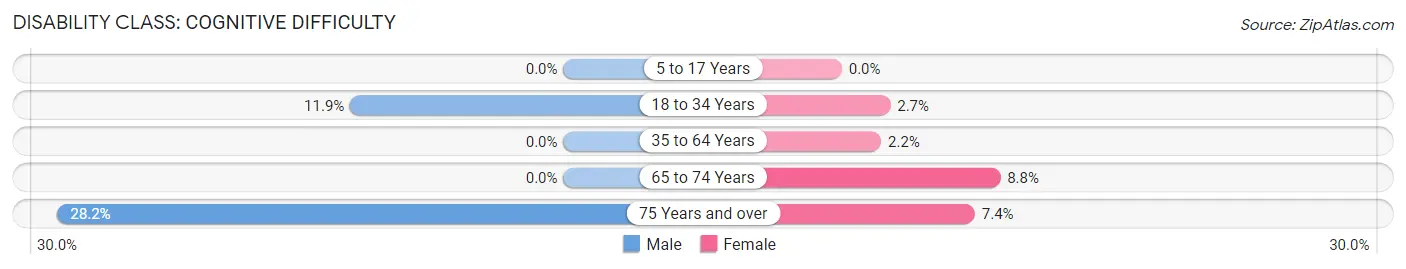
| Age Bracket | Male | Female |
| 5 to 17 Years | 0 (0.0%) | 0 (0.0%) |
| 18 to 34 Years | 26 (11.9%) | 3 (2.7%) |
| 35 to 64 Years | 0 (0.0%) | 7 (2.2%) |
| 65 to 74 Years | 0 (0.0%) | 3 (8.8%) |
| 75 Years and over | 20 (28.2%) | 4 (7.4%) |
Disability Class: Ambulatory Difficulty
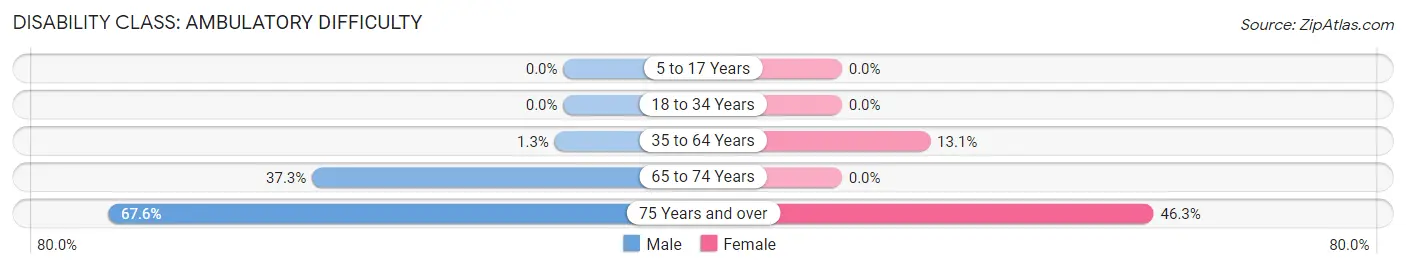
| Age Bracket | Male | Female |
| 5 to 17 Years | 0 (0.0%) | 0 (0.0%) |
| 18 to 34 Years | 0 (0.0%) | 0 (0.0%) |
| 35 to 64 Years | 3 (1.3%) | 42 (13.1%) |
| 65 to 74 Years | 25 (37.3%) | 0 (0.0%) |
| 75 Years and over | 48 (67.6%) | 25 (46.3%) |
Disability Class: Self-Care Difficulty
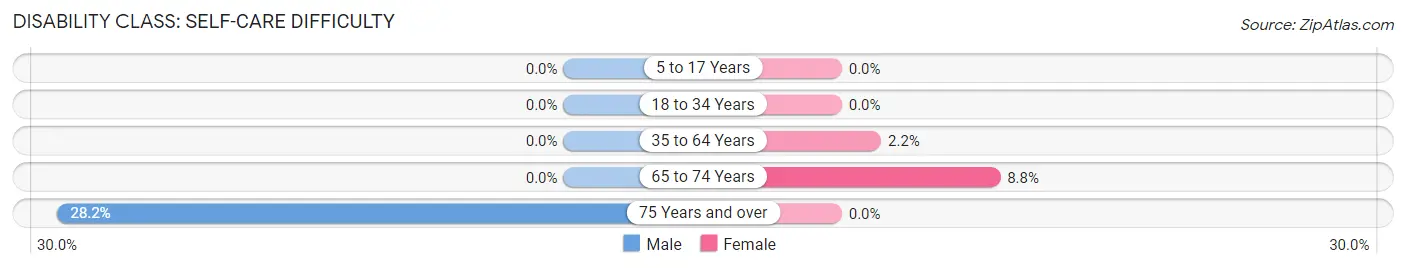
| Age Bracket | Male | Female |
| 5 to 17 Years | 0 (0.0%) | 0 (0.0%) |
| 18 to 34 Years | 0 (0.0%) | 0 (0.0%) |
| 35 to 64 Years | 0 (0.0%) | 7 (2.2%) |
| 65 to 74 Years | 0 (0.0%) | 3 (8.8%) |
| 75 Years and over | 20 (28.2%) | 0 (0.0%) |
Technology Access in Tioga
Computing Device Access in Tioga
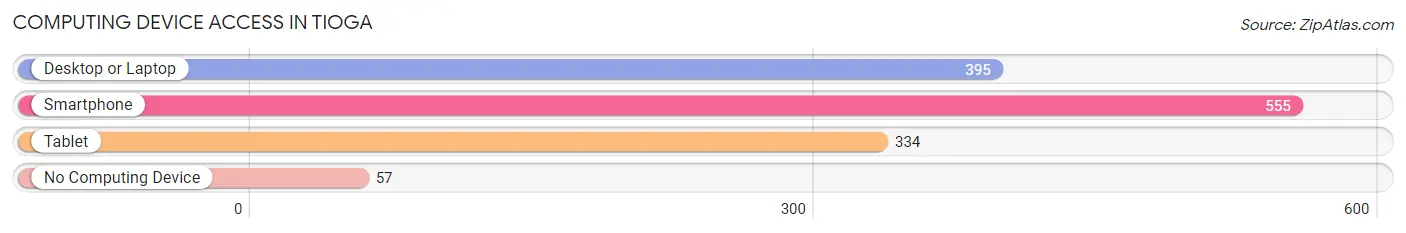
| Device Type | # Households | % Households |
| Desktop or Laptop | 395 | 57.4% |
| Smartphone | 555 | 80.7% |
| Tablet | 334 | 48.5% |
| No Computing Device | 57 | 8.3% |
| Total | 688 | 100.0% |
Internet Access in Tioga
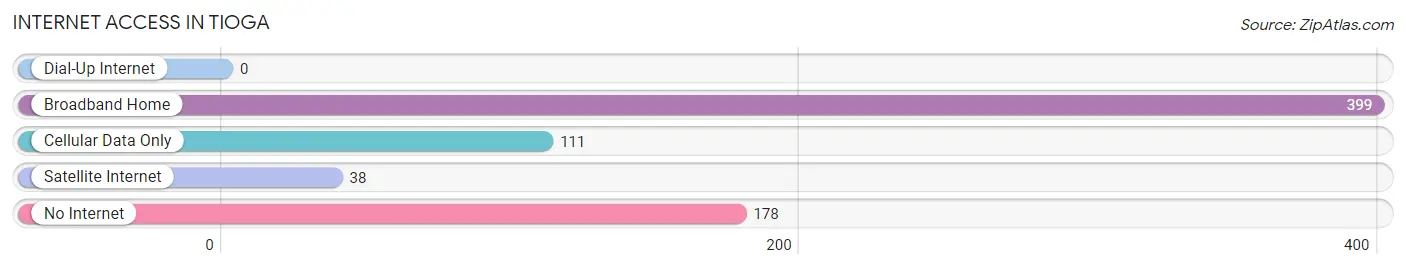
| Internet Type | # Households | % Households |
| Dial-Up Internet | 0 | 0.0% |
| Broadband Home | 399 | 58.0% |
| Cellular Data Only | 111 | 16.1% |
| Satellite Internet | 38 | 5.5% |
| No Internet | 178 | 25.9% |
| Total | 688 | 100.0% |
Tioga Summary
Tioga is a city located in Williams County, North Dakota, United States. The population was 1,230 at the 2010 census. It is the county seat of Williams County.
History
The area that is now Tioga was first settled in 1887. The city was named after the Tioga River, which was named by the Dakota Sioux. The city was incorporated in 1906.
Geography
Tioga is located at 47 25 25 North 103 17 45 West 47 423750 103 295890
According to the United States Census Bureau, the city has a total area of 1.2 square miles (3.1 km2), all of it land.
Economy
The economy of Tioga is largely based on agriculture and oil production. The city is home to several oil and gas companies, including Continental Resources, Hess Corporation, and Marathon Oil. The city also has a number of small businesses, including restaurants, retail stores, and service providers.
Demographics
As of the census of 2010, there were 1,230 people, 517 households, and 315 families residing in the city. The population density was 1,019.2 people per square mile (393.3/km2). There were 567 housing units at an average density of 472.5 per square mile (182.3/km2). The racial makeup of the city was 97.2% White, 0.2% African American, 0.7% Native American, 0.2% Asian, 0.2% from other races, and 1.7% from two or more races. Hispanic or Latino of any race were 1.3% of the population.
There were 517 households, out of which 28.2% had children under the age of 18 living with them, 48.3% were married couples living together, 8.3% had a female householder with no husband present, and 39.2% were non-families. 34.7% of all households were made up of individuals, and 17.2% had someone living alone who was 65 years of age or older. The average household size was 2.30 and the average family size was 2.97.
In the city, the population was spread out, with 24.7% under the age of 18, 6.2% from 18 to 24, 24.2% from 25 to 44, 24.2% from 45 to 64, and 20.7% who were 65 years of age or older. The median age was 41 years. For every 100 females, there were 92.2 males. For every 100 females age 18 and over, there were 88.2 males.
The median income for a household in the city was $35,000, and the median income for a family was $45,000. Males had a median income of $31,000 versus $20,000 for females. The per capita income for the city was $18,000. About 8.2% of families and 11.2% of the population were below the poverty line, including 14.2% of those under age 18 and 8.2% of those age 65 or over.
Common Questions
What is the Total Population of Tioga?
Total Population of Tioga is 1,376.
What is the Total Male Population of Tioga?
Total Male Population of Tioga is 754.
What is the Total Female Population of Tioga?
Total Female Population of Tioga is 622.
What is the Ratio of Males per 100 Females in Tioga?
There are 121.22 Males per 100 Females in Tioga.
What is the Ratio of Females per 100 Males in Tioga?
There are 82.49 Females per 100 Males in Tioga.
What is the Median Population Age in Tioga?
Median Population Age in Tioga is 36.0 Years.
What is the Average Family Size in Tioga
Average Family Size in Tioga is 2.9 People.
What is the Average Household Size in Tioga
Average Household Size in Tioga is 1.9 People.
What is Per Capita Income in Tioga?
Per Capita income in Tioga is $40,409.
What is the Median Family Income in Tioga?
Median Family Income in Tioga is $98,819.
What is the Median Household income in Tioga?
Median Household Income in Tioga is $63,920.
What is Income or Wage Gap in Tioga?
Income or Wage Gap in Tioga is 48.8%.
Women in Tioga earn 51.2 cents for every dollar earned by a man.
What is Inequality or Gini Index in Tioga?
Inequality or Gini Index in Tioga is 0.40.
How Large is the Labor Force in Tioga?
There are 718 People in the Labor Forcein in Tioga.
What is the Percentage of People in the Labor Force in Tioga?
61.3% of People are in the Labor Force in Tioga.
What is the Unemployment Rate in Tioga?
Unemployment Rate in Tioga is 4.9%.