Sawyer, ND
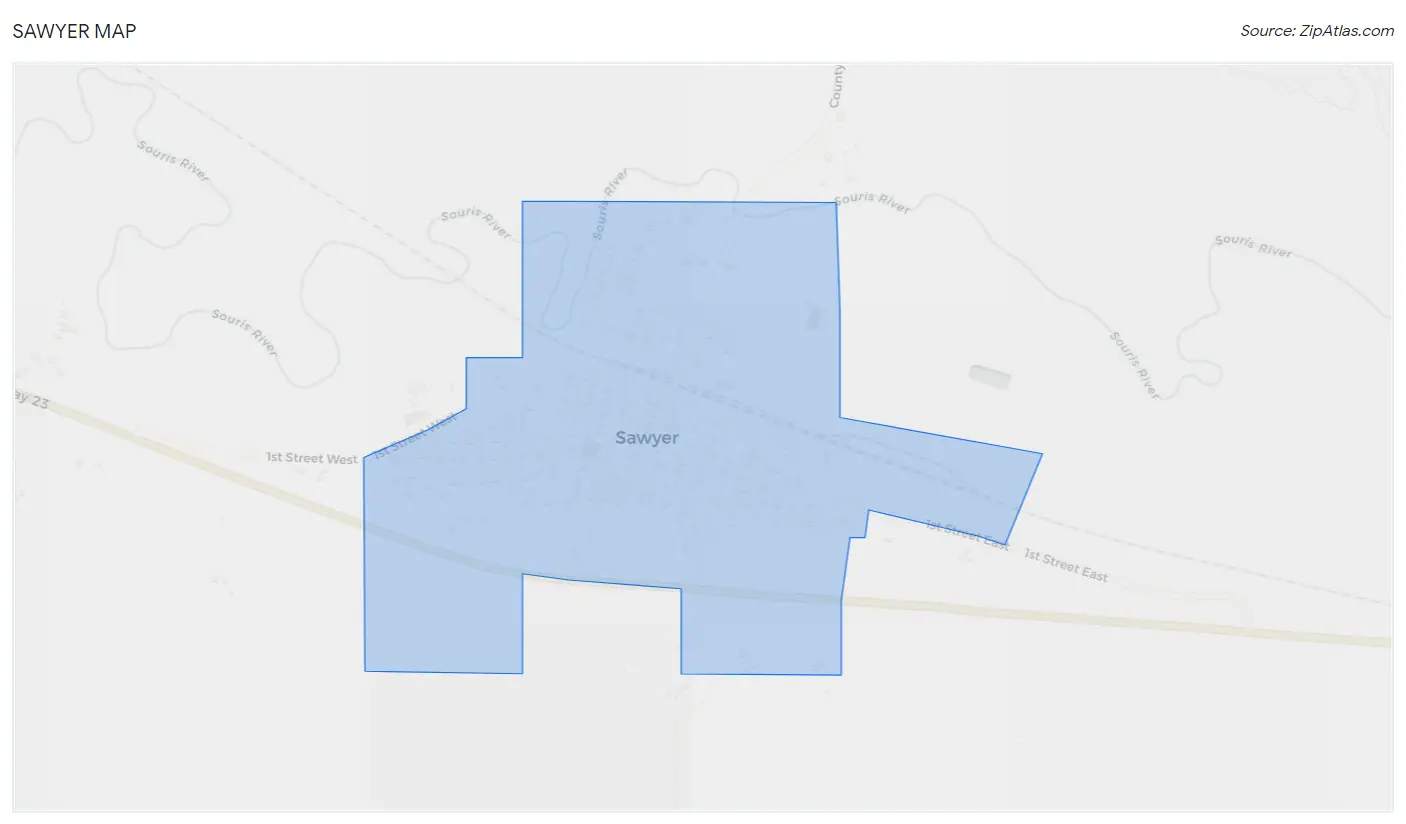
Sawyer Map
Sawyer Overview
261
TOTAL POPULATION
132
MALE POPULATION
129
FEMALE POPULATION
102.33
MALES / 100 FEMALES
97.73
FEMALES / 100 MALES
43.7
MEDIAN AGE
2.6
AVG FAMILY SIZE
2.4
AVG HOUSEHOLD SIZE
$33,079
PER CAPITA INCOME
$90,000
AVG FAMILY INCOME
$74,375
AVG HOUSEHOLD INCOME
0.38
INEQUALITY / GINI INDEX
152
LABOR FORCE [ PEOPLE ]
69.7%
PERCENT IN LABOR FORCE
0.7%
UNEMPLOYMENT RATE
Sawyer Zip Codes
Sawyer Area Codes
Race in Sawyer
The most populous races in Sawyer are White / Caucasian (245 | 93.9%), Two or more Races (11 | 4.2%), and Hispanic or Latino (8 | 3.1%).
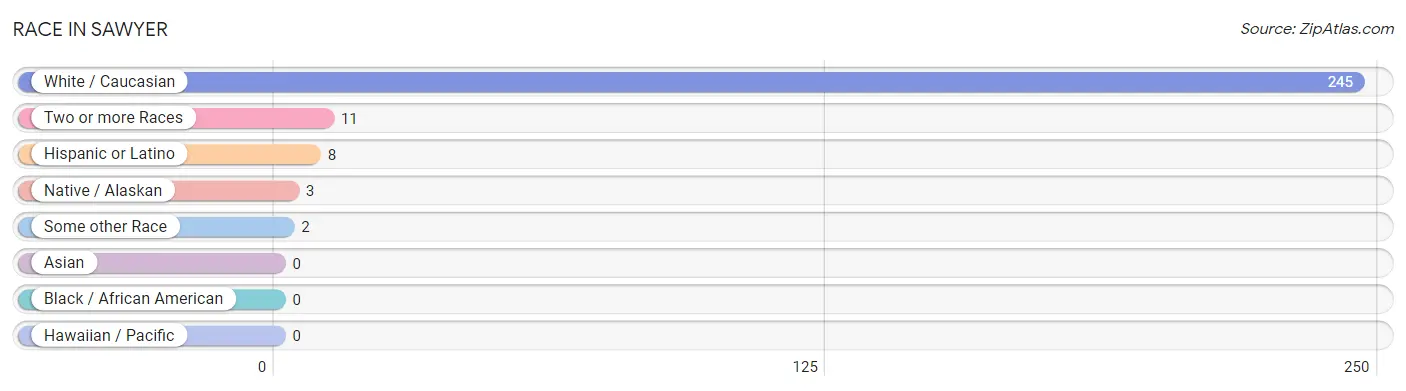
| Race | # Population | % Population |
| Asian | 0 | 0.0% |
| Black / African American | 0 | 0.0% |
| Hawaiian / Pacific | 0 | 0.0% |
| Hispanic or Latino | 8 | 3.1% |
| Native / Alaskan | 3 | 1.1% |
| White / Caucasian | 245 | 93.9% |
| Two or more Races | 11 | 4.2% |
| Some other Race | 2 | 0.8% |
| Total | 261 | 100.0% |
Ancestry in Sawyer
The most populous ancestries reported in Sawyer are German (145 | 55.6%), Norwegian (93 | 35.6%), Irish (46 | 17.6%), English (19 | 7.3%), and Swedish (17 | 6.5%), together accounting for 122.6% of all Sawyer residents.
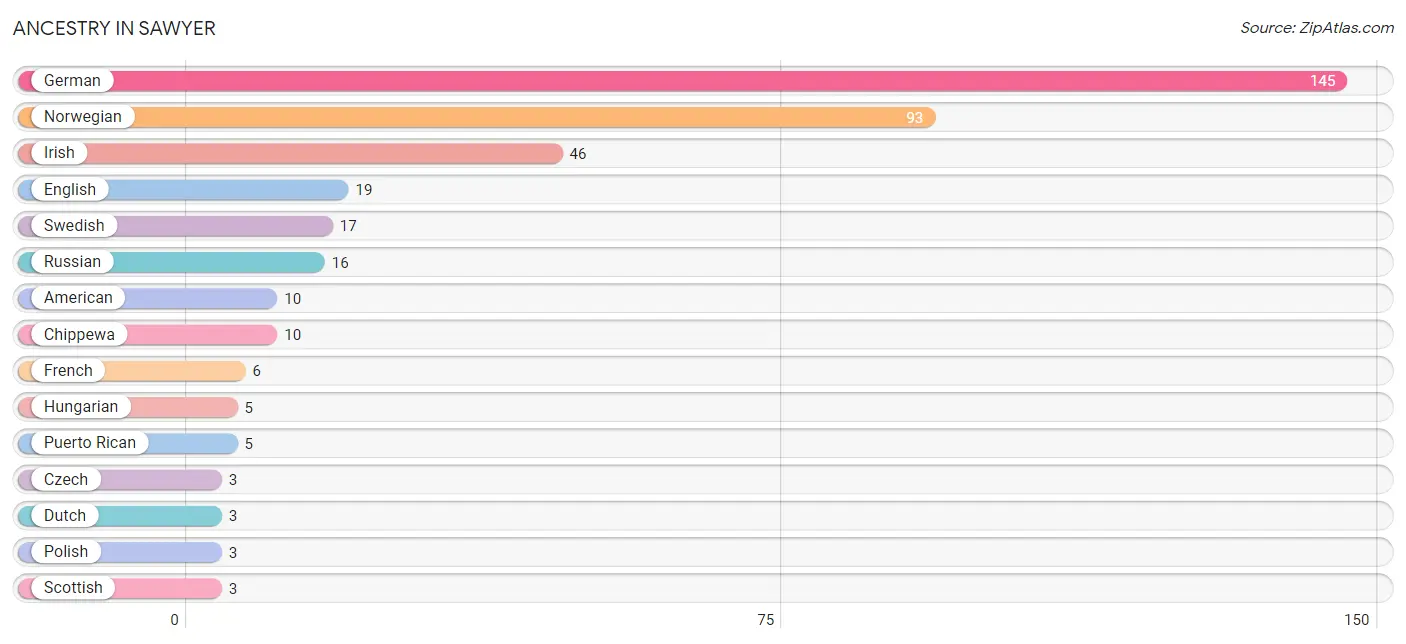
| Ancestry | # Population | % Population |
| American | 10 | 3.8% |
| Central American | 2 | 0.8% |
| Chippewa | 10 | 3.8% |
| Czech | 3 | 1.1% |
| Danish | 2 | 0.8% |
| Dutch | 3 | 1.1% |
| English | 19 | 7.3% |
| European | 2 | 0.8% |
| French | 6 | 2.3% |
| French Canadian | 2 | 0.8% |
| German | 145 | 55.6% |
| Honduran | 2 | 0.8% |
| Hungarian | 5 | 1.9% |
| Irish | 46 | 17.6% |
| Italian | 2 | 0.8% |
| Norwegian | 93 | 35.6% |
| Polish | 3 | 1.1% |
| Puerto Rican | 5 | 1.9% |
| Romanian | 2 | 0.8% |
| Russian | 16 | 6.1% |
| Scandinavian | 2 | 0.8% |
| Scottish | 3 | 1.1% |
| Sioux | 3 | 1.1% |
| Spanish | 1 | 0.4% |
| Swedish | 17 | 6.5% | View All 25 Rows |
Immigrants in Sawyer
The most numerous immigrant groups reported in Sawyer came from Central America (1 | 0.4%), Honduras (1 | 0.4%), and Latin America (1 | 0.4%), together accounting for 1.1% of all Sawyer residents.
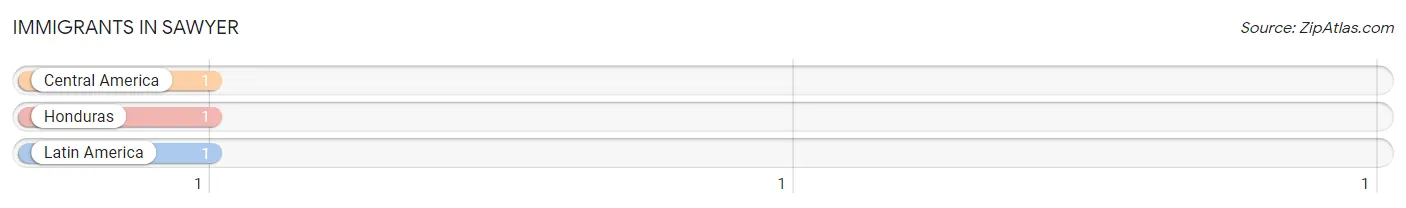
| Immigration Origin | # Population | % Population |
| Central America | 1 | 0.4% |
| Honduras | 1 | 0.4% |
| Latin America | 1 | 0.4% | View All 3 Rows |
Sex and Age in Sawyer
Sex and Age in Sawyer
The most populous age groups in Sawyer are 30 to 34 Years (26 | 19.7%) for men and 50 to 54 Years (21 | 16.3%) for women.
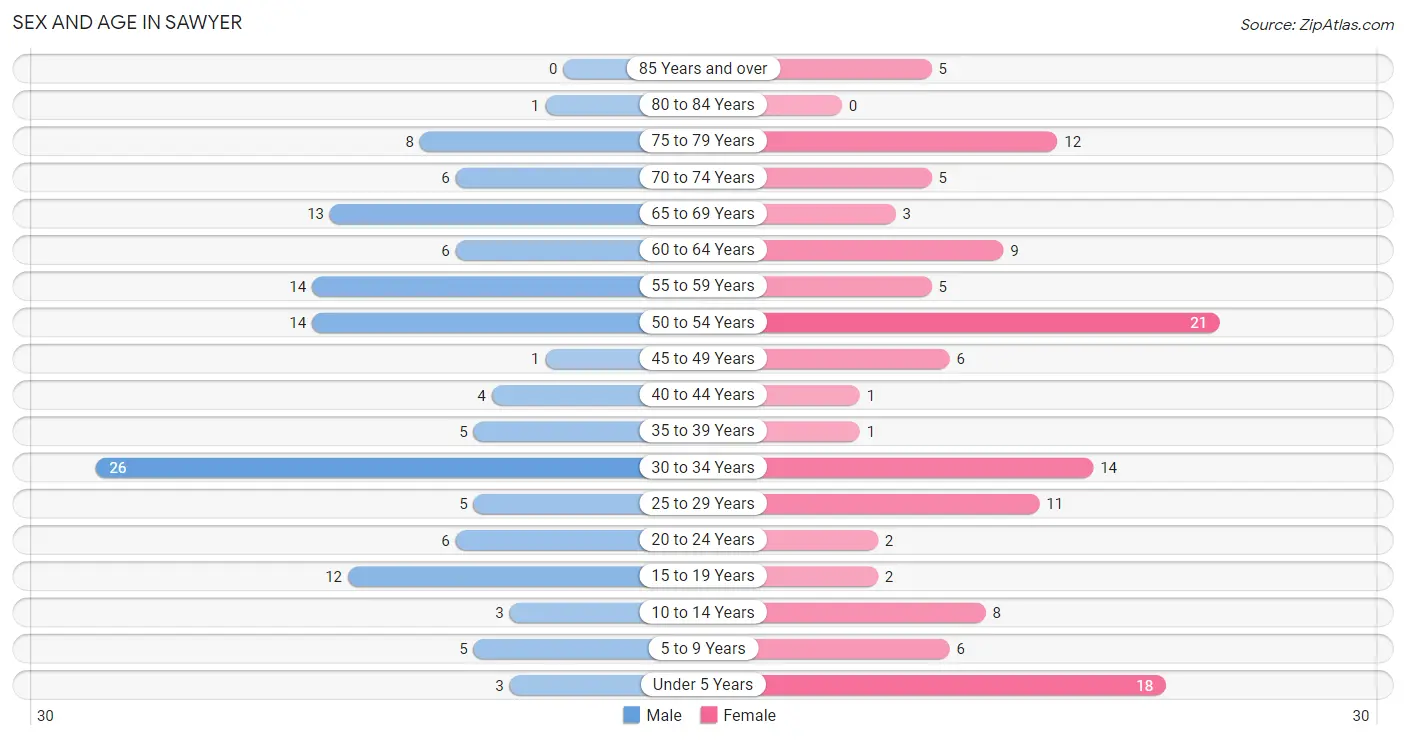
| Age Bracket | Male | Female |
| Under 5 Years | 3 (2.3%) | 18 (14.0%) |
| 5 to 9 Years | 5 (3.8%) | 6 (4.6%) |
| 10 to 14 Years | 3 (2.3%) | 8 (6.2%) |
| 15 to 19 Years | 12 (9.1%) | 2 (1.5%) |
| 20 to 24 Years | 6 (4.5%) | 2 (1.5%) |
| 25 to 29 Years | 5 (3.8%) | 11 (8.5%) |
| 30 to 34 Years | 26 (19.7%) | 14 (10.8%) |
| 35 to 39 Years | 5 (3.8%) | 1 (0.8%) |
| 40 to 44 Years | 4 (3.0%) | 1 (0.8%) |
| 45 to 49 Years | 1 (0.8%) | 6 (4.6%) |
| 50 to 54 Years | 14 (10.6%) | 21 (16.3%) |
| 55 to 59 Years | 14 (10.6%) | 5 (3.9%) |
| 60 to 64 Years | 6 (4.5%) | 9 (7.0%) |
| 65 to 69 Years | 13 (9.9%) | 3 (2.3%) |
| 70 to 74 Years | 6 (4.5%) | 5 (3.9%) |
| 75 to 79 Years | 8 (6.1%) | 12 (9.3%) |
| 80 to 84 Years | 1 (0.8%) | 0 (0.0%) |
| 85 Years and over | 0 (0.0%) | 5 (3.9%) |
| Total | 132 (100.0%) | 129 (100.0%) |
Families and Households in Sawyer
Median Family Size in Sawyer
The median family size in Sawyer is 2.62 persons per family, with single male/father families (9 | 10.0%) accounting for the largest median family size of 2.89 persons per family. On the other hand, single female/mother families (4 | 4.4%) represent the smallest median family size with 2.00 persons per family.
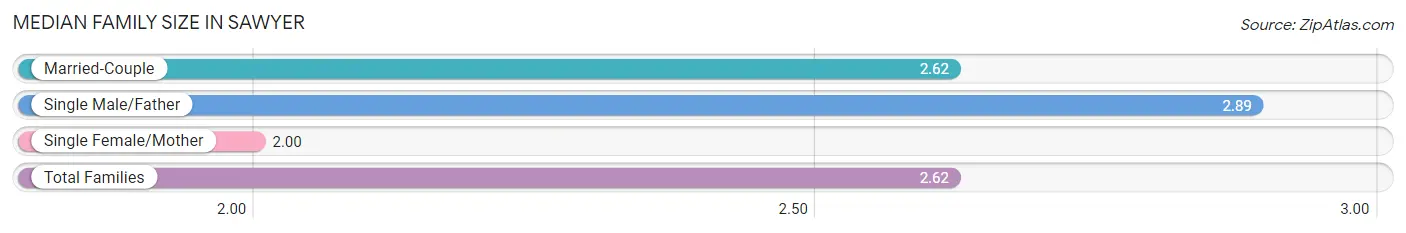
| Family Type | # Families | Family Size |
| Married-Couple | 77 (85.6%) | 2.62 |
| Single Male/Father | 9 (10.0%) | 2.89 |
| Single Female/Mother | 4 (4.4%) | 2.00 |
| Total Families | 90 (100.0%) | 2.62 |
Median Household Size in Sawyer
The median household size in Sawyer is 2.42 persons per household, with single male/father households (9 | 8.3%) accounting for the largest median household size of 2.89 persons per household. non-family households (18 | 16.7%) represent the smallest median household size with 1.39 persons per household.
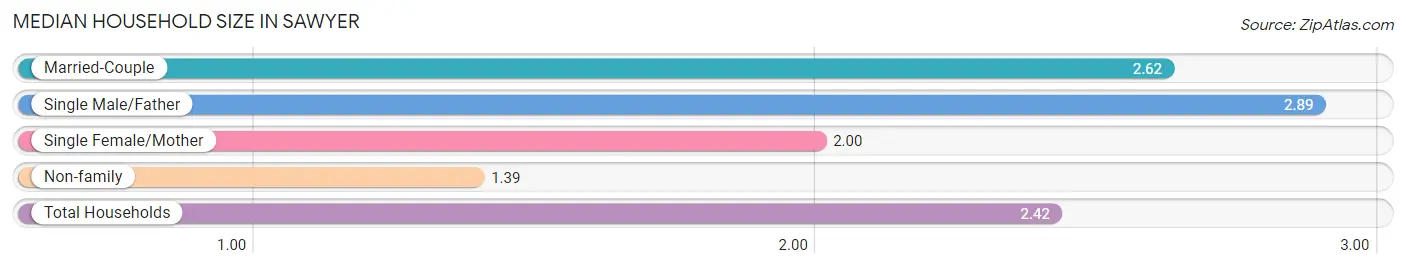
| Household Type | # Households | Household Size |
| Married-Couple | 77 (71.3%) | 2.62 |
| Single Male/Father | 9 (8.3%) | 2.89 |
| Single Female/Mother | 4 (3.7%) | 2.00 |
| Non-family | 18 (16.7%) | 1.39 |
| Total Households | 108 (100.0%) | 2.42 |
Household Size by Marriage Status in Sawyer
Out of a total of 108 households in Sawyer, 90 (83.3%) are family households, while 18 (16.7%) are nonfamily households. The most numerous type of family households are 2-person households, comprising 61, and the most common type of nonfamily households are 1-person households, comprising 11.
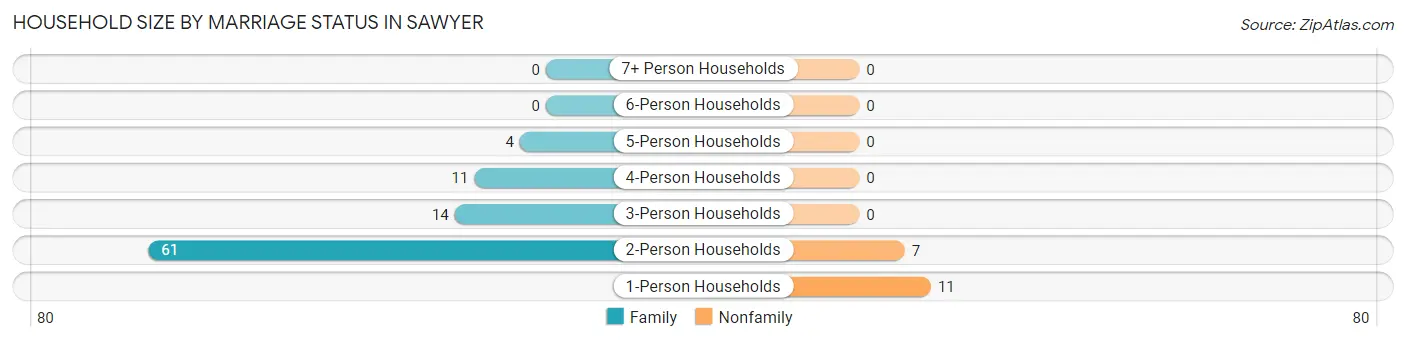
| Household Size | Family Households | Nonfamily Households |
| 1-Person Households | - | 11 (10.2%) |
| 2-Person Households | 61 (56.5%) | 7 (6.5%) |
| 3-Person Households | 14 (13.0%) | 0 (0.0%) |
| 4-Person Households | 11 (10.2%) | 0 (0.0%) |
| 5-Person Households | 4 (3.7%) | 0 (0.0%) |
| 6-Person Households | 0 (0.0%) | 0 (0.0%) |
| 7+ Person Households | 0 (0.0%) | 0 (0.0%) |
| Total | 90 (83.3%) | 18 (16.7%) |
Female Fertility in Sawyer
Fertility by Age in Sawyer
Average fertility rate in Sawyer is 54.0 births per 1,000 women. Women in the age bracket of 20 to 34 years have the highest fertility rate with 74.0 births per 1,000 women. Women in the age bracket of 20 to 34 years acount for 100.0% of all women with births.
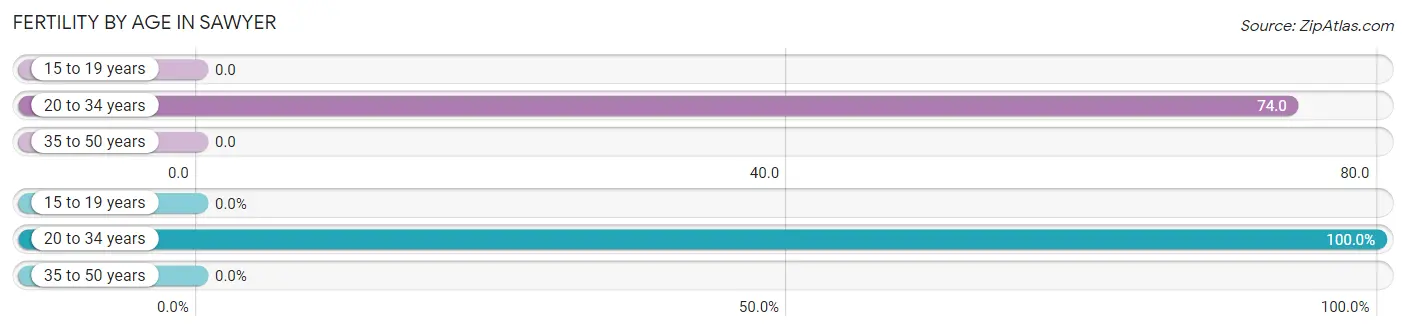
| Age Bracket | Women with Births | Births / 1,000 Women |
| 15 to 19 years | 0 (0.0%) | 0.0 |
| 20 to 34 years | 2 (100.0%) | 74.0 |
| 35 to 50 years | 0 (0.0%) | 0.0 |
| Total | 2 (100.0%) | 54.0 |
Fertility by Age by Marriage Status in Sawyer
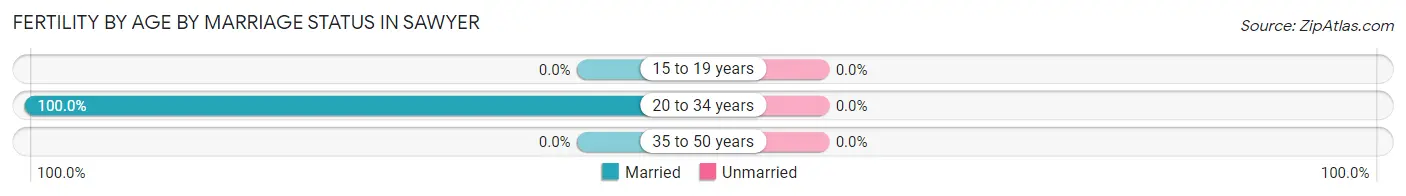
| Age Bracket | Married | Unmarried |
| 15 to 19 years | 0 (0.0%) | 0 (0.0%) |
| 20 to 34 years | 2 (100.0%) | 0 (0.0%) |
| 35 to 50 years | 0 (0.0%) | 0 (0.0%) |
| Total | 2 (100.0%) | 0 (0.0%) |
Fertility by Education in Sawyer
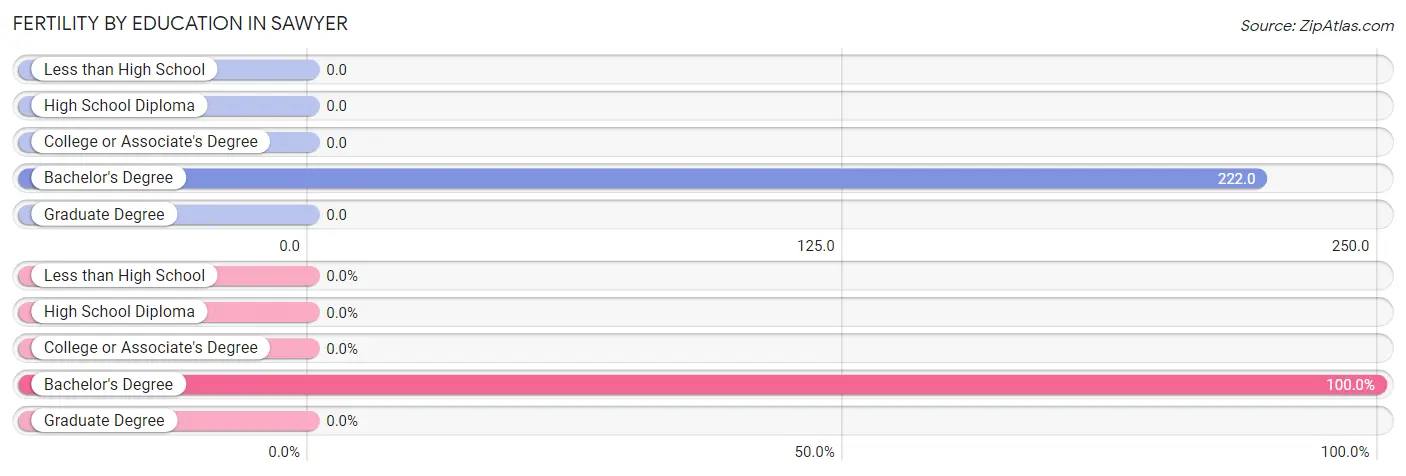
| Educational Attainment | Women with Births | Births / 1,000 Women |
| Less than High School | 0 (0.0%) | 0.0 |
| High School Diploma | 0 (0.0%) | 0.0 |
| College or Associate's Degree | 0 (0.0%) | 0.0 |
| Bachelor's Degree | 2 (100.0%) | 222.0 |
| Graduate Degree | 0 (0.0%) | 0.0 |
| Total | 2 (100.0%) | 54.0 |
Fertility by Education by Marriage Status in Sawyer
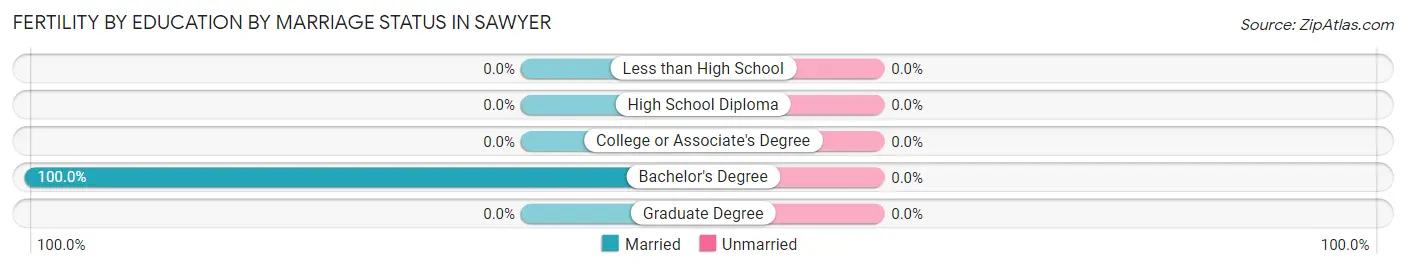
| Educational Attainment | Married | Unmarried |
| Less than High School | 0 (0.0%) | 0 (0.0%) |
| High School Diploma | 0 (0.0%) | 0 (0.0%) |
| College or Associate's Degree | 0 (0.0%) | 0 (0.0%) |
| Bachelor's Degree | 2 (100.0%) | 0 (0.0%) |
| Graduate Degree | 0 (0.0%) | 0 (0.0%) |
| Total | 2 (100.0%) | 0 (0.0%) |
Income in Sawyer
Income Overview in Sawyer
Per Capita Income in Sawyer is $33,079, while median incomes of families and households are $90,000 and $74,375 respectively.
| Characteristic | Number | Measure |
| Per Capita Income | 261 | $33,079 |
| Median Family Income | 90 | $90,000 |
| Mean Family Income | 90 | $89,803 |
| Median Household Income | 108 | $74,375 |
| Mean Household Income | 108 | $79,881 |
| Income Deficit | 90 | $0 |
| Wage / Income Gap (%) | 261 | 0.00% |
| Wage / Income Gap ($) | 261 | 100.00¢ per $1 |
| Gini / Inequality Index | 261 | 0.38 |
Earnings by Sex in Sawyer
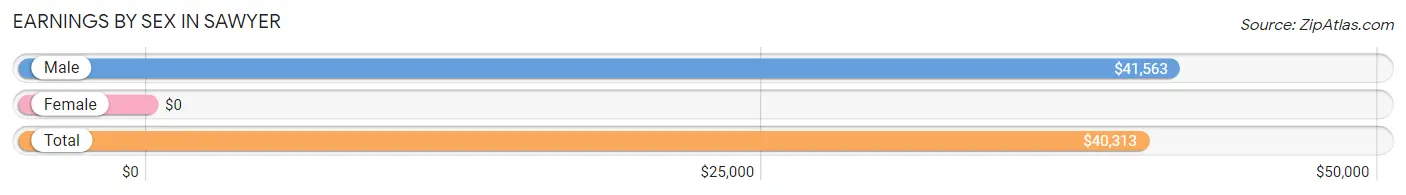
| Sex | Number | Average Earnings |
| Male | 91 (55.5%) | $41,563 |
| Female | 73 (44.5%) | $0 |
| Total | 164 (100.0%) | $40,313 |
Earnings by Sex by Income Bracket in Sawyer
The most common earnings brackets in Sawyer are $55,000 to $64,999 for men (14 | 15.4%) and $10,000 to $12,499 for women (17 | 23.3%).
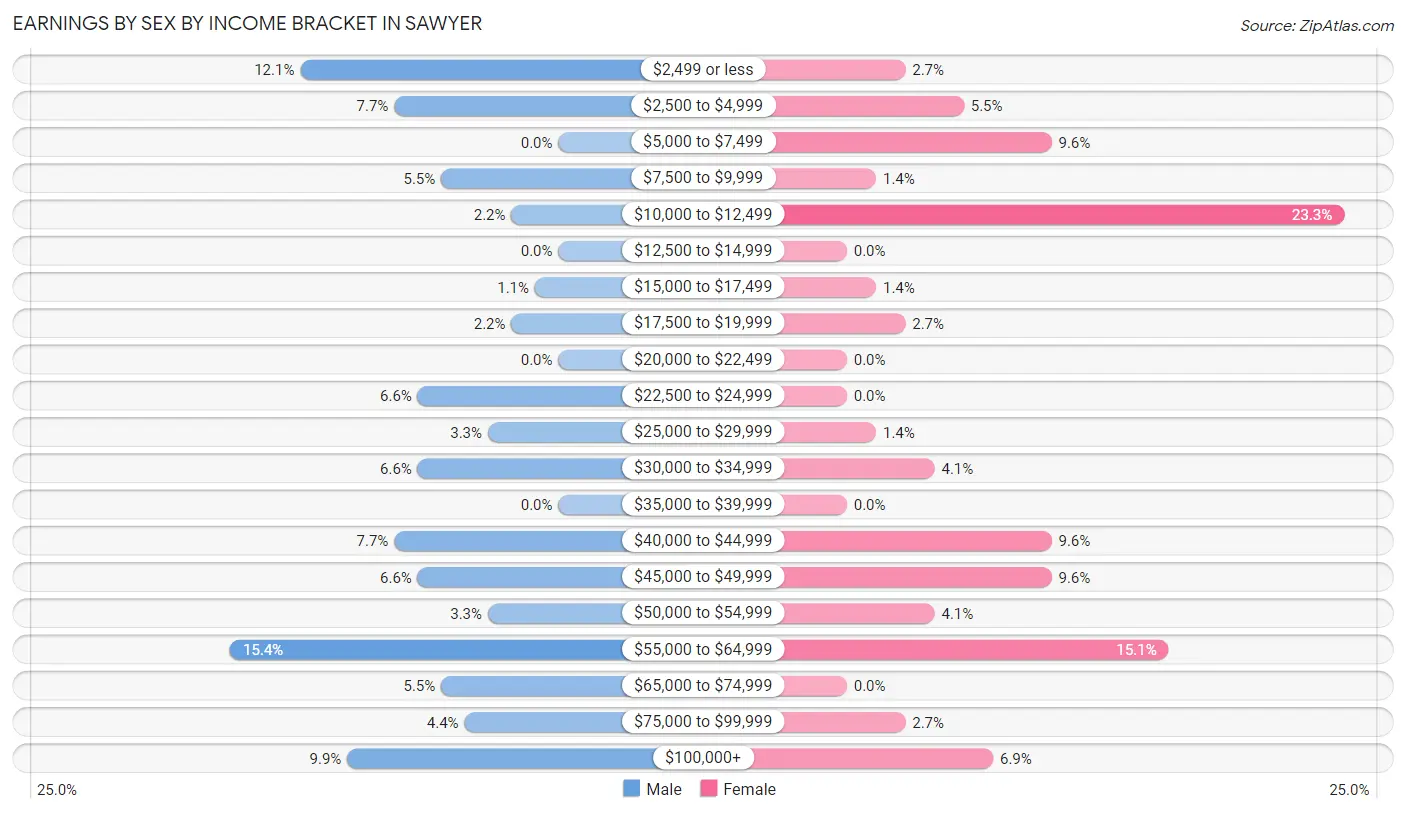
| Income | Male | Female |
| $2,499 or less | 11 (12.1%) | 2 (2.7%) |
| $2,500 to $4,999 | 7 (7.7%) | 4 (5.5%) |
| $5,000 to $7,499 | 0 (0.0%) | 7 (9.6%) |
| $7,500 to $9,999 | 5 (5.5%) | 1 (1.4%) |
| $10,000 to $12,499 | 2 (2.2%) | 17 (23.3%) |
| $12,500 to $14,999 | 0 (0.0%) | 0 (0.0%) |
| $15,000 to $17,499 | 1 (1.1%) | 1 (1.4%) |
| $17,500 to $19,999 | 2 (2.2%) | 2 (2.7%) |
| $20,000 to $22,499 | 0 (0.0%) | 0 (0.0%) |
| $22,500 to $24,999 | 6 (6.6%) | 0 (0.0%) |
| $25,000 to $29,999 | 3 (3.3%) | 1 (1.4%) |
| $30,000 to $34,999 | 6 (6.6%) | 3 (4.1%) |
| $35,000 to $39,999 | 0 (0.0%) | 0 (0.0%) |
| $40,000 to $44,999 | 7 (7.7%) | 7 (9.6%) |
| $45,000 to $49,999 | 6 (6.6%) | 7 (9.6%) |
| $50,000 to $54,999 | 3 (3.3%) | 3 (4.1%) |
| $55,000 to $64,999 | 14 (15.4%) | 11 (15.1%) |
| $65,000 to $74,999 | 5 (5.5%) | 0 (0.0%) |
| $75,000 to $99,999 | 4 (4.4%) | 2 (2.7%) |
| $100,000+ | 9 (9.9%) | 5 (6.9%) |
| Total | 91 (100.0%) | 73 (100.0%) |
Earnings by Sex by Educational Attainment in Sawyer
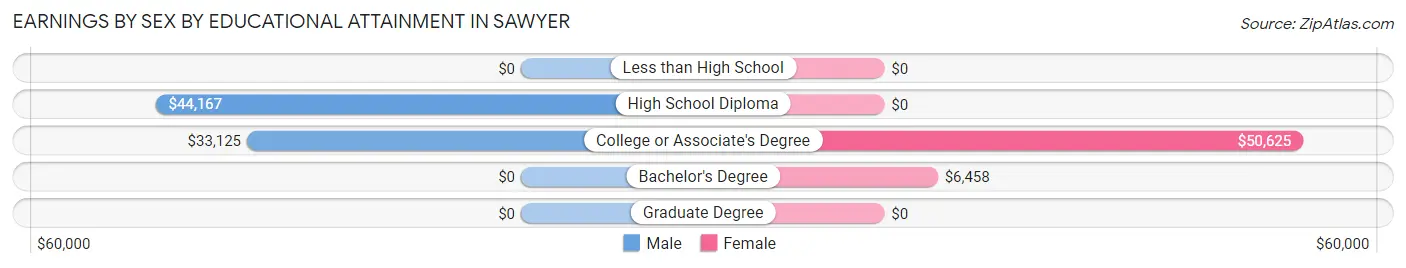
| Educational Attainment | Male Income | Female Income |
| Less than High School | - | - |
| High School Diploma | $44,167 | $0 |
| College or Associate's Degree | $33,125 | $50,625 |
| Bachelor's Degree | - | - |
| Graduate Degree | - | - |
| Total | $45,500 | $0 |
Family Income in Sawyer
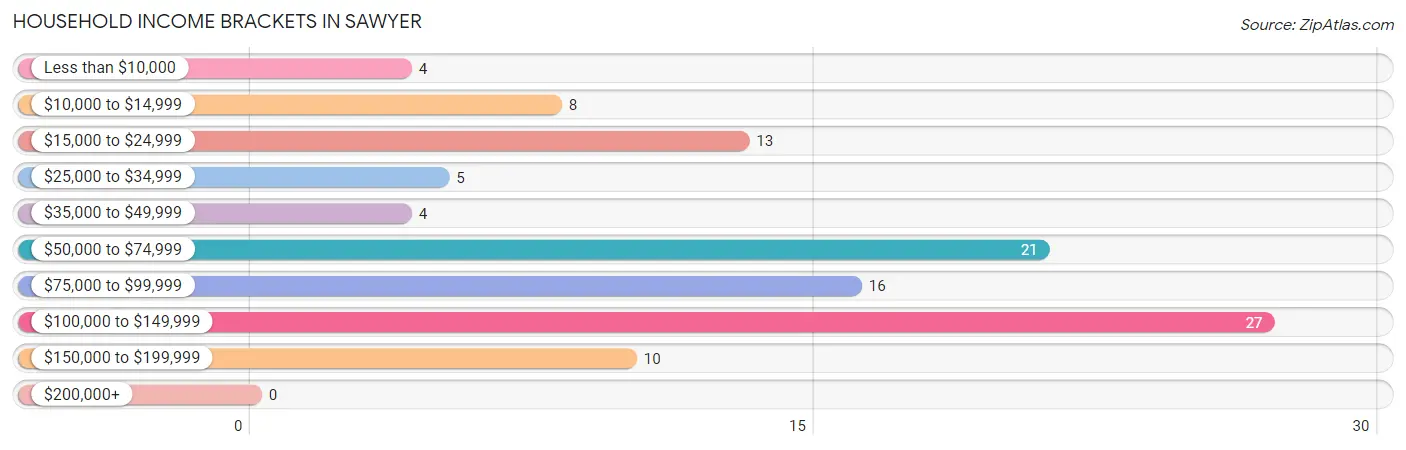
Family Income Brackets in Sawyer
According to the Sawyer family income data, there are 27 families falling into the $100,000 to $149,999 income range, which is the most common income bracket and makes up 30.0% of all families.
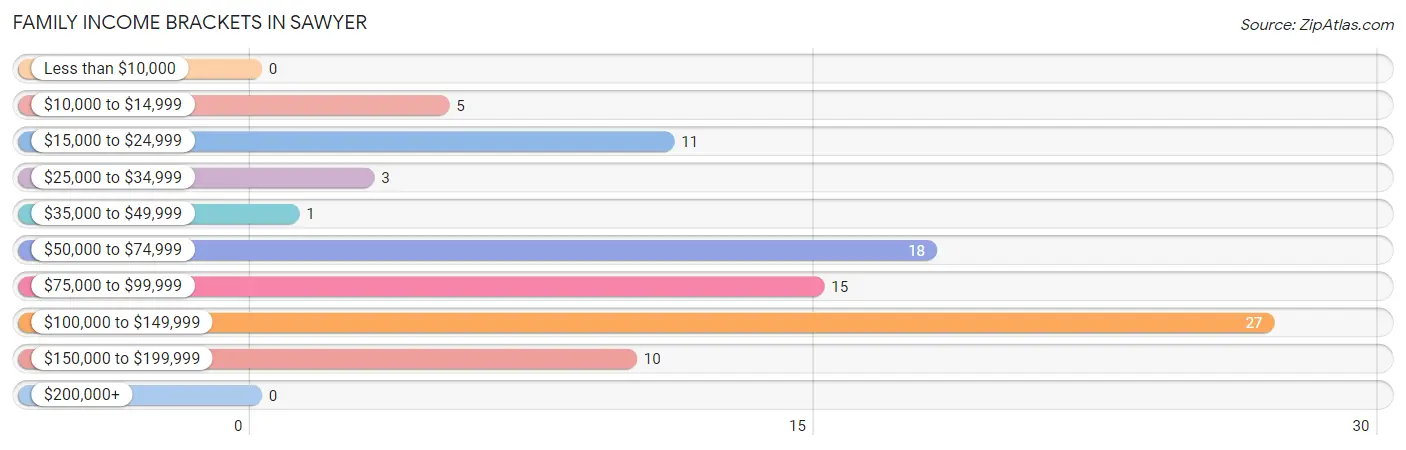
| Income Bracket | # Families | % Families |
| Less than $10,000 | 0 | 0.0% |
| $10,000 to $14,999 | 5 | 5.6% |
| $15,000 to $24,999 | 11 | 12.2% |
| $25,000 to $34,999 | 3 | 3.3% |
| $35,000 to $49,999 | 1 | 1.1% |
| $50,000 to $74,999 | 18 | 20.0% |
| $75,000 to $99,999 | 15 | 16.7% |
| $100,000 to $149,999 | 27 | 30.0% |
| $150,000 to $199,999 | 10 | 11.1% |
| $200,000+ | 0 | 0.0% |
Family Income by Famaliy Size in Sawyer
3-person families (14 | 15.6%) account for the highest median family income in Sawyer with $185,313 per family, while 3-person families (14 | 15.6%) have the highest median income of $61,771 per family member.
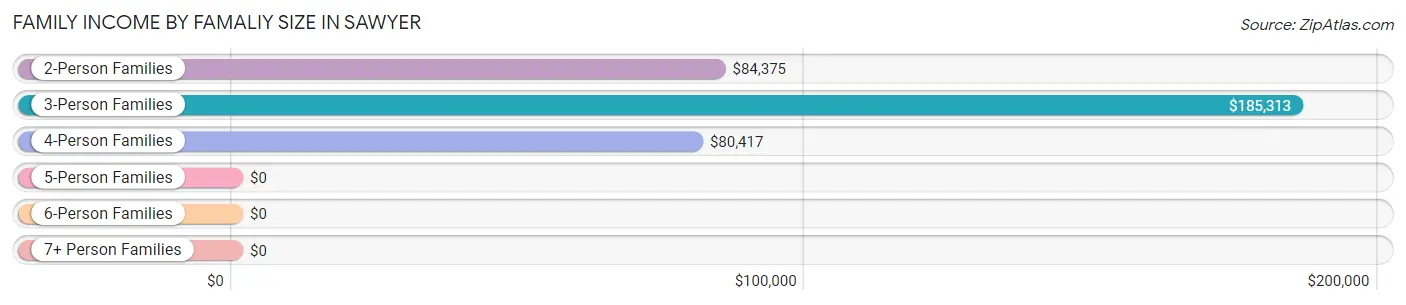
| Income Bracket | # Families | Median Income |
| 2-Person Families | 61 (67.8%) | $84,375 |
| 3-Person Families | 14 (15.6%) | $185,313 |
| 4-Person Families | 11 (12.2%) | $80,417 |
| 5-Person Families | 4 (4.4%) | $0 |
| 6-Person Families | 0 (0.0%) | $0 |
| 7+ Person Families | 0 (0.0%) | $0 |
| Total | 90 (100.0%) | $90,000 |
Family Income by Number of Earners in Sawyer
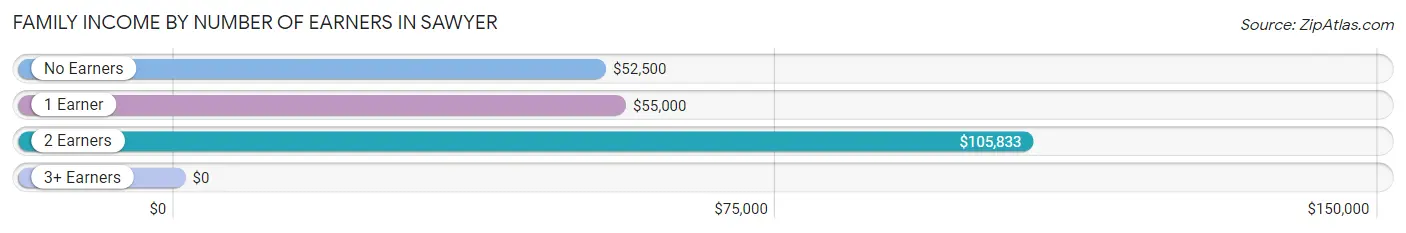
| Number of Earners | # Families | Median Income |
| No Earners | 10 (11.1%) | $52,500 |
| 1 Earner | 10 (11.1%) | $55,000 |
| 2 Earners | 66 (73.3%) | $105,833 |
| 3+ Earners | 4 (4.4%) | $0 |
| Total | 90 (100.0%) | $90,000 |
Household Income in Sawyer
Household Income Brackets in Sawyer
With 27 households falling in the category, the $100,000 to $149,999 income range is the most frequent in Sawyer, accounting for 25.0% of all households.
| Income Bracket | # Households | % Households |
| Less than $10,000 | 4 | 3.7% |
| $10,000 to $14,999 | 8 | 7.4% |
| $15,000 to $24,999 | 13 | 12.0% |
| $25,000 to $34,999 | 5 | 4.6% |
| $35,000 to $49,999 | 4 | 3.7% |
| $50,000 to $74,999 | 21 | 19.4% |
| $75,000 to $99,999 | 16 | 14.8% |
| $100,000 to $149,999 | 27 | 25.0% |
| $150,000 to $199,999 | 10 | 9.3% |
| $200,000+ | 0 | 0.0% |
Household Income by Householder Age in Sawyer
The median household income in Sawyer is $74,375, with the highest median household income of $116,875 found in the 25 to 44 years age bracket for the primary householder. A total of 36 households (33.3%) fall into this category. Meanwhile, the 15 to 24 years age bracket for the primary householder has the lowest median household income of $0, with 1 households (0.9%) in this group.
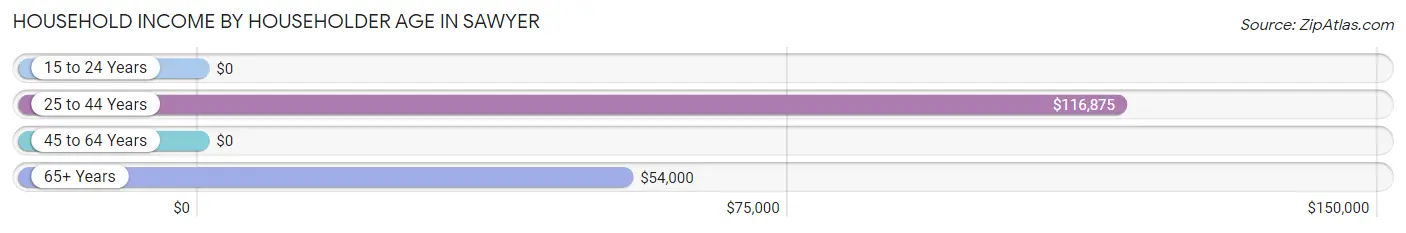
| Income Bracket | # Households | Median Income |
| 15 to 24 Years | 1 (0.9%) | $0 |
| 25 to 44 Years | 36 (33.3%) | $116,875 |
| 45 to 64 Years | 43 (39.8%) | $0 |
| 65+ Years | 28 (25.9%) | $54,000 |
| Total | 108 (100.0%) | $74,375 |
Poverty in Sawyer
Income Below Poverty by Sex and Age in Sawyer
With 10.6% poverty level for males and 7.0% for females among the residents of Sawyer, 65 to 74 year old males and 55 to 64 year old females are the most vulnerable to poverty, with 6 males (31.6%) and 5 females (35.7%) in their respective age groups living below the poverty level.
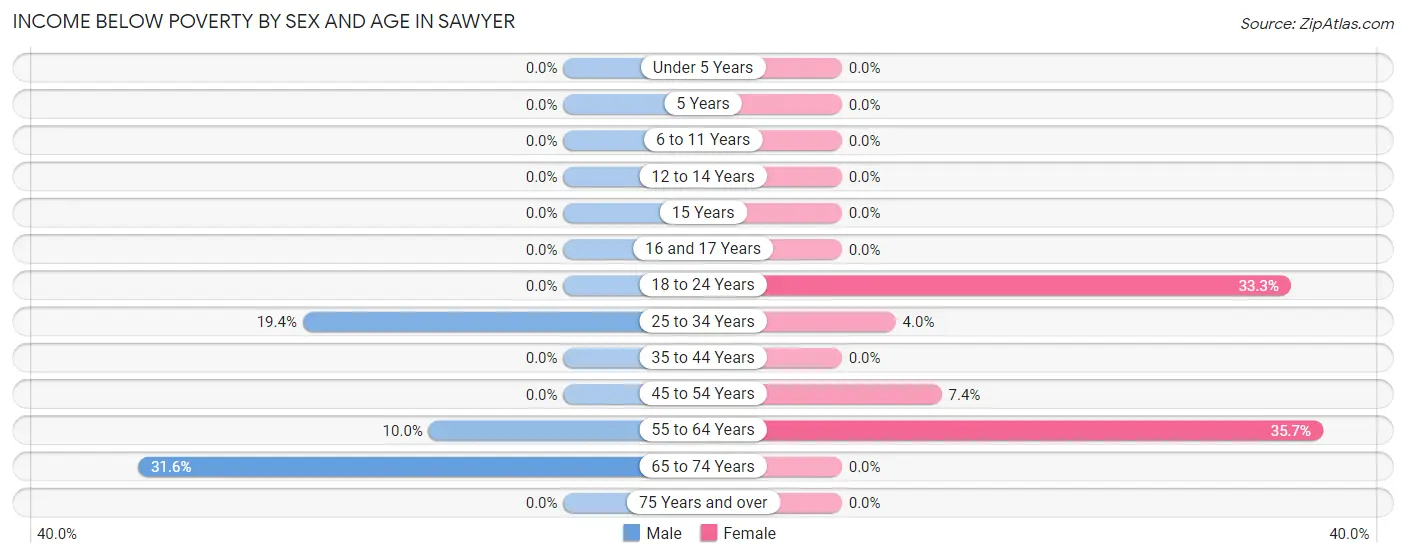
| Age Bracket | Male | Female |
| Under 5 Years | 0 (0.0%) | 0 (0.0%) |
| 5 Years | 0 (0.0%) | 0 (0.0%) |
| 6 to 11 Years | 0 (0.0%) | 0 (0.0%) |
| 12 to 14 Years | 0 (0.0%) | 0 (0.0%) |
| 15 Years | 0 (0.0%) | 0 (0.0%) |
| 16 and 17 Years | 0 (0.0%) | 0 (0.0%) |
| 18 to 24 Years | 0 (0.0%) | 1 (33.3%) |
| 25 to 34 Years | 6 (19.4%) | 1 (4.0%) |
| 35 to 44 Years | 0 (0.0%) | 0 (0.0%) |
| 45 to 54 Years | 0 (0.0%) | 2 (7.4%) |
| 55 to 64 Years | 2 (10.0%) | 5 (35.7%) |
| 65 to 74 Years | 6 (31.6%) | 0 (0.0%) |
| 75 Years and over | 0 (0.0%) | 0 (0.0%) |
| Total | 14 (10.6%) | 9 (7.0%) |
Income Above Poverty by Sex and Age in Sawyer
According to the poverty statistics in Sawyer, males aged under 5 years and females aged under 5 years are the age groups that are most secure financially, with 100.0% of males and 100.0% of females in these age groups living above the poverty line.
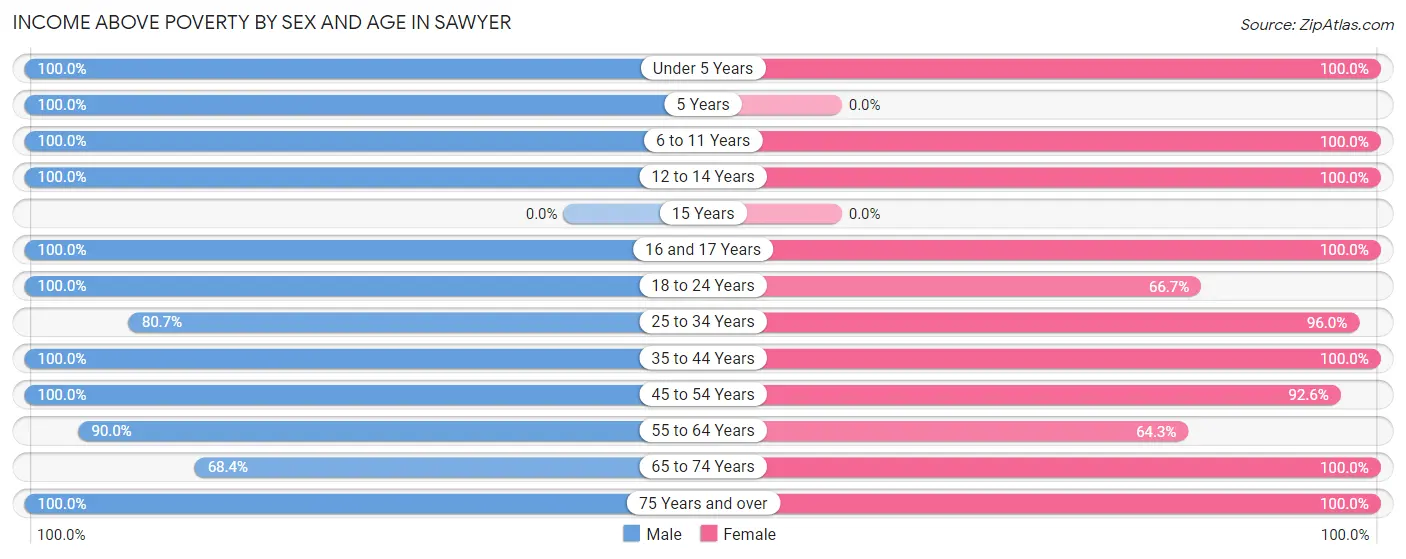
| Age Bracket | Male | Female |
| Under 5 Years | 3 (100.0%) | 18 (100.0%) |
| 5 Years | 5 (100.0%) | 0 (0.0%) |
| 6 to 11 Years | 1 (100.0%) | 8 (100.0%) |
| 12 to 14 Years | 2 (100.0%) | 6 (100.0%) |
| 15 Years | 0 (0.0%) | 0 (0.0%) |
| 16 and 17 Years | 7 (100.0%) | 1 (100.0%) |
| 18 to 24 Years | 11 (100.0%) | 2 (66.7%) |
| 25 to 34 Years | 25 (80.6%) | 24 (96.0%) |
| 35 to 44 Years | 9 (100.0%) | 2 (100.0%) |
| 45 to 54 Years | 15 (100.0%) | 25 (92.6%) |
| 55 to 64 Years | 18 (90.0%) | 9 (64.3%) |
| 65 to 74 Years | 13 (68.4%) | 8 (100.0%) |
| 75 Years and over | 9 (100.0%) | 17 (100.0%) |
| Total | 118 (89.4%) | 120 (93.0%) |
Income Below Poverty Among Married-Couple Families in Sawyer
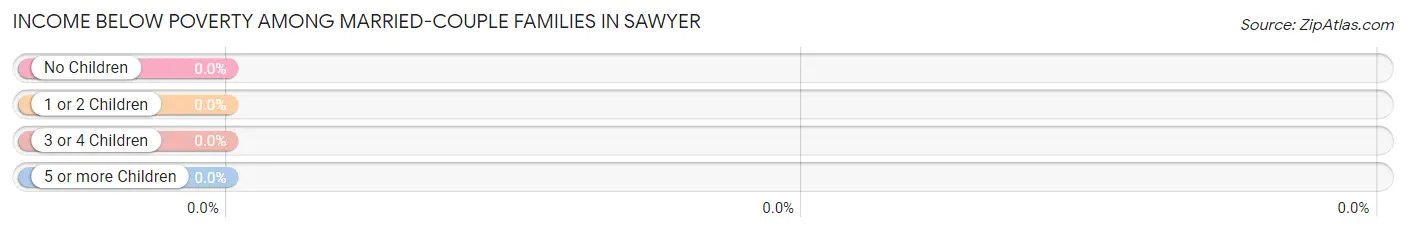
| Children | Above Poverty | Below Poverty |
| No Children | 52 (100.0%) | 0 (0.0%) |
| 1 or 2 Children | 21 (100.0%) | 0 (0.0%) |
| 3 or 4 Children | 4 (100.0%) | 0 (0.0%) |
| 5 or more Children | 0 (0.0%) | 0 (0.0%) |
| Total | 77 (100.0%) | 0 (0.0%) |
Income Below Poverty Among Single-Parent Households in Sawyer
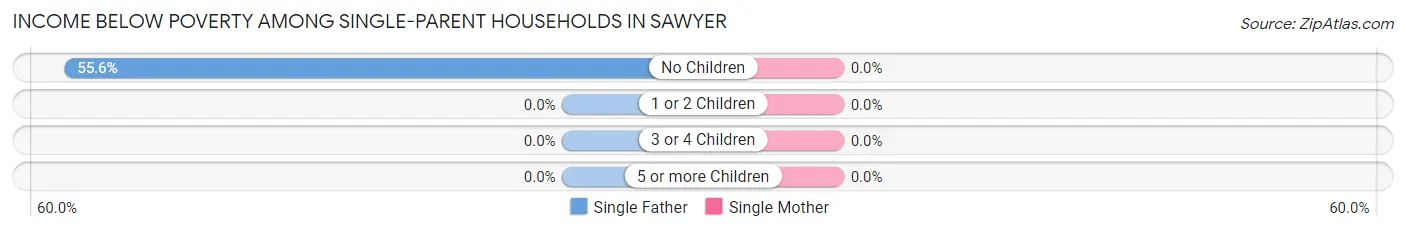
| Children | Single Father | Single Mother |
| No Children | 5 (55.6%) | 0 (0.0%) |
| 1 or 2 Children | 0 (0.0%) | 0 (0.0%) |
| 3 or 4 Children | 0 (0.0%) | 0 (0.0%) |
| 5 or more Children | 0 (0.0%) | 0 (0.0%) |
| Total | 5 (55.6%) | 0 (0.0%) |
Income Below Poverty Among Married-Couple vs Single-Parent Households in Sawyer
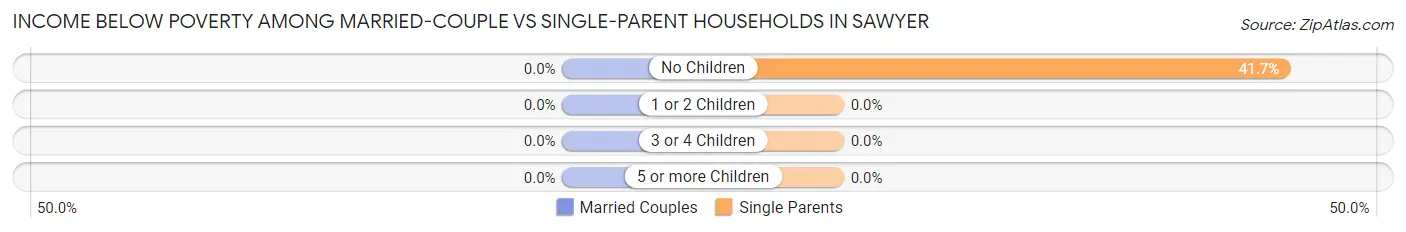
| Children | Married-Couple Families | Single-Parent Households |
| No Children | 0 (0.0%) | 5 (41.7%) |
| 1 or 2 Children | 0 (0.0%) | 0 (0.0%) |
| 3 or 4 Children | 0 (0.0%) | 0 (0.0%) |
| 5 or more Children | 0 (0.0%) | 0 (0.0%) |
| Total | 0 (0.0%) | 5 (38.5%) |
Employment Characteristics in Sawyer
Employment by Class of Employer in Sawyer
Among the 141 employed individuals in Sawyer, private company employees (91 | 64.5%), local government employees (18 | 12.8%), and not-for-profit organizations (14 | 9.9%) make up the most common classes of employment.
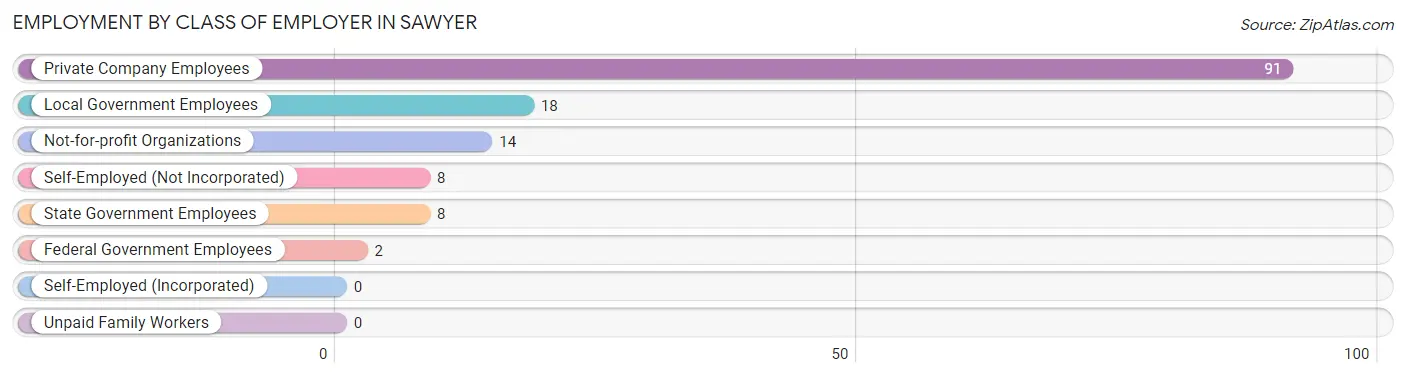
| Employer Class | # Employees | % Employees |
| Private Company Employees | 91 | 64.5% |
| Self-Employed (Incorporated) | 0 | 0.0% |
| Self-Employed (Not Incorporated) | 8 | 5.7% |
| Not-for-profit Organizations | 14 | 9.9% |
| Local Government Employees | 18 | 12.8% |
| State Government Employees | 8 | 5.7% |
| Federal Government Employees | 2 | 1.4% |
| Unpaid Family Workers | 0 | 0.0% |
| Total | 141 | 100.0% |
Employment Status by Age in Sawyer
According to the labor force statistics for Sawyer, out of the total population over 16 years of age (218), 69.7% or 152 individuals are in the labor force, with 0.7% or 1 of them unemployed. The age group with the highest labor force participation rate is 25 to 29 years, with 100.0% or 16 individuals in the labor force. Within the labor force, the 60 to 64 years age range has the highest percentage of unemployed individuals, with 8.3% or 1 of them being unemployed.
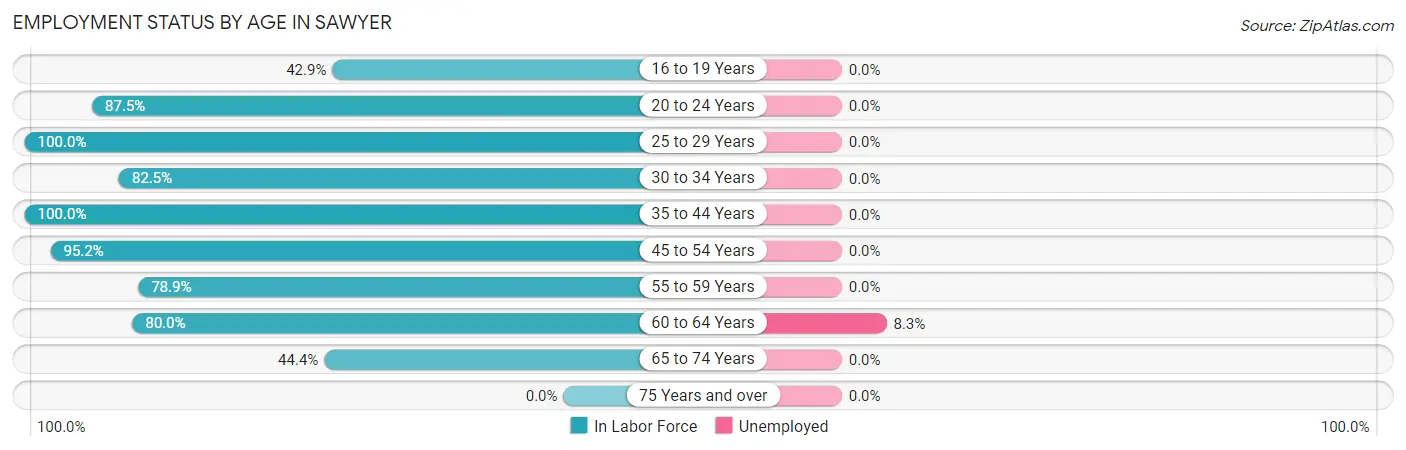
| Age Bracket | In Labor Force | Unemployed |
| 16 to 19 Years | 6 (42.9%) | 0 (0.0%) |
| 20 to 24 Years | 7 (87.5%) | 0 (0.0%) |
| 25 to 29 Years | 16 (100.0%) | 0 (0.0%) |
| 30 to 34 Years | 33 (82.5%) | 0 (0.0%) |
| 35 to 44 Years | 11 (100.0%) | 0 (0.0%) |
| 45 to 54 Years | 40 (95.2%) | 0 (0.0%) |
| 55 to 59 Years | 15 (78.9%) | 0 (0.0%) |
| 60 to 64 Years | 12 (80.0%) | 1 (8.3%) |
| 65 to 74 Years | 12 (44.4%) | 0 (0.0%) |
| 75 Years and over | 0 (0.0%) | 0 (0.0%) |
| Total | 152 (69.7%) | 1 (0.7%) |
Employment Status by Educational Attainment in Sawyer
According to labor force statistics for Sawyer, 88.8% of individuals (127) out of the total population between 25 and 64 years of age (143) are in the labor force, with 0.8% or 1 of them being unemployed. The group with the highest labor force participation rate are those with the educational attainment of college / associate degree, with 98.1% or 53 individuals in the labor force. Within the labor force, individuals with high school diploma education have the highest percentage of unemployment, with 2.1% or 1 of them being unemployed.
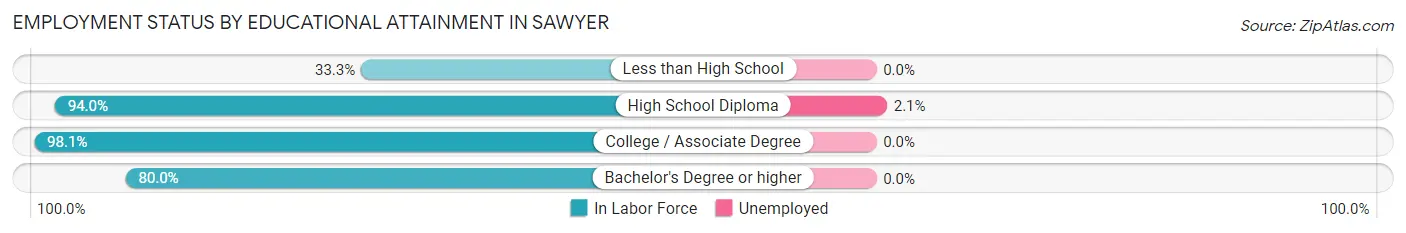
| Educational Attainment | In Labor Force | Unemployed |
| Less than High School | 3 (33.3%) | 0 (0.0%) |
| High School Diploma | 47 (94.0%) | 1 (2.1%) |
| College / Associate Degree | 53 (98.1%) | 0 (0.0%) |
| Bachelor's Degree or higher | 24 (80.0%) | 0 (0.0%) |
| Total | 127 (88.8%) | 1 (0.8%) |
Employment Occupations by Sex in Sawyer
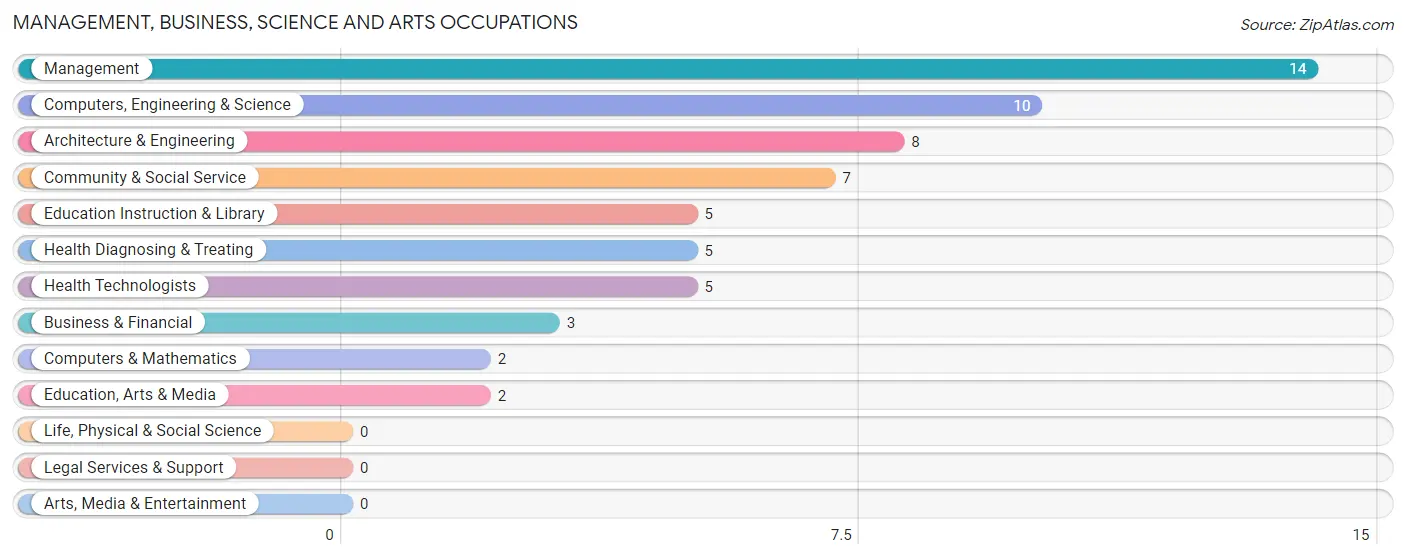
Management, Business, Science and Arts Occupations
The most common Management, Business, Science and Arts occupations in Sawyer are Management (14 | 9.3%), Computers, Engineering & Science (10 | 6.7%), Architecture & Engineering (8 | 5.3%), Community & Social Service (7 | 4.7%), and Education Instruction & Library (5 | 3.3%).
Management, Business, Science and Arts Occupations by Sex
Within the Management, Business, Science and Arts occupations in Sawyer, the most male-oriented occupations are Architecture & Engineering (100.0%), Computers, Engineering & Science (80.0%), and Management (71.4%), while the most female-oriented occupations are Computers & Mathematics (100.0%), Health Diagnosing & Treating (100.0%), and Health Technologists (100.0%).
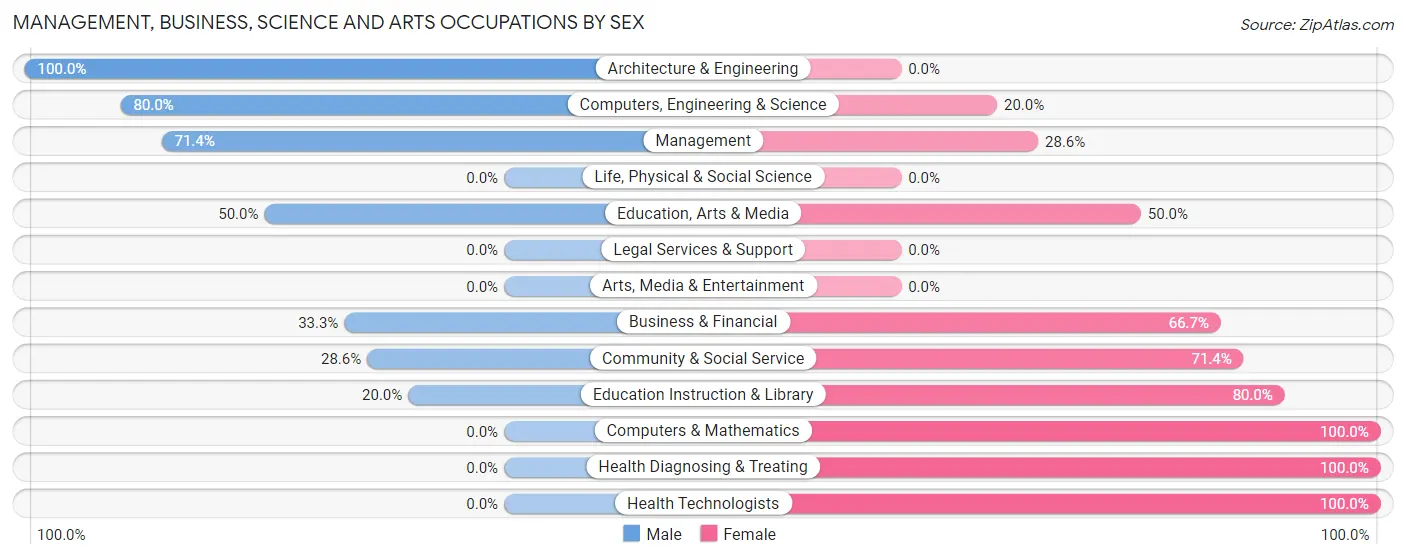
| Occupation | Male | Female |
| Management | 10 (71.4%) | 4 (28.6%) |
| Business & Financial | 1 (33.3%) | 2 (66.7%) |
| Computers, Engineering & Science | 8 (80.0%) | 2 (20.0%) |
| Computers & Mathematics | 0 (0.0%) | 2 (100.0%) |
| Architecture & Engineering | 8 (100.0%) | 0 (0.0%) |
| Life, Physical & Social Science | 0 (0.0%) | 0 (0.0%) |
| Community & Social Service | 2 (28.6%) | 5 (71.4%) |
| Education, Arts & Media | 1 (50.0%) | 1 (50.0%) |
| Legal Services & Support | 0 (0.0%) | 0 (0.0%) |
| Education Instruction & Library | 1 (20.0%) | 4 (80.0%) |
| Arts, Media & Entertainment | 0 (0.0%) | 0 (0.0%) |
| Health Diagnosing & Treating | 0 (0.0%) | 5 (100.0%) |
| Health Technologists | 0 (0.0%) | 5 (100.0%) |
| Total (Category) | 21 (53.8%) | 18 (46.2%) |
| Total (Overall) | 88 (58.7%) | 62 (41.3%) |
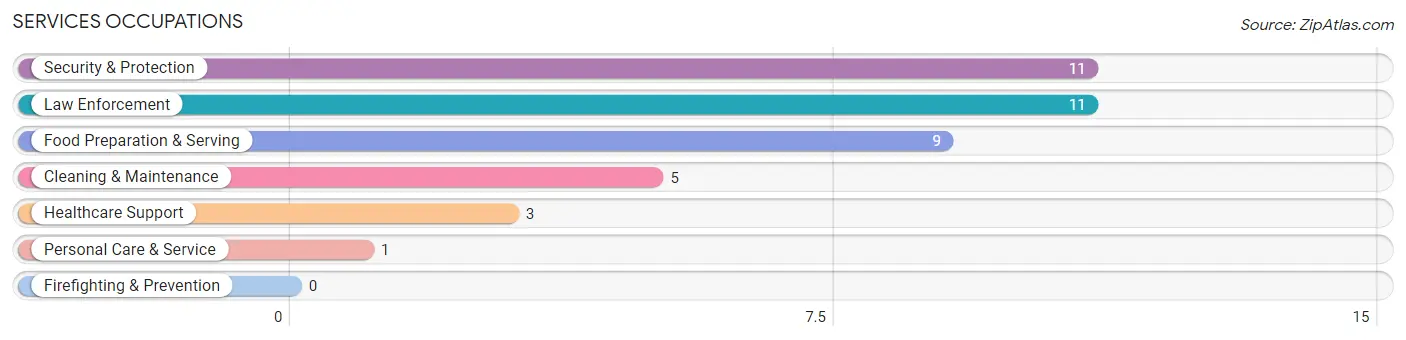
Services Occupations
The most common Services occupations in Sawyer are Security & Protection (11 | 7.3%), Law Enforcement (11 | 7.3%), Food Preparation & Serving (9 | 6.0%), Cleaning & Maintenance (5 | 3.3%), and Healthcare Support (3 | 2.0%).
Services Occupations by Sex
Within the Services occupations in Sawyer, the most male-oriented occupations are Security & Protection (100.0%), Law Enforcement (100.0%), and Cleaning & Maintenance (80.0%), while the most female-oriented occupations are Healthcare Support (100.0%), Personal Care & Service (100.0%), and Food Preparation & Serving (44.4%).
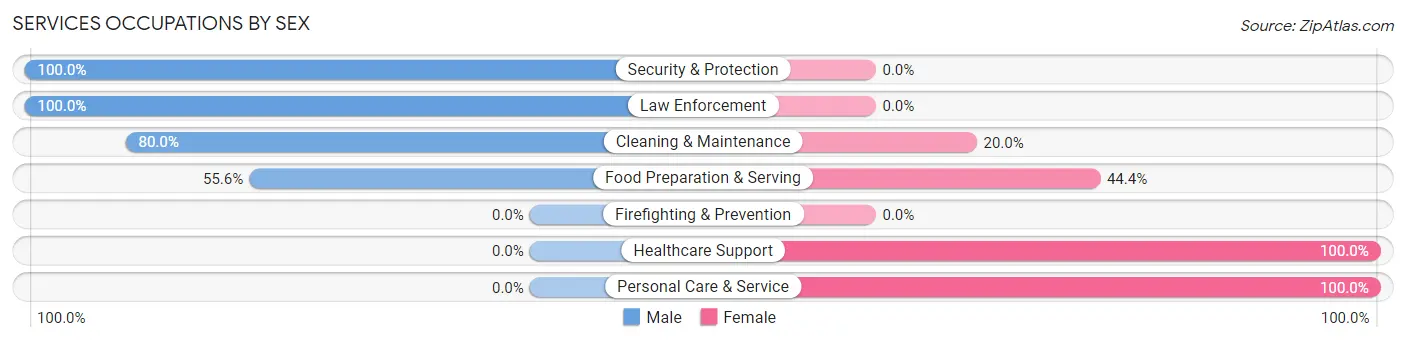
| Occupation | Male | Female |
| Healthcare Support | 0 (0.0%) | 3 (100.0%) |
| Security & Protection | 11 (100.0%) | 0 (0.0%) |
| Firefighting & Prevention | 0 (0.0%) | 0 (0.0%) |
| Law Enforcement | 11 (100.0%) | 0 (0.0%) |
| Food Preparation & Serving | 5 (55.6%) | 4 (44.4%) |
| Cleaning & Maintenance | 4 (80.0%) | 1 (20.0%) |
| Personal Care & Service | 0 (0.0%) | 1 (100.0%) |
| Total (Category) | 20 (69.0%) | 9 (31.0%) |
| Total (Overall) | 88 (58.7%) | 62 (41.3%) |
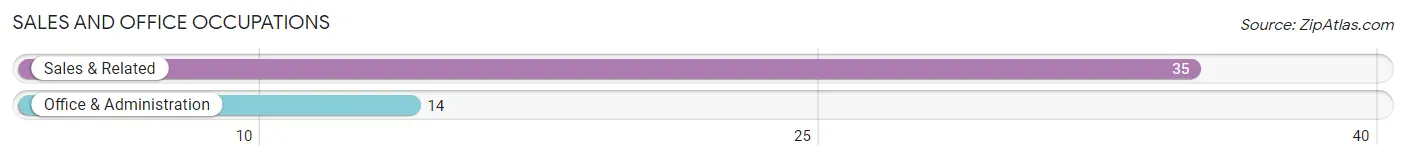
Sales and Office Occupations
The most common Sales and Office occupations in Sawyer are Sales & Related (35 | 23.3%), and Office & Administration (14 | 9.3%).
Sales and Office Occupations by Sex
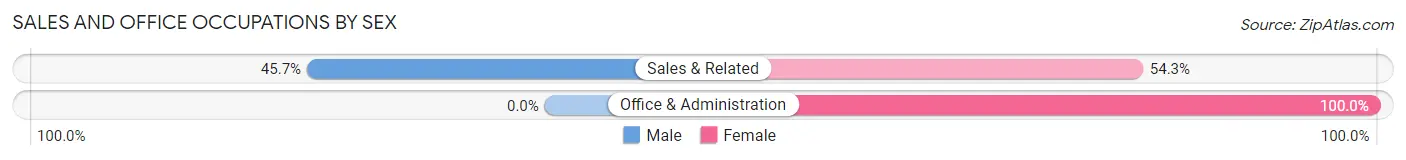
| Occupation | Male | Female |
| Sales & Related | 16 (45.7%) | 19 (54.3%) |
| Office & Administration | 0 (0.0%) | 14 (100.0%) |
| Total (Category) | 16 (32.7%) | 33 (67.3%) |
| Total (Overall) | 88 (58.7%) | 62 (41.3%) |
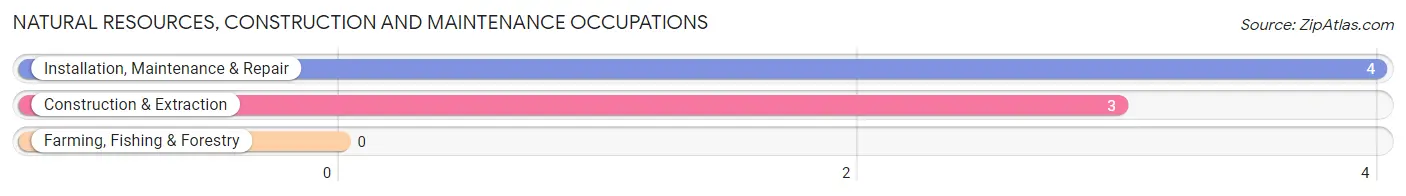
Natural Resources, Construction and Maintenance Occupations
The most common Natural Resources, Construction and Maintenance occupations in Sawyer are Installation, Maintenance & Repair (4 | 2.7%), and Construction & Extraction (3 | 2.0%).
Natural Resources, Construction and Maintenance Occupations by Sex
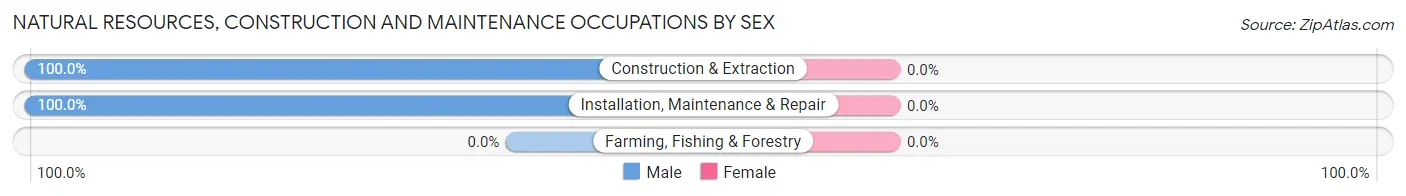
| Occupation | Male | Female |
| Farming, Fishing & Forestry | 0 (0.0%) | 0 (0.0%) |
| Construction & Extraction | 3 (100.0%) | 0 (0.0%) |
| Installation, Maintenance & Repair | 4 (100.0%) | 0 (0.0%) |
| Total (Category) | 7 (100.0%) | 0 (0.0%) |
| Total (Overall) | 88 (58.7%) | 62 (41.3%) |
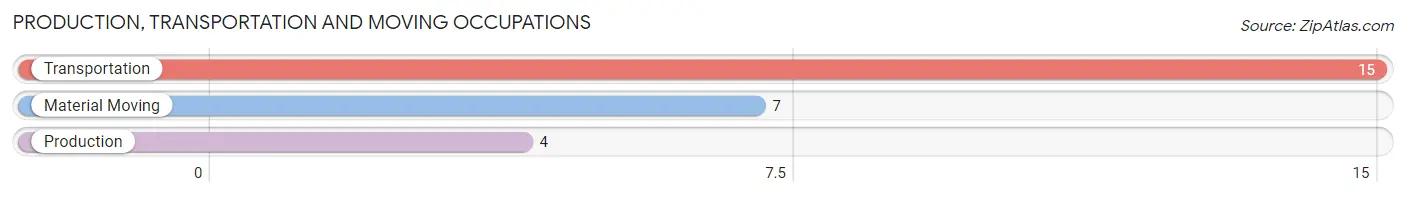
Production, Transportation and Moving Occupations
The most common Production, Transportation and Moving occupations in Sawyer are Transportation (15 | 10.0%), Material Moving (7 | 4.7%), and Production (4 | 2.7%).
Production, Transportation and Moving Occupations by Sex
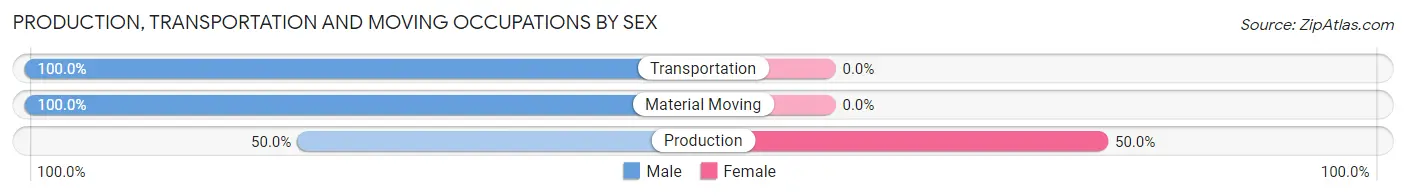
| Occupation | Male | Female |
| Production | 2 (50.0%) | 2 (50.0%) |
| Transportation | 15 (100.0%) | 0 (0.0%) |
| Material Moving | 7 (100.0%) | 0 (0.0%) |
| Total (Category) | 24 (92.3%) | 2 (7.7%) |
| Total (Overall) | 88 (58.7%) | 62 (41.3%) |
Employment Industries by Sex in Sawyer
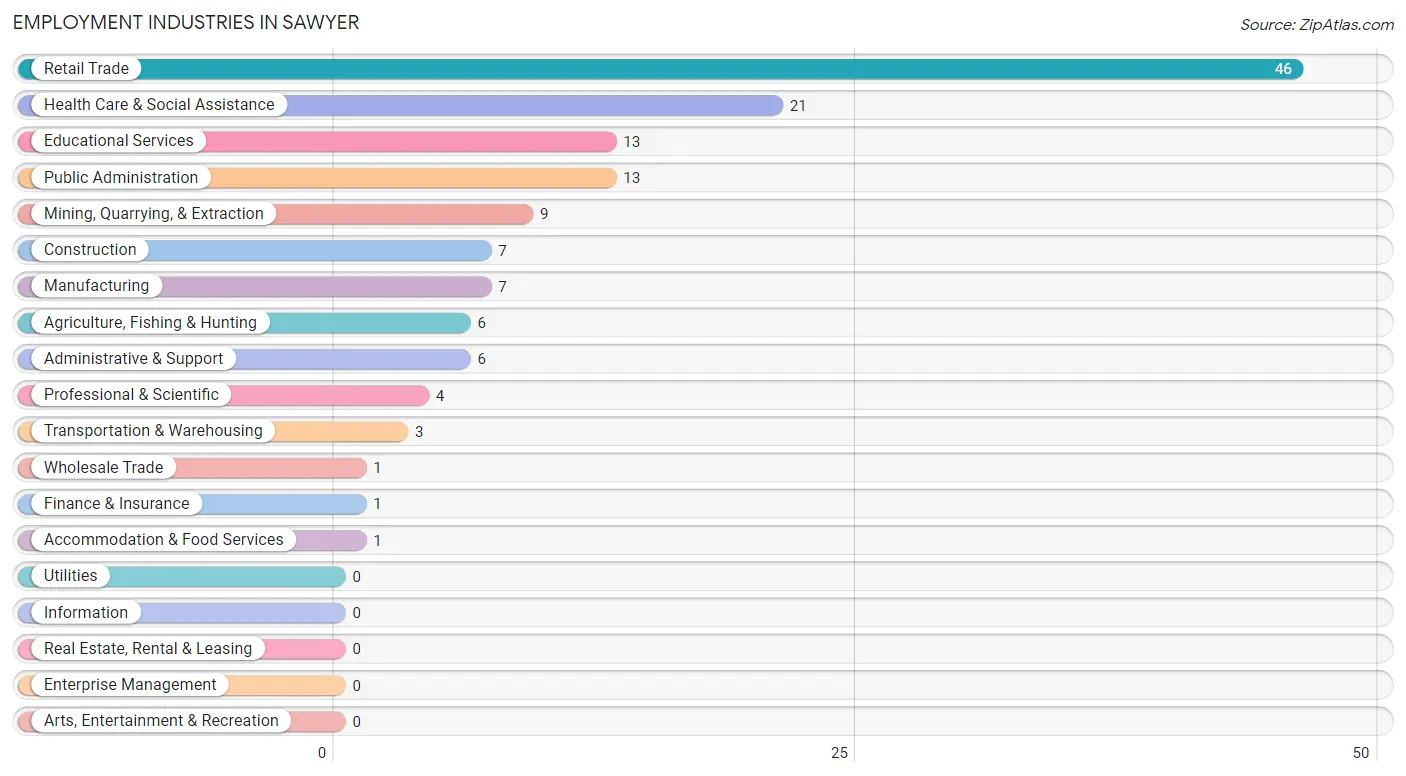
Employment Industries in Sawyer
The major employment industries in Sawyer include Retail Trade (46 | 30.7%), Health Care & Social Assistance (21 | 14.0%), Educational Services (13 | 8.7%), Public Administration (13 | 8.7%), and Mining, Quarrying, & Extraction (9 | 6.0%).
Employment Industries by Sex in Sawyer
The Sawyer industries that see more men than women are Agriculture, Fishing & Hunting (100.0%), Mining, Quarrying, & Extraction (100.0%), and Wholesale Trade (100.0%), whereas the industries that tend to have a higher number of women are Professional & Scientific (100.0%), Accommodation & Food Services (100.0%), and Health Care & Social Assistance (95.2%).
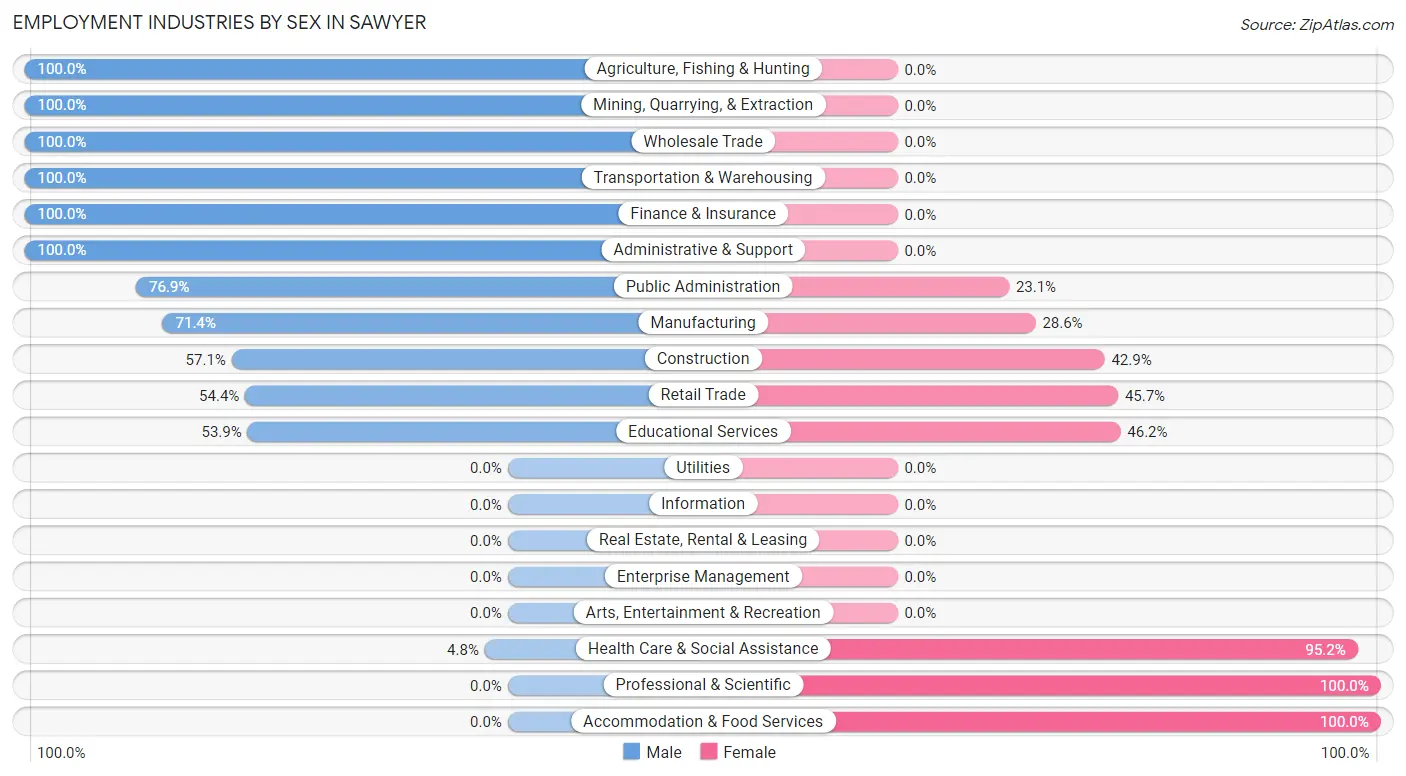
| Industry | Male | Female |
| Agriculture, Fishing & Hunting | 6 (100.0%) | 0 (0.0%) |
| Mining, Quarrying, & Extraction | 9 (100.0%) | 0 (0.0%) |
| Construction | 4 (57.1%) | 3 (42.9%) |
| Manufacturing | 5 (71.4%) | 2 (28.6%) |
| Wholesale Trade | 1 (100.0%) | 0 (0.0%) |
| Retail Trade | 25 (54.3%) | 21 (45.7%) |
| Transportation & Warehousing | 3 (100.0%) | 0 (0.0%) |
| Utilities | 0 (0.0%) | 0 (0.0%) |
| Information | 0 (0.0%) | 0 (0.0%) |
| Finance & Insurance | 1 (100.0%) | 0 (0.0%) |
| Real Estate, Rental & Leasing | 0 (0.0%) | 0 (0.0%) |
| Professional & Scientific | 0 (0.0%) | 4 (100.0%) |
| Enterprise Management | 0 (0.0%) | 0 (0.0%) |
| Administrative & Support | 6 (100.0%) | 0 (0.0%) |
| Educational Services | 7 (53.8%) | 6 (46.2%) |
| Health Care & Social Assistance | 1 (4.8%) | 20 (95.2%) |
| Arts, Entertainment & Recreation | 0 (0.0%) | 0 (0.0%) |
| Accommodation & Food Services | 0 (0.0%) | 1 (100.0%) |
| Public Administration | 10 (76.9%) | 3 (23.1%) |
| Total | 88 (58.7%) | 62 (41.3%) |
Education in Sawyer
School Enrollment in Sawyer
The most common levels of schooling among the 45 students in Sawyer are high school (13 | 28.9%), middle school (11 | 24.4%), and college / undergraduate (10 | 22.2%).
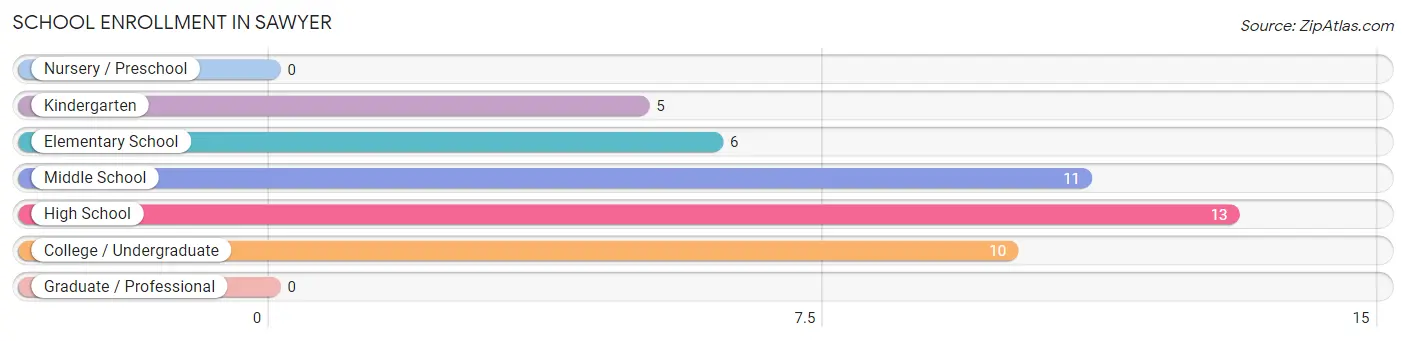
| School Level | # Students | % Students |
| Nursery / Preschool | 0 | 0.0% |
| Kindergarten | 5 | 11.1% |
| Elementary School | 6 | 13.3% |
| Middle School | 11 | 24.4% |
| High School | 13 | 28.9% |
| College / Undergraduate | 10 | 22.2% |
| Graduate / Professional | 0 | 0.0% |
| Total | 45 | 100.0% |
School Enrollment by Age by Funding Source in Sawyer
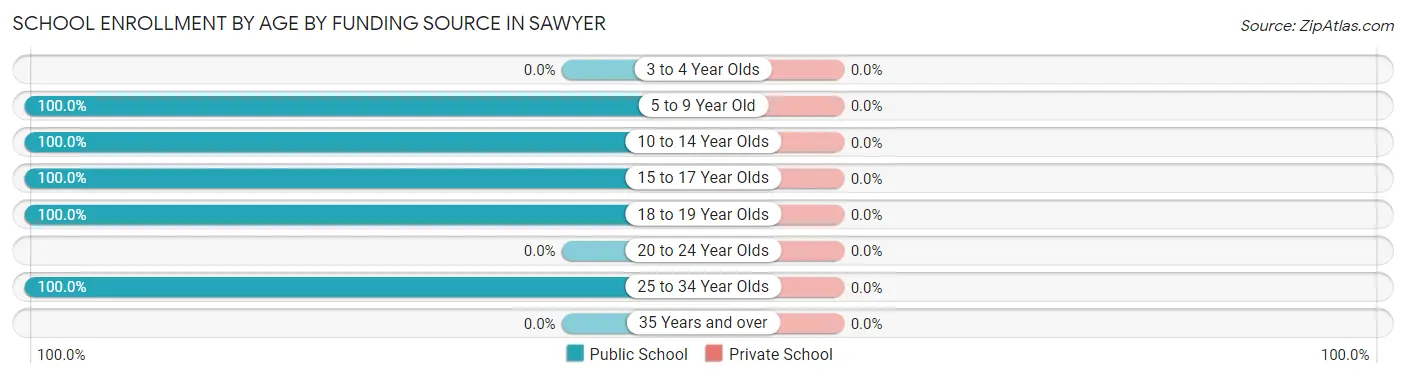
| Age Bracket | Public School | Private School |
| 3 to 4 Year Olds | 0 (0.0%) | 0 (0.0%) |
| 5 to 9 Year Old | 11 (100.0%) | 0 (0.0%) |
| 10 to 14 Year Olds | 11 (100.0%) | 0 (0.0%) |
| 15 to 17 Year Olds | 8 (100.0%) | 0 (0.0%) |
| 18 to 19 Year Olds | 5 (100.0%) | 0 (0.0%) |
| 20 to 24 Year Olds | 0 (0.0%) | 0 (0.0%) |
| 25 to 34 Year Olds | 10 (100.0%) | 0 (0.0%) |
| 35 Years and over | 0 (0.0%) | 0 (0.0%) |
| Total | 45 (100.0%) | 0 (0.0%) |
Educational Attainment by Field of Study in Sawyer
Education (13 | 32.5%), engineering (9 | 22.5%), business (9 | 22.5%), arts & humanities (8 | 20.0%), and science & technology (1 | 2.5%) are the most common fields of study among 40 individuals in Sawyer who have obtained a bachelor's degree or higher.
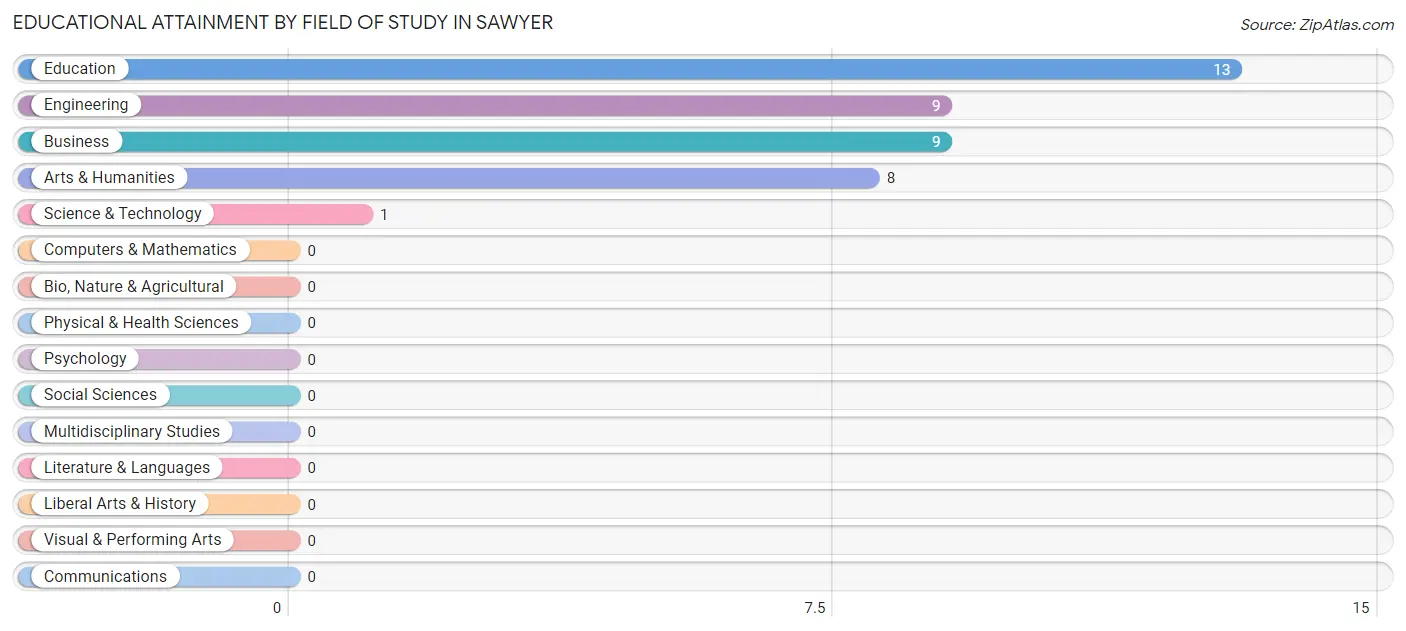
| Field of Study | # Graduates | % Graduates |
| Computers & Mathematics | 0 | 0.0% |
| Bio, Nature & Agricultural | 0 | 0.0% |
| Physical & Health Sciences | 0 | 0.0% |
| Psychology | 0 | 0.0% |
| Social Sciences | 0 | 0.0% |
| Engineering | 9 | 22.5% |
| Multidisciplinary Studies | 0 | 0.0% |
| Science & Technology | 1 | 2.5% |
| Business | 9 | 22.5% |
| Education | 13 | 32.5% |
| Literature & Languages | 0 | 0.0% |
| Liberal Arts & History | 0 | 0.0% |
| Visual & Performing Arts | 0 | 0.0% |
| Communications | 0 | 0.0% |
| Arts & Humanities | 8 | 20.0% |
| Total | 40 | 100.0% |
Transportation & Commute in Sawyer
Vehicle Availability by Sex in Sawyer
The most prevalent vehicle ownership categories in Sawyer are males with 4 vehicles (33, accounting for 40.2%) and females with 4 vehicles (10, making up 55.9%).
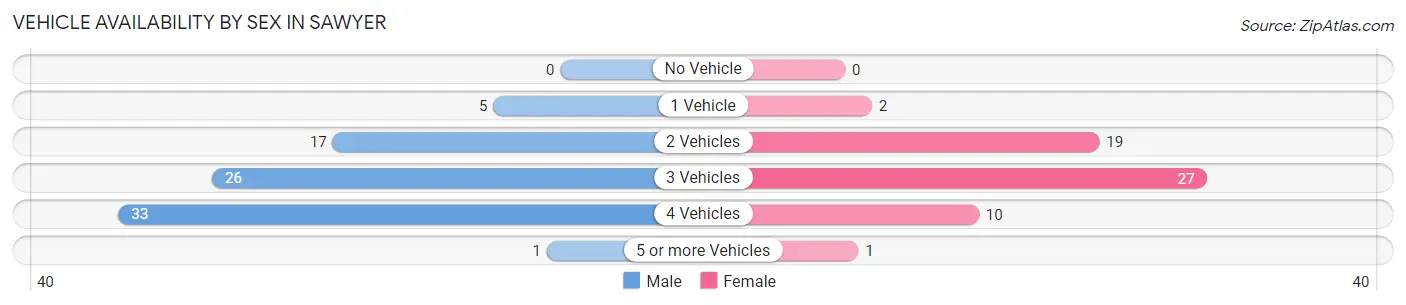
| Vehicles Available | Male | Female |
| No Vehicle | 0 (0.0%) | 0 (0.0%) |
| 1 Vehicle | 5 (6.1%) | 2 (3.4%) |
| 2 Vehicles | 17 (20.7%) | 19 (32.2%) |
| 3 Vehicles | 26 (31.7%) | 27 (45.8%) |
| 4 Vehicles | 33 (40.2%) | 10 (17.0%) |
| 5 or more Vehicles | 1 (1.2%) | 1 (1.7%) |
| Total | 82 (100.0%) | 59 (100.0%) |
Commute Time in Sawyer
The most frequently occuring commute durations in Sawyer are 20 to 24 minutes (33 commuters, 23.7%), 10 to 14 minutes (26 commuters, 18.7%), and 15 to 19 minutes (23 commuters, 16.6%).
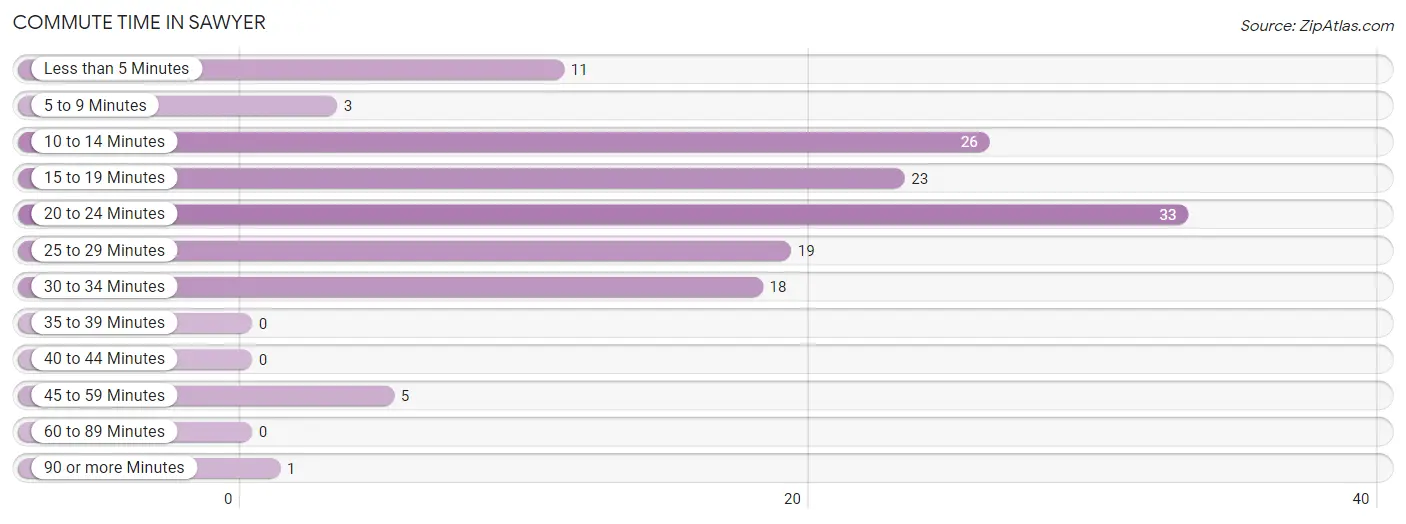
| Commute Time | # Commuters | % Commuters |
| Less than 5 Minutes | 11 | 7.9% |
| 5 to 9 Minutes | 3 | 2.2% |
| 10 to 14 Minutes | 26 | 18.7% |
| 15 to 19 Minutes | 23 | 16.6% |
| 20 to 24 Minutes | 33 | 23.7% |
| 25 to 29 Minutes | 19 | 13.7% |
| 30 to 34 Minutes | 18 | 13.0% |
| 35 to 39 Minutes | 0 | 0.0% |
| 40 to 44 Minutes | 0 | 0.0% |
| 45 to 59 Minutes | 5 | 3.6% |
| 60 to 89 Minutes | 0 | 0.0% |
| 90 or more Minutes | 1 | 0.7% |
Commute Time by Sex in Sawyer
The most common commute times in Sawyer are 20 to 24 minutes (20 commuters, 24.4%) for males and 20 to 24 minutes (13 commuters, 22.8%) for females.
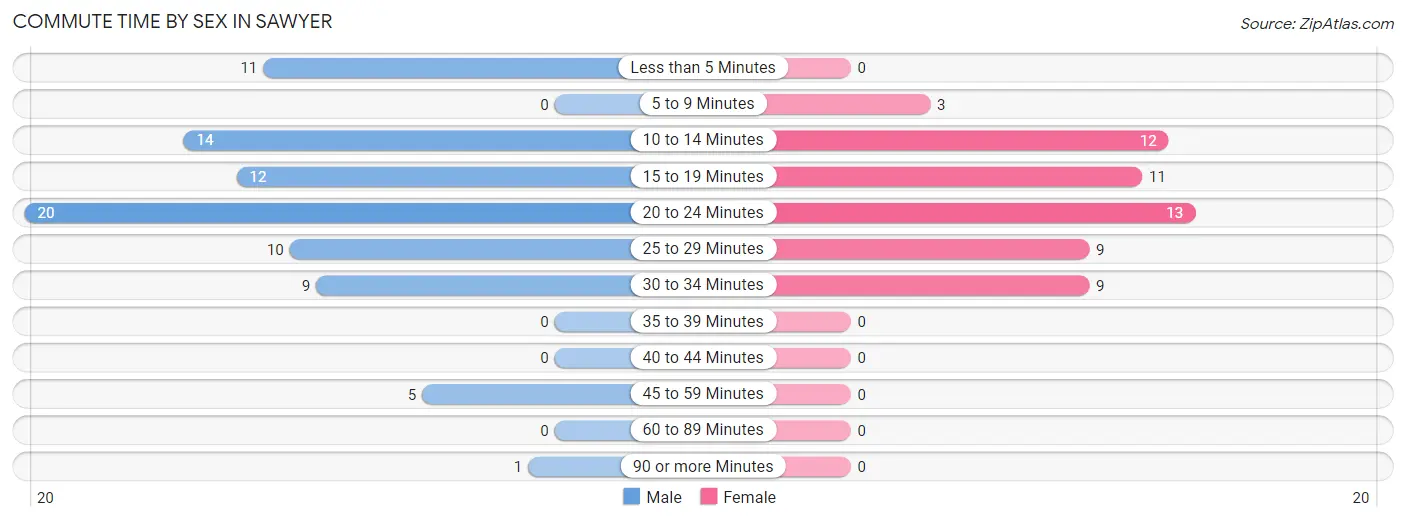
| Commute Time | Male | Female |
| Less than 5 Minutes | 11 (13.4%) | 0 (0.0%) |
| 5 to 9 Minutes | 0 (0.0%) | 3 (5.3%) |
| 10 to 14 Minutes | 14 (17.1%) | 12 (21.0%) |
| 15 to 19 Minutes | 12 (14.6%) | 11 (19.3%) |
| 20 to 24 Minutes | 20 (24.4%) | 13 (22.8%) |
| 25 to 29 Minutes | 10 (12.2%) | 9 (15.8%) |
| 30 to 34 Minutes | 9 (11.0%) | 9 (15.8%) |
| 35 to 39 Minutes | 0 (0.0%) | 0 (0.0%) |
| 40 to 44 Minutes | 0 (0.0%) | 0 (0.0%) |
| 45 to 59 Minutes | 5 (6.1%) | 0 (0.0%) |
| 60 to 89 Minutes | 0 (0.0%) | 0 (0.0%) |
| 90 or more Minutes | 1 (1.2%) | 0 (0.0%) |
Time of Departure to Work by Sex in Sawyer
The most frequent times of departure to work in Sawyer are 4:00 PM to 11:59 PM (16, 19.5%) for males and 6:00 AM to 6:29 AM (18, 31.6%) for females.
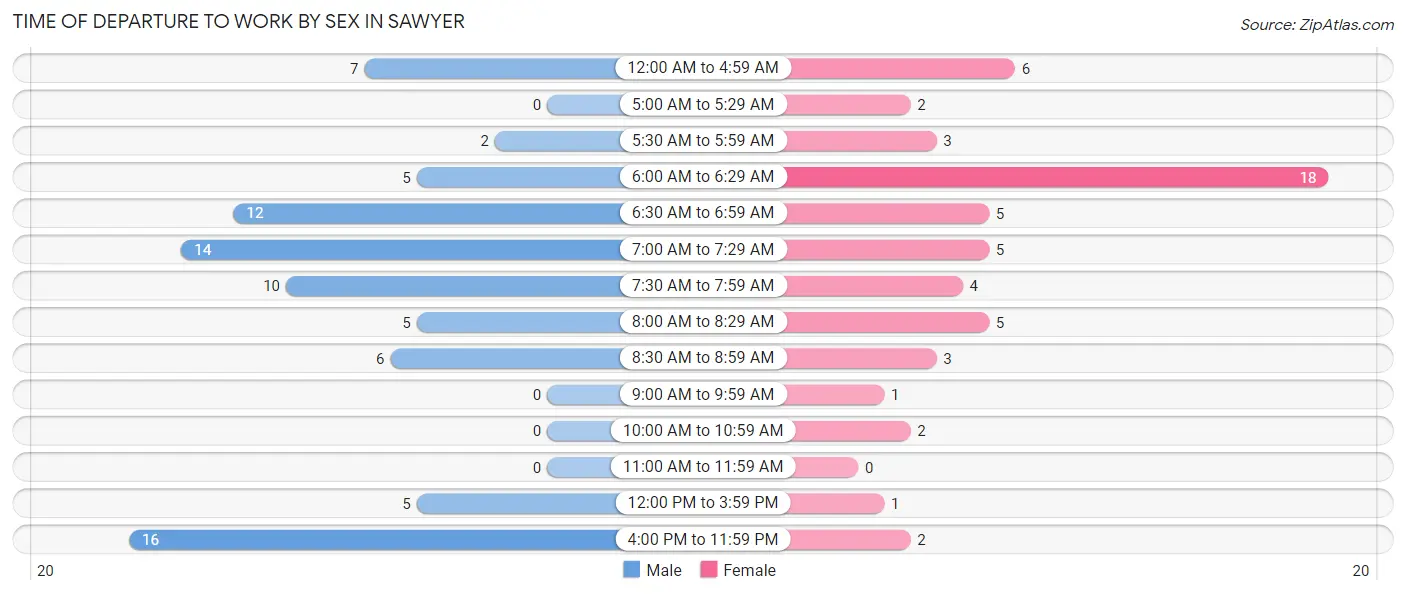
| Time of Departure | Male | Female |
| 12:00 AM to 4:59 AM | 7 (8.5%) | 6 (10.5%) |
| 5:00 AM to 5:29 AM | 0 (0.0%) | 2 (3.5%) |
| 5:30 AM to 5:59 AM | 2 (2.4%) | 3 (5.3%) |
| 6:00 AM to 6:29 AM | 5 (6.1%) | 18 (31.6%) |
| 6:30 AM to 6:59 AM | 12 (14.6%) | 5 (8.8%) |
| 7:00 AM to 7:29 AM | 14 (17.1%) | 5 (8.8%) |
| 7:30 AM to 7:59 AM | 10 (12.2%) | 4 (7.0%) |
| 8:00 AM to 8:29 AM | 5 (6.1%) | 5 (8.8%) |
| 8:30 AM to 8:59 AM | 6 (7.3%) | 3 (5.3%) |
| 9:00 AM to 9:59 AM | 0 (0.0%) | 1 (1.8%) |
| 10:00 AM to 10:59 AM | 0 (0.0%) | 2 (3.5%) |
| 11:00 AM to 11:59 AM | 0 (0.0%) | 0 (0.0%) |
| 12:00 PM to 3:59 PM | 5 (6.1%) | 1 (1.8%) |
| 4:00 PM to 11:59 PM | 16 (19.5%) | 2 (3.5%) |
| Total | 82 (100.0%) | 57 (100.0%) |
Housing Occupancy in Sawyer
Occupancy by Ownership in Sawyer
Of the total 108 dwellings in Sawyer, owner-occupied units account for 94 (87.0%), while renter-occupied units make up 14 (13.0%).
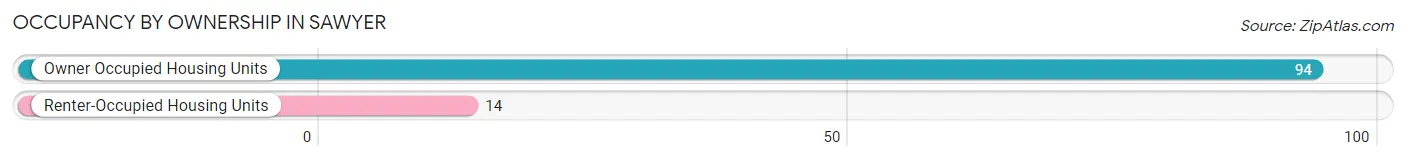
| Occupancy | # Housing Units | % Housing Units |
| Owner Occupied Housing Units | 94 | 87.0% |
| Renter-Occupied Housing Units | 14 | 13.0% |
| Total Occupied Housing Units | 108 | 100.0% |
Occupancy by Household Size in Sawyer
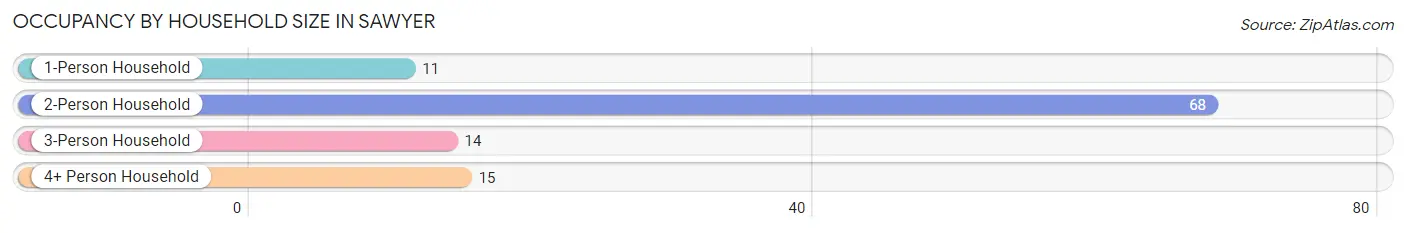
| Household Size | # Housing Units | % Housing Units |
| 1-Person Household | 11 | 10.2% |
| 2-Person Household | 68 | 63.0% |
| 3-Person Household | 14 | 13.0% |
| 4+ Person Household | 15 | 13.9% |
| Total Housing Units | 108 | 100.0% |
Occupancy by Ownership by Household Size in Sawyer
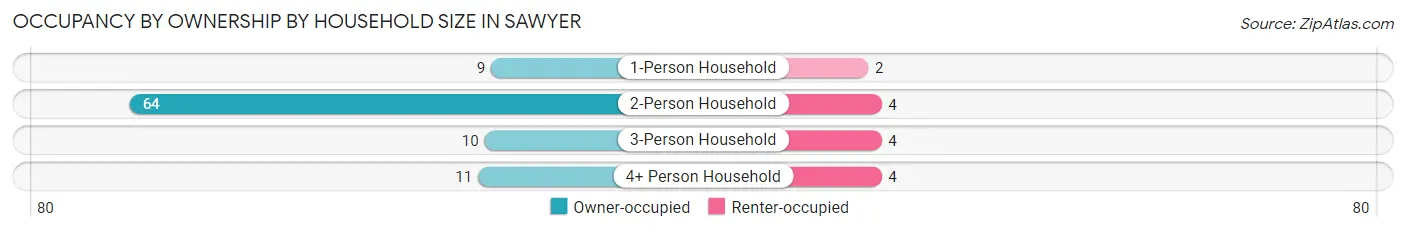
| Household Size | Owner-occupied | Renter-occupied |
| 1-Person Household | 9 (81.8%) | 2 (18.2%) |
| 2-Person Household | 64 (94.1%) | 4 (5.9%) |
| 3-Person Household | 10 (71.4%) | 4 (28.6%) |
| 4+ Person Household | 11 (73.3%) | 4 (26.7%) |
| Total Housing Units | 94 (87.0%) | 14 (13.0%) |
Occupancy by Educational Attainment in Sawyer
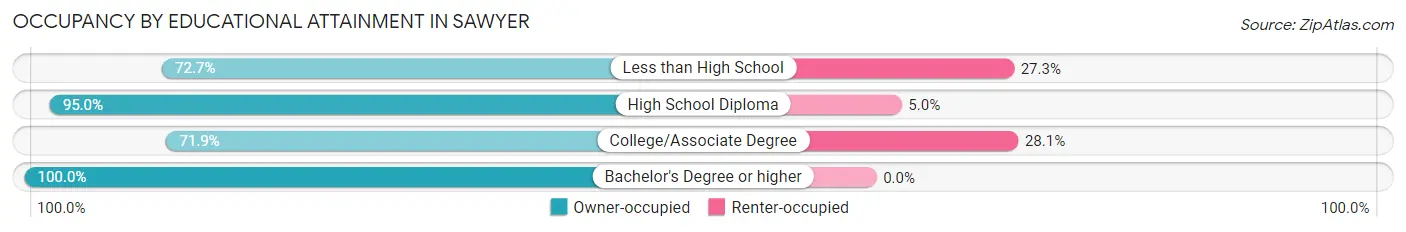
| Household Size | Owner-occupied | Renter-occupied |
| Less than High School | 8 (72.7%) | 3 (27.3%) |
| High School Diploma | 38 (95.0%) | 2 (5.0%) |
| College/Associate Degree | 23 (71.9%) | 9 (28.1%) |
| Bachelor's Degree or higher | 25 (100.0%) | 0 (0.0%) |
Occupancy by Age of Householder in Sawyer
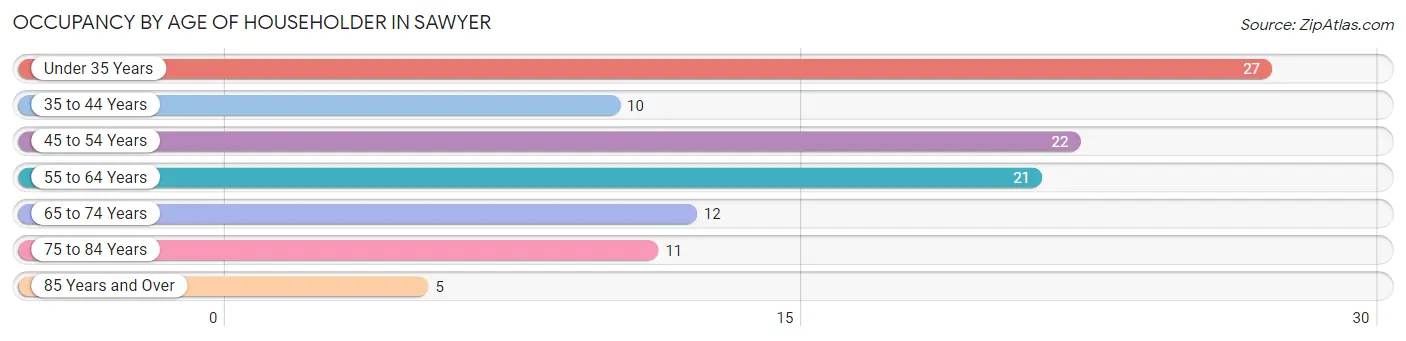
| Age Bracket | # Households | % Households |
| Under 35 Years | 27 | 25.0% |
| 35 to 44 Years | 10 | 9.3% |
| 45 to 54 Years | 22 | 20.4% |
| 55 to 64 Years | 21 | 19.4% |
| 65 to 74 Years | 12 | 11.1% |
| 75 to 84 Years | 11 | 10.2% |
| 85 Years and Over | 5 | 4.6% |
| Total | 108 | 100.0% |
Housing Finances in Sawyer
Median Income by Occupancy in Sawyer
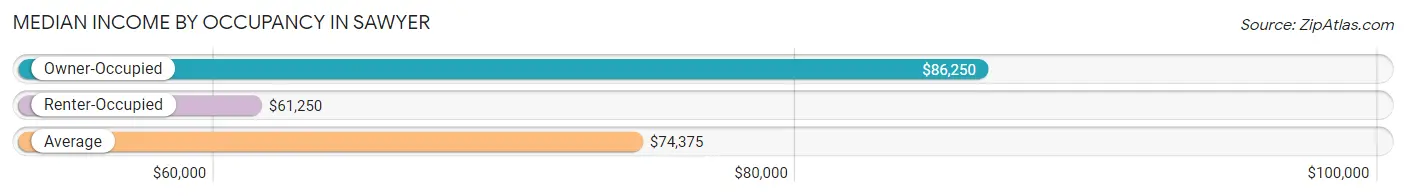
| Occupancy Type | # Households | Median Income |
| Owner-Occupied | 94 (87.0%) | $86,250 |
| Renter-Occupied | 14 (13.0%) | $61,250 |
| Average | 108 (100.0%) | $74,375 |
Occupancy by Householder Income Bracket in Sawyer
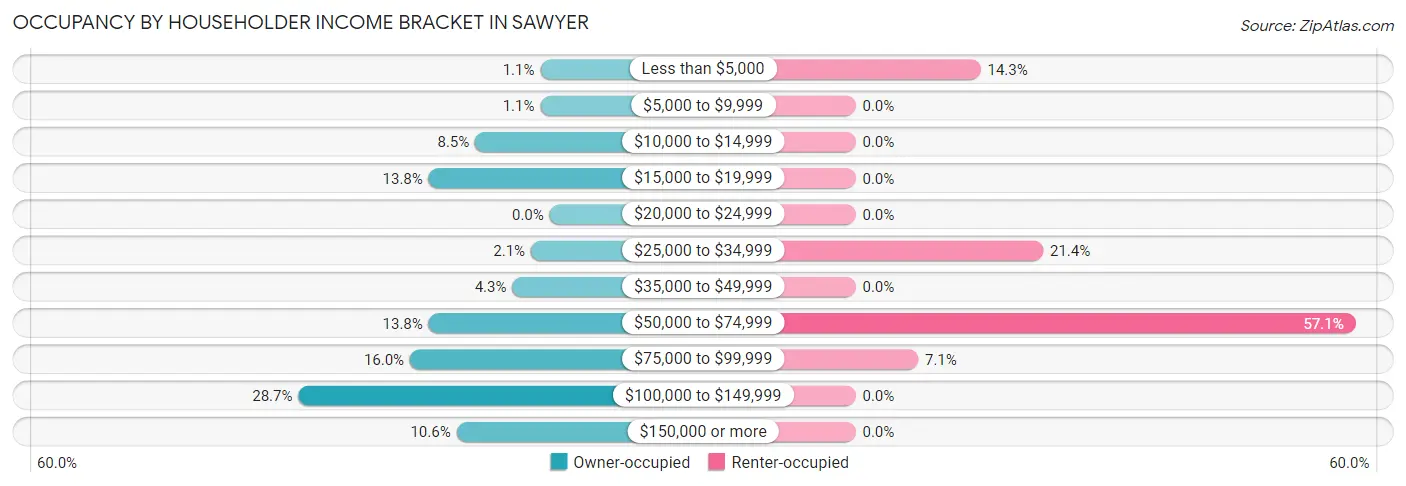
| Income Bracket | Owner-occupied | Renter-occupied |
| Less than $5,000 | 1 (1.1%) | 2 (14.3%) |
| $5,000 to $9,999 | 1 (1.1%) | 0 (0.0%) |
| $10,000 to $14,999 | 8 (8.5%) | 0 (0.0%) |
| $15,000 to $19,999 | 13 (13.8%) | 0 (0.0%) |
| $20,000 to $24,999 | 0 (0.0%) | 0 (0.0%) |
| $25,000 to $34,999 | 2 (2.1%) | 3 (21.4%) |
| $35,000 to $49,999 | 4 (4.3%) | 0 (0.0%) |
| $50,000 to $74,999 | 13 (13.8%) | 8 (57.1%) |
| $75,000 to $99,999 | 15 (16.0%) | 1 (7.1%) |
| $100,000 to $149,999 | 27 (28.7%) | 0 (0.0%) |
| $150,000 or more | 10 (10.6%) | 0 (0.0%) |
| Total | 94 (100.0%) | 14 (100.0%) |
Monthly Housing Cost Tiers in Sawyer
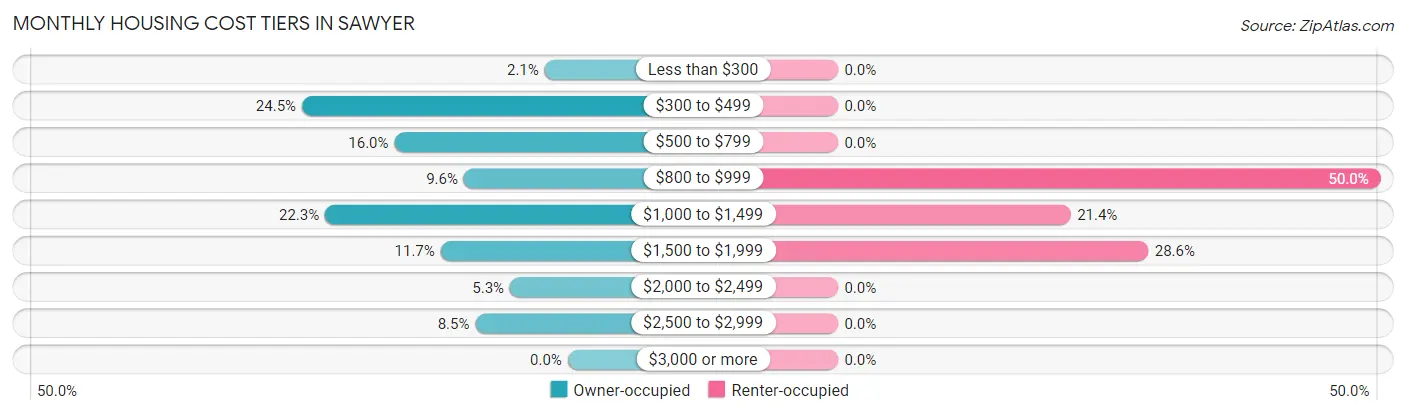
| Monthly Cost | Owner-occupied | Renter-occupied |
| Less than $300 | 2 (2.1%) | 0 (0.0%) |
| $300 to $499 | 23 (24.5%) | 0 (0.0%) |
| $500 to $799 | 15 (16.0%) | 0 (0.0%) |
| $800 to $999 | 9 (9.6%) | 7 (50.0%) |
| $1,000 to $1,499 | 21 (22.3%) | 3 (21.4%) |
| $1,500 to $1,999 | 11 (11.7%) | 4 (28.6%) |
| $2,000 to $2,499 | 5 (5.3%) | 0 (0.0%) |
| $2,500 to $2,999 | 8 (8.5%) | 0 (0.0%) |
| $3,000 or more | 0 (0.0%) | 0 (0.0%) |
| Total | 94 (100.0%) | 14 (100.0%) |
Physical Housing Characteristics in Sawyer
Housing Structures in Sawyer
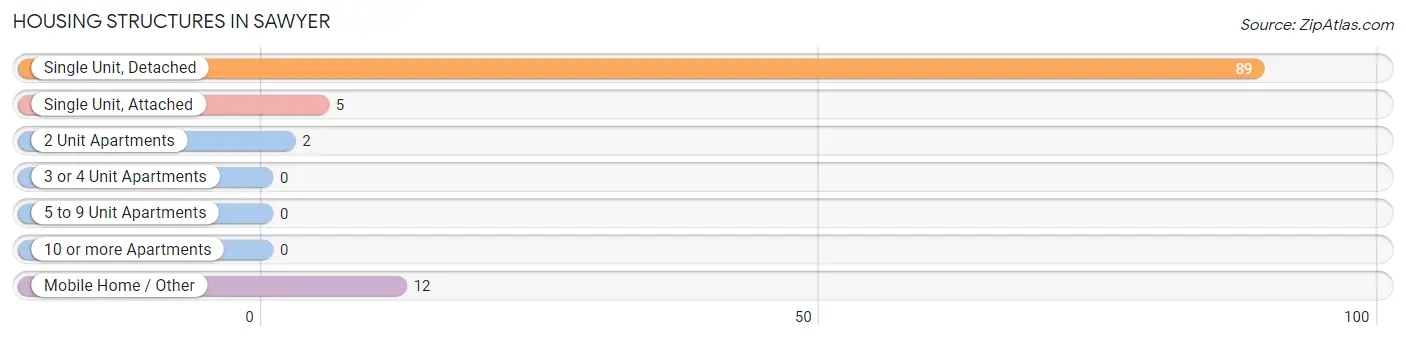
| Structure Type | # Housing Units | % Housing Units |
| Single Unit, Detached | 89 | 82.4% |
| Single Unit, Attached | 5 | 4.6% |
| 2 Unit Apartments | 2 | 1.8% |
| 3 or 4 Unit Apartments | 0 | 0.0% |
| 5 to 9 Unit Apartments | 0 | 0.0% |
| 10 or more Apartments | 0 | 0.0% |
| Mobile Home / Other | 12 | 11.1% |
| Total | 108 | 100.0% |
Housing Structures by Occupancy in Sawyer
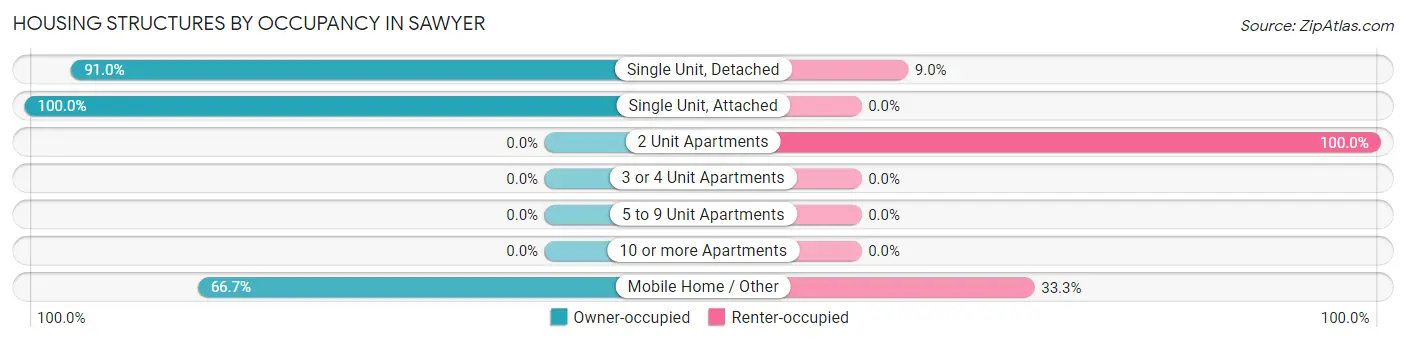
| Structure Type | Owner-occupied | Renter-occupied |
| Single Unit, Detached | 81 (91.0%) | 8 (9.0%) |
| Single Unit, Attached | 5 (100.0%) | 0 (0.0%) |
| 2 Unit Apartments | 0 (0.0%) | 2 (100.0%) |
| 3 or 4 Unit Apartments | 0 (0.0%) | 0 (0.0%) |
| 5 to 9 Unit Apartments | 0 (0.0%) | 0 (0.0%) |
| 10 or more Apartments | 0 (0.0%) | 0 (0.0%) |
| Mobile Home / Other | 8 (66.7%) | 4 (33.3%) |
| Total | 94 (87.0%) | 14 (13.0%) |
Housing Structures by Number of Rooms in Sawyer
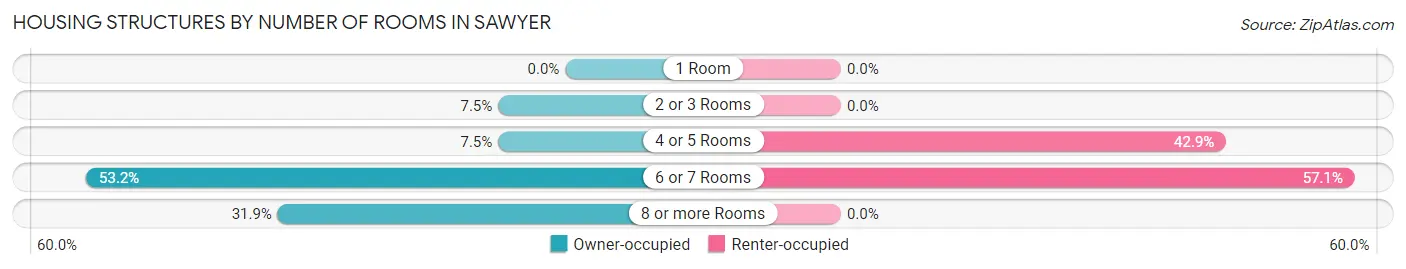
| Number of Rooms | Owner-occupied | Renter-occupied |
| 1 Room | 0 (0.0%) | 0 (0.0%) |
| 2 or 3 Rooms | 7 (7.4%) | 0 (0.0%) |
| 4 or 5 Rooms | 7 (7.4%) | 6 (42.9%) |
| 6 or 7 Rooms | 50 (53.2%) | 8 (57.1%) |
| 8 or more Rooms | 30 (31.9%) | 0 (0.0%) |
| Total | 94 (100.0%) | 14 (100.0%) |
Housing Structure by Heating Type in Sawyer
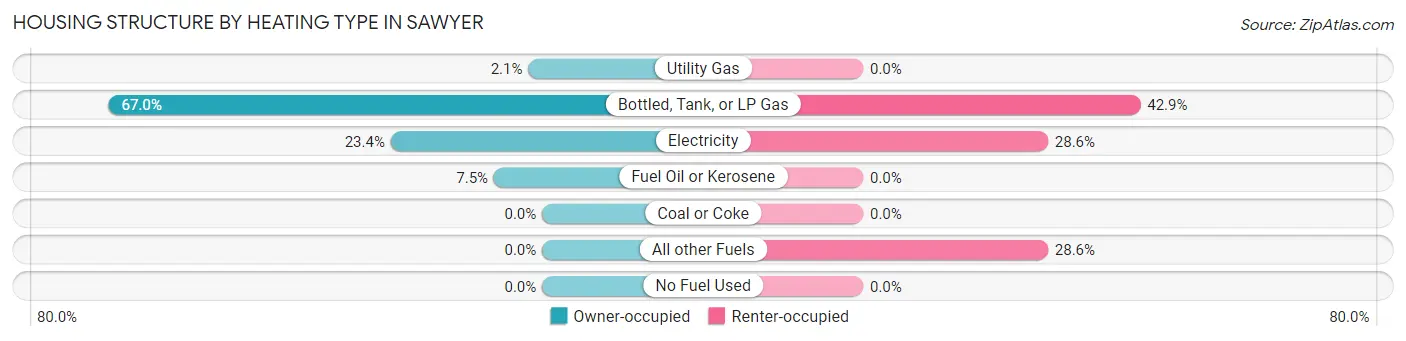
| Heating Type | Owner-occupied | Renter-occupied |
| Utility Gas | 2 (2.1%) | 0 (0.0%) |
| Bottled, Tank, or LP Gas | 63 (67.0%) | 6 (42.9%) |
| Electricity | 22 (23.4%) | 4 (28.6%) |
| Fuel Oil or Kerosene | 7 (7.4%) | 0 (0.0%) |
| Coal or Coke | 0 (0.0%) | 0 (0.0%) |
| All other Fuels | 0 (0.0%) | 4 (28.6%) |
| No Fuel Used | 0 (0.0%) | 0 (0.0%) |
| Total | 94 (100.0%) | 14 (100.0%) |
Household Vehicle Usage in Sawyer
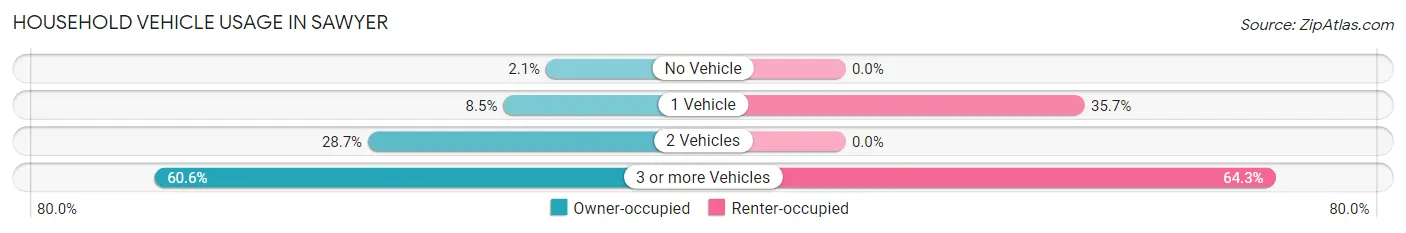
| Vehicles per Household | Owner-occupied | Renter-occupied |
| No Vehicle | 2 (2.1%) | 0 (0.0%) |
| 1 Vehicle | 8 (8.5%) | 5 (35.7%) |
| 2 Vehicles | 27 (28.7%) | 0 (0.0%) |
| 3 or more Vehicles | 57 (60.6%) | 9 (64.3%) |
| Total | 94 (100.0%) | 14 (100.0%) |
Real Estate & Mortgages in Sawyer
Real Estate and Mortgage Overview in Sawyer
| Characteristic | Without Mortgage | With Mortgage |
| Housing Units | 36 | 58 |
| Median Property Value | $163,900 | $162,500 |
| Median Household Income | $60,000 | $10 |
| Monthly Housing Costs | $600 | $0 |
| Real Estate Taxes | $1,833 | $0 |
Property Value by Mortgage Status in Sawyer
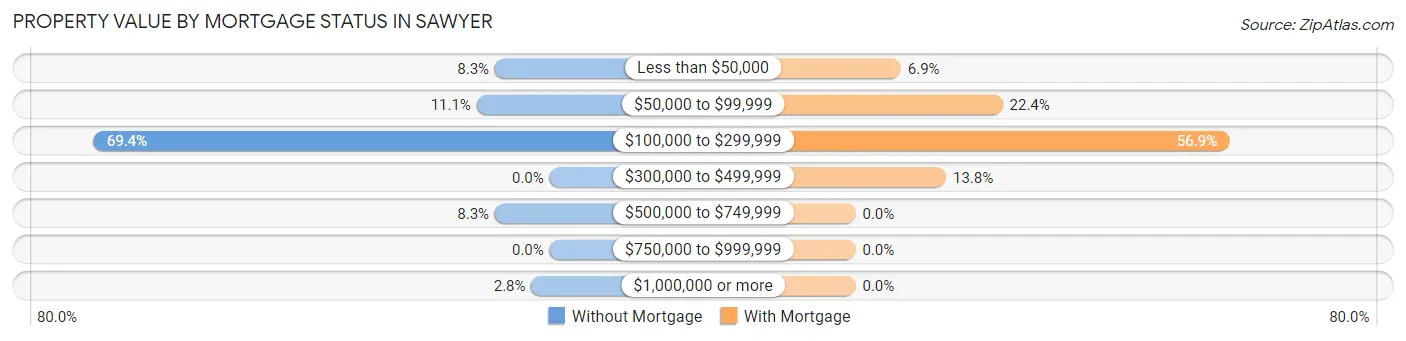
| Property Value | Without Mortgage | With Mortgage |
| Less than $50,000 | 3 (8.3%) | 4 (6.9%) |
| $50,000 to $99,999 | 4 (11.1%) | 13 (22.4%) |
| $100,000 to $299,999 | 25 (69.4%) | 33 (56.9%) |
| $300,000 to $499,999 | 0 (0.0%) | 8 (13.8%) |
| $500,000 to $749,999 | 3 (8.3%) | 0 (0.0%) |
| $750,000 to $999,999 | 0 (0.0%) | 0 (0.0%) |
| $1,000,000 or more | 1 (2.8%) | 0 (0.0%) |
| Total | 36 (100.0%) | 58 (100.0%) |
Household Income by Mortgage Status in Sawyer
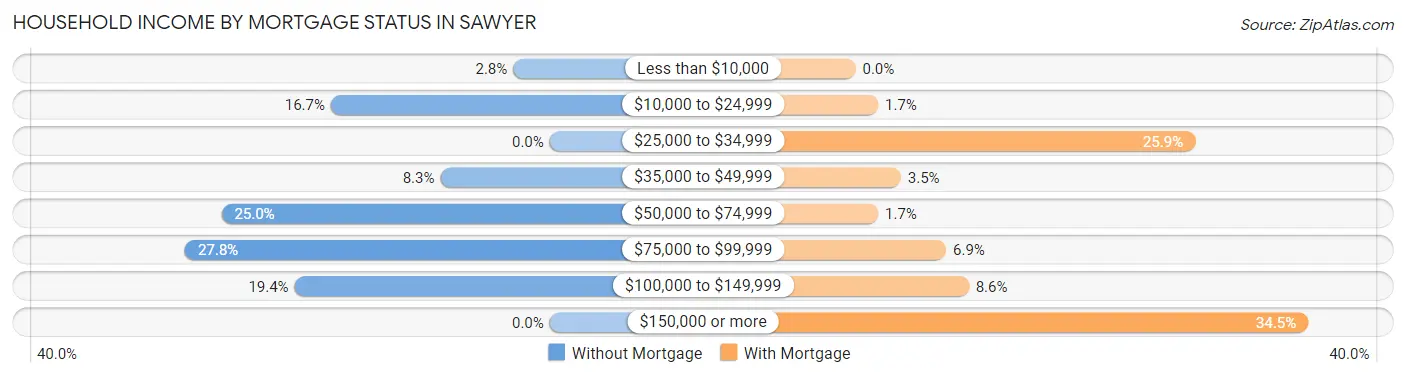
| Household Income | Without Mortgage | With Mortgage |
| Less than $10,000 | 1 (2.8%) | 0 (0.0%) |
| $10,000 to $24,999 | 6 (16.7%) | 1 (1.7%) |
| $25,000 to $34,999 | 0 (0.0%) | 15 (25.9%) |
| $35,000 to $49,999 | 3 (8.3%) | 2 (3.5%) |
| $50,000 to $74,999 | 9 (25.0%) | 1 (1.7%) |
| $75,000 to $99,999 | 10 (27.8%) | 4 (6.9%) |
| $100,000 to $149,999 | 7 (19.4%) | 5 (8.6%) |
| $150,000 or more | 0 (0.0%) | 20 (34.5%) |
| Total | 36 (100.0%) | 58 (100.0%) |
Property Value to Household Income Ratio in Sawyer
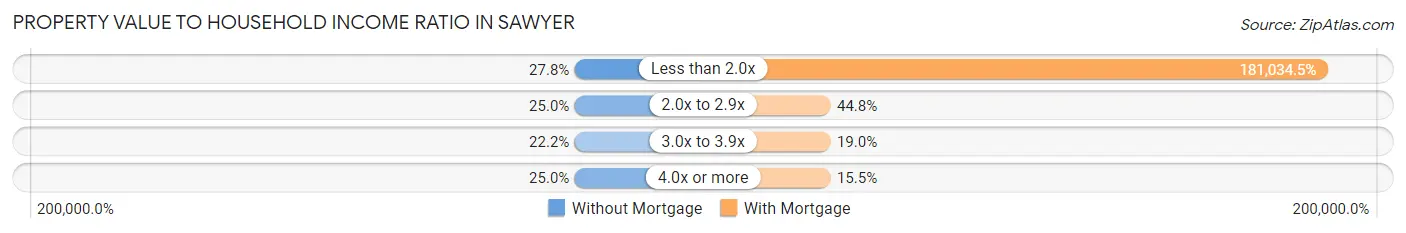
| Value-to-Income Ratio | Without Mortgage | With Mortgage |
| Less than 2.0x | 10 (27.8%) | 105,000 (181,034.5%) |
| 2.0x to 2.9x | 9 (25.0%) | 26 (44.8%) |
| 3.0x to 3.9x | 8 (22.2%) | 11 (19.0%) |
| 4.0x or more | 9 (25.0%) | 9 (15.5%) |
| Total | 36 (100.0%) | 58 (100.0%) |
Real Estate Taxes by Mortgage Status in Sawyer
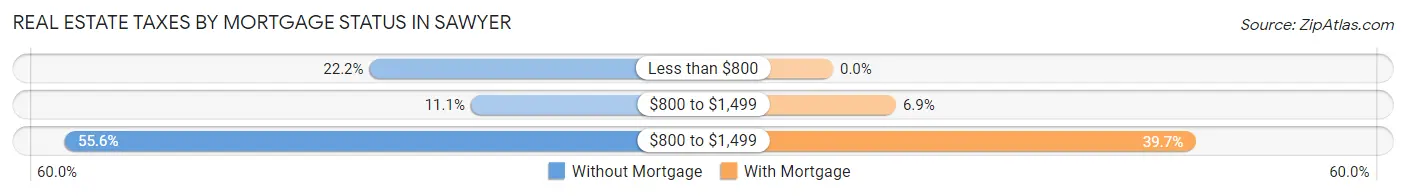
| Property Taxes | Without Mortgage | With Mortgage |
| Less than $800 | 8 (22.2%) | 0 (0.0%) |
| $800 to $1,499 | 4 (11.1%) | 4 (6.9%) |
| $800 to $1,499 | 20 (55.6%) | 23 (39.7%) |
| Total | 36 (100.0%) | 58 (100.0%) |
Health & Disability in Sawyer
Health Insurance Coverage by Age in Sawyer
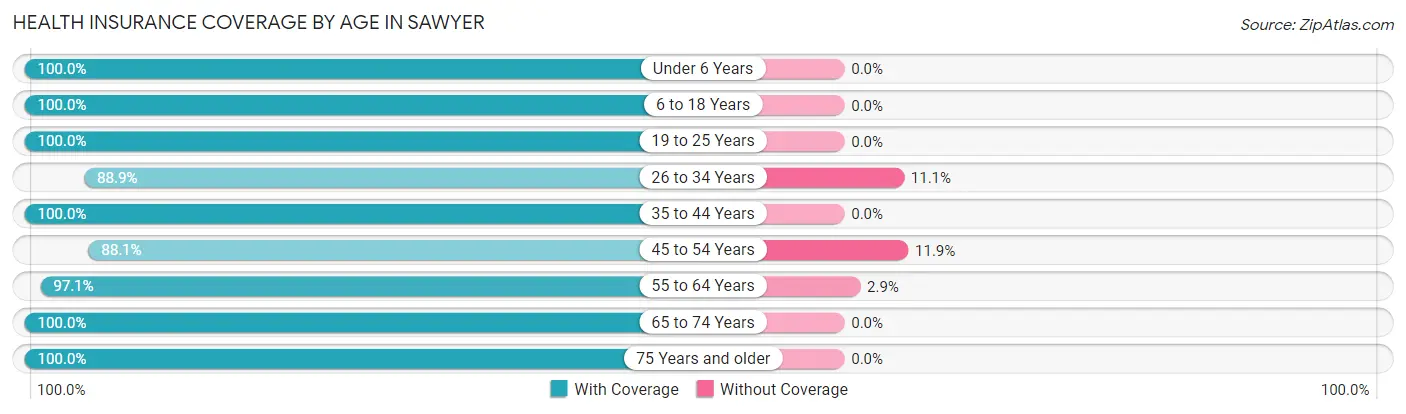
| Age Bracket | With Coverage | Without Coverage |
| Under 6 Years | 26 (100.0%) | 0 (0.0%) |
| 6 to 18 Years | 30 (100.0%) | 0 (0.0%) |
| 19 to 25 Years | 10 (100.0%) | 0 (0.0%) |
| 26 to 34 Years | 48 (88.9%) | 6 (11.1%) |
| 35 to 44 Years | 11 (100.0%) | 0 (0.0%) |
| 45 to 54 Years | 37 (88.1%) | 5 (11.9%) |
| 55 to 64 Years | 33 (97.1%) | 1 (2.9%) |
| 65 to 74 Years | 27 (100.0%) | 0 (0.0%) |
| 75 Years and older | 26 (100.0%) | 0 (0.0%) |
| Total | 248 (95.4%) | 12 (4.6%) |
Health Insurance Coverage by Citizenship Status in Sawyer
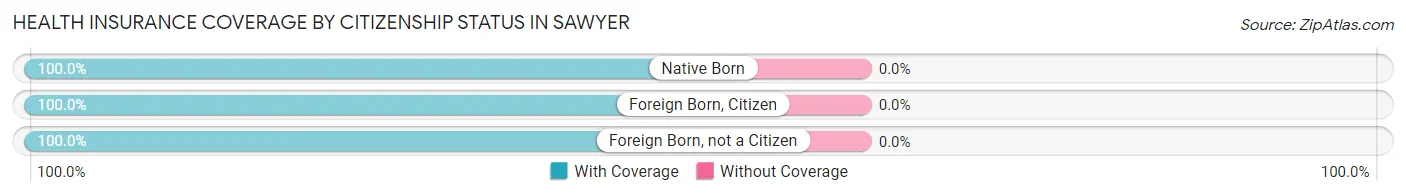
| Citizenship Status | With Coverage | Without Coverage |
| Native Born | 26 (100.0%) | 0 (0.0%) |
| Foreign Born, Citizen | 30 (100.0%) | 0 (0.0%) |
| Foreign Born, not a Citizen | 10 (100.0%) | 0 (0.0%) |
Health Insurance Coverage by Household Income in Sawyer
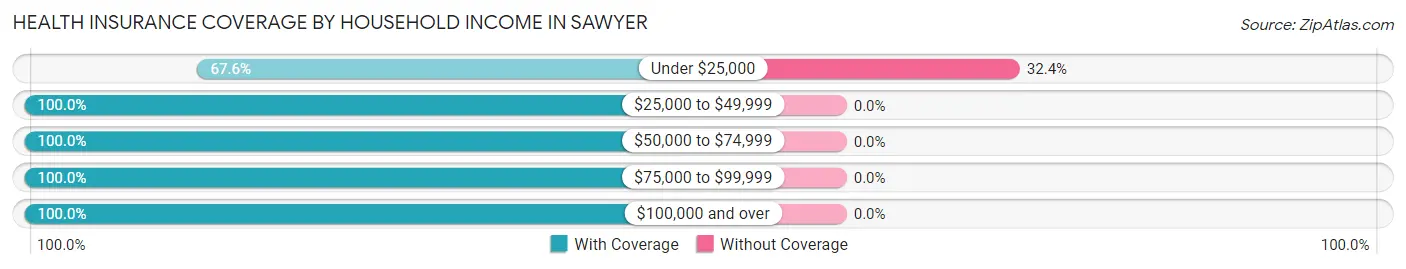
| Household Income | With Coverage | Without Coverage |
| Under $25,000 | 25 (67.6%) | 12 (32.4%) |
| $25,000 to $49,999 | 17 (100.0%) | 0 (0.0%) |
| $50,000 to $74,999 | 61 (100.0%) | 0 (0.0%) |
| $75,000 to $99,999 | 49 (100.0%) | 0 (0.0%) |
| $100,000 and over | 96 (100.0%) | 0 (0.0%) |
Public vs Private Health Insurance Coverage by Age in Sawyer
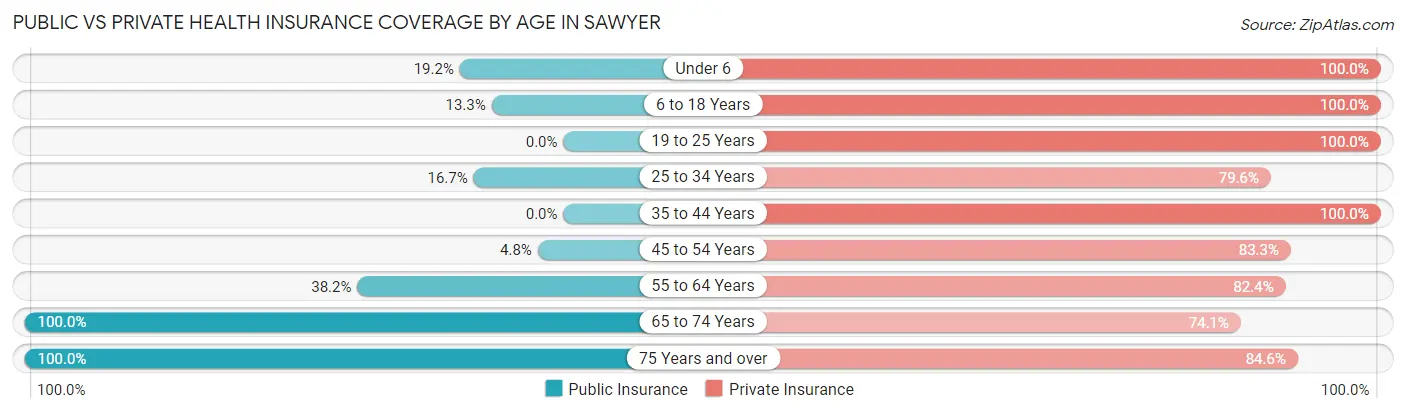
| Age Bracket | Public Insurance | Private Insurance |
| Under 6 | 5 (19.2%) | 26 (100.0%) |
| 6 to 18 Years | 4 (13.3%) | 30 (100.0%) |
| 19 to 25 Years | 0 (0.0%) | 10 (100.0%) |
| 25 to 34 Years | 9 (16.7%) | 43 (79.6%) |
| 35 to 44 Years | 0 (0.0%) | 11 (100.0%) |
| 45 to 54 Years | 2 (4.8%) | 35 (83.3%) |
| 55 to 64 Years | 13 (38.2%) | 28 (82.4%) |
| 65 to 74 Years | 27 (100.0%) | 20 (74.1%) |
| 75 Years and over | 26 (100.0%) | 22 (84.6%) |
| Total | 86 (33.1%) | 225 (86.5%) |
Disability Status by Sex by Age in Sawyer
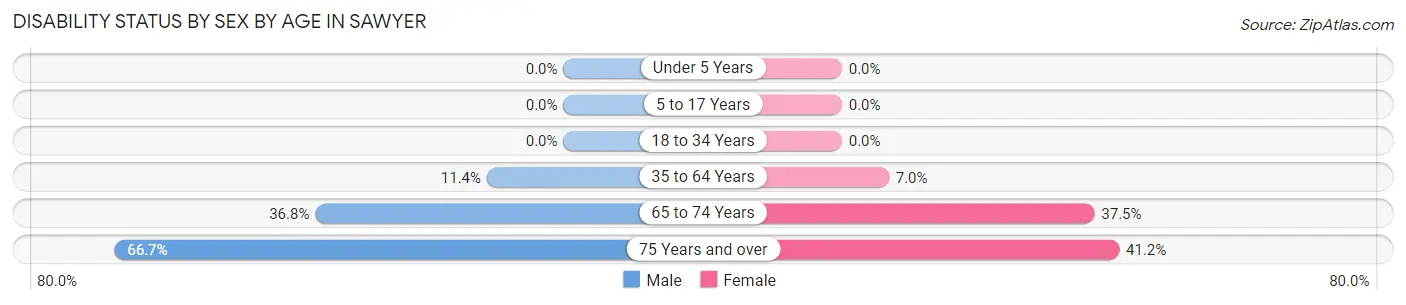
| Age Bracket | Male | Female |
| Under 5 Years | 0 (0.0%) | 0 (0.0%) |
| 5 to 17 Years | 0 (0.0%) | 0 (0.0%) |
| 18 to 34 Years | 0 (0.0%) | 0 (0.0%) |
| 35 to 64 Years | 5 (11.4%) | 3 (7.0%) |
| 65 to 74 Years | 7 (36.8%) | 3 (37.5%) |
| 75 Years and over | 6 (66.7%) | 7 (41.2%) |
Disability Class by Sex by Age in Sawyer
Disability Class: Hearing Difficulty
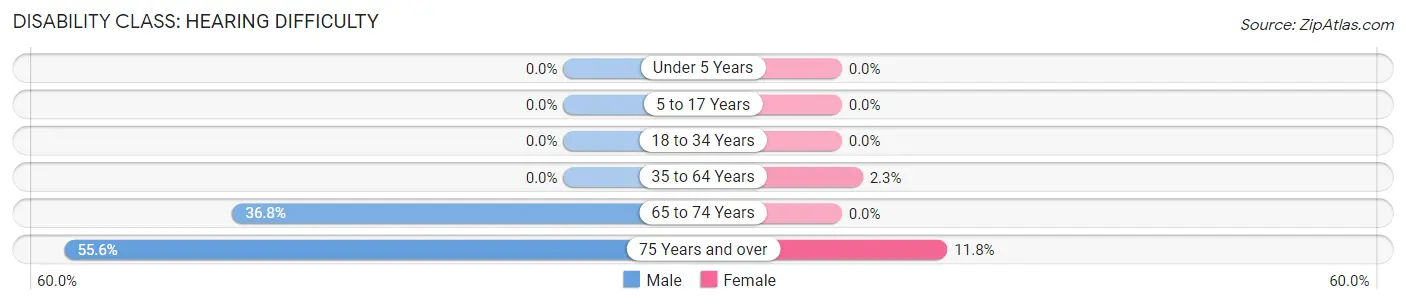
| Age Bracket | Male | Female |
| Under 5 Years | 0 (0.0%) | 0 (0.0%) |
| 5 to 17 Years | 0 (0.0%) | 0 (0.0%) |
| 18 to 34 Years | 0 (0.0%) | 0 (0.0%) |
| 35 to 64 Years | 0 (0.0%) | 1 (2.3%) |
| 65 to 74 Years | 7 (36.8%) | 0 (0.0%) |
| 75 Years and over | 5 (55.6%) | 2 (11.8%) |
Disability Class: Vision Difficulty
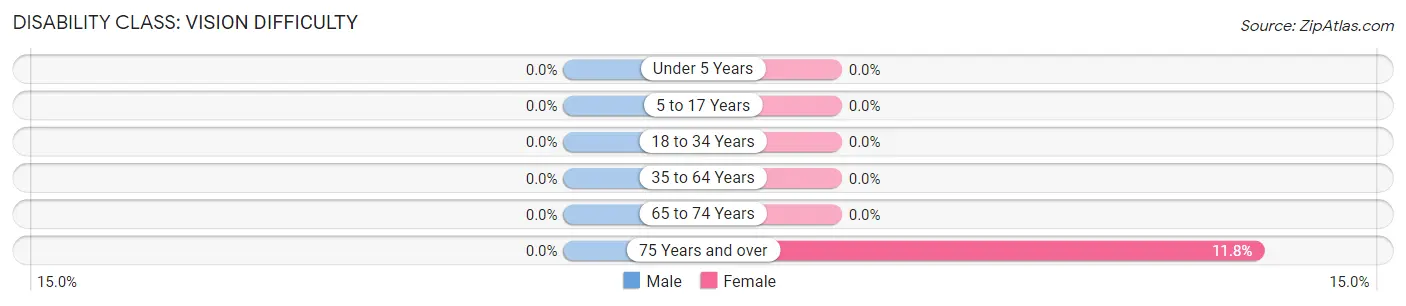
| Age Bracket | Male | Female |
| Under 5 Years | 0 (0.0%) | 0 (0.0%) |
| 5 to 17 Years | 0 (0.0%) | 0 (0.0%) |
| 18 to 34 Years | 0 (0.0%) | 0 (0.0%) |
| 35 to 64 Years | 0 (0.0%) | 0 (0.0%) |
| 65 to 74 Years | 0 (0.0%) | 0 (0.0%) |
| 75 Years and over | 0 (0.0%) | 2 (11.8%) |
Disability Class: Cognitive Difficulty
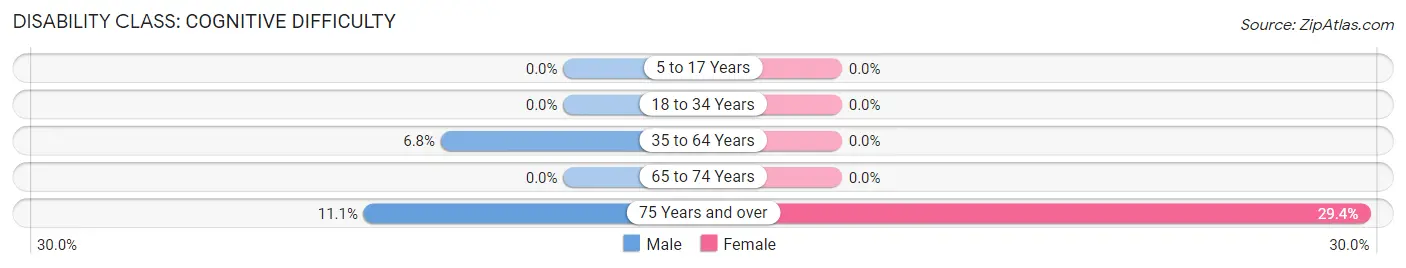
| Age Bracket | Male | Female |
| 5 to 17 Years | 0 (0.0%) | 0 (0.0%) |
| 18 to 34 Years | 0 (0.0%) | 0 (0.0%) |
| 35 to 64 Years | 3 (6.8%) | 0 (0.0%) |
| 65 to 74 Years | 0 (0.0%) | 0 (0.0%) |
| 75 Years and over | 1 (11.1%) | 5 (29.4%) |
Disability Class: Ambulatory Difficulty
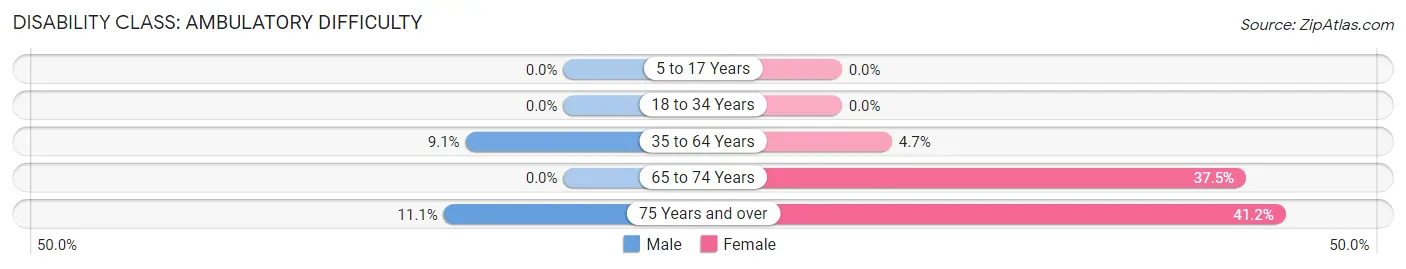
| Age Bracket | Male | Female |
| 5 to 17 Years | 0 (0.0%) | 0 (0.0%) |
| 18 to 34 Years | 0 (0.0%) | 0 (0.0%) |
| 35 to 64 Years | 4 (9.1%) | 2 (4.6%) |
| 65 to 74 Years | 0 (0.0%) | 3 (37.5%) |
| 75 Years and over | 1 (11.1%) | 7 (41.2%) |
Disability Class: Self-Care Difficulty
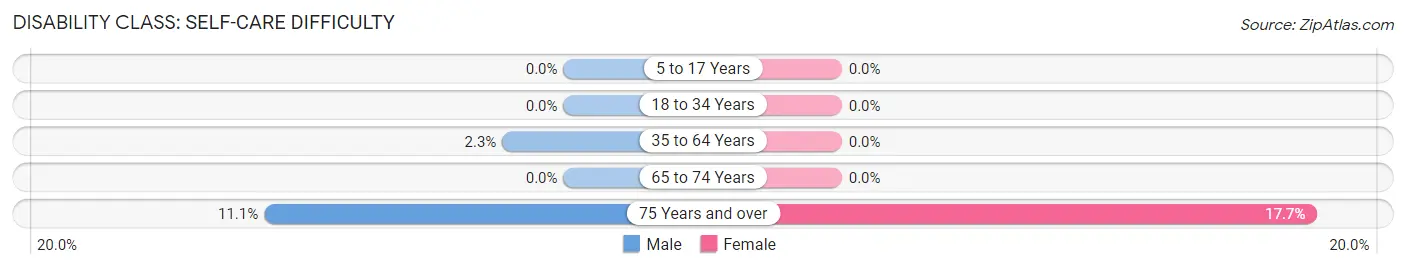
| Age Bracket | Male | Female |
| 5 to 17 Years | 0 (0.0%) | 0 (0.0%) |
| 18 to 34 Years | 0 (0.0%) | 0 (0.0%) |
| 35 to 64 Years | 1 (2.3%) | 0 (0.0%) |
| 65 to 74 Years | 0 (0.0%) | 0 (0.0%) |
| 75 Years and over | 1 (11.1%) | 3 (17.6%) |
Technology Access in Sawyer
Computing Device Access in Sawyer
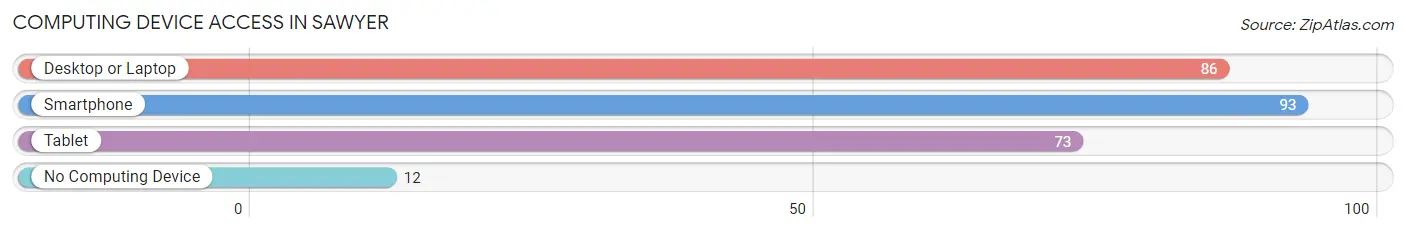
| Device Type | # Households | % Households |
| Desktop or Laptop | 86 | 79.6% |
| Smartphone | 93 | 86.1% |
| Tablet | 73 | 67.6% |
| No Computing Device | 12 | 11.1% |
| Total | 108 | 100.0% |
Internet Access in Sawyer
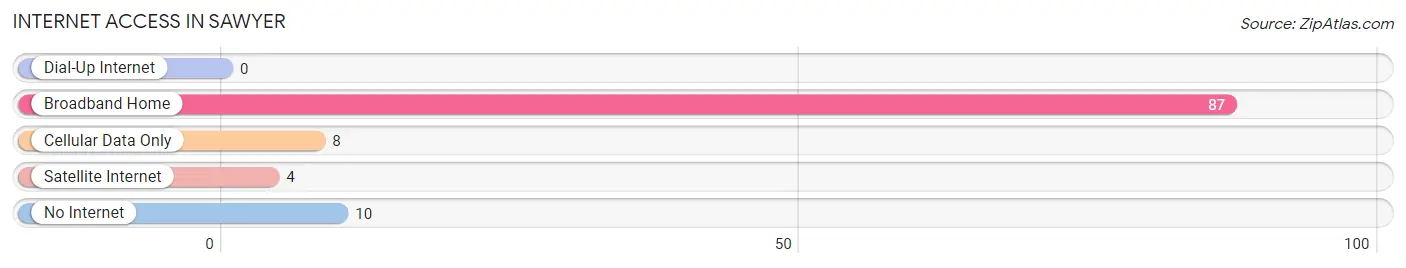
| Internet Type | # Households | % Households |
| Dial-Up Internet | 0 | 0.0% |
| Broadband Home | 87 | 80.6% |
| Cellular Data Only | 8 | 7.4% |
| Satellite Internet | 4 | 3.7% |
| No Internet | 10 | 9.3% |
| Total | 108 | 100.0% |
Sawyer Summary
Sawyer is a small city located in the northeastern corner of North Dakota, in the United States. It is situated in the Red River Valley, near the border with Minnesota. The city has a population of approximately 1,000 people, and is part of the Grand Forks metropolitan area.
History
Sawyer was founded in 1883 by a group of settlers from Minnesota. The city was named after the first settler, John Sawyer, who had come to the area in search of a better life. The city was incorporated in 1887, and the first post office was established in 1889.
The city grew slowly, but steadily, over the years. In the early 1900s, the city was home to a number of businesses, including a flour mill, a creamery, a lumber yard, and a hotel. The city also had a number of churches, including a Methodist church, a Lutheran church, and a Catholic church.
In the 1920s, the city experienced a period of growth, as the population increased and new businesses opened. The city was also home to a number of schools, including a high school, a grade school, and a business college.
In the 1950s, the city experienced a period of decline, as many of the businesses closed and the population decreased. However, in the late 1970s, the city began to experience a period of revitalization, as new businesses opened and the population began to increase.
Geography
Sawyer is located in the Red River Valley, near the border with Minnesota. The city is situated on the banks of the Red River, and is surrounded by rolling hills and farmland. The city is located approximately 30 miles north of Grand Forks, and is part of the Grand Forks metropolitan area.
The climate in Sawyer is generally mild, with cold winters and warm summers. The average temperature in the winter is around 20 degrees Fahrenheit, and the average temperature in the summer is around 70 degrees Fahrenheit.
Economy
The economy of Sawyer is largely based on agriculture and tourism. The city is home to a number of farms, which produce a variety of crops, including wheat, corn, soybeans, and potatoes. The city is also home to a number of tourist attractions, including a golf course, a museum, and a number of parks.
In addition to agriculture and tourism, the city is also home to a number of businesses, including a grocery store, a hardware store, and a number of restaurants. The city is also home to a number of manufacturing companies, which produce a variety of products, including furniture, clothing, and electronics.
Demographics
As of the 2010 census, the population of Sawyer was 1,000 people. The racial makeup of the city was 97.2% White, 0.7% African American, 0.3% Native American, 0.3% Asian, and 1.5% from other races. The median household income in the city was $41,250, and the median family income was $50,000.
The city is home to a number of churches, including a Methodist church, a Lutheran church, and a Catholic church. The city is also home to a number of schools, including a high school, a grade school, and a business college.
Conclusion
Sawyer is a small city located in the northeastern corner of North Dakota, in the United States. It is situated in the Red River Valley, near the border with Minnesota. The city has a population of approximately 1,000 people, and is part of the Grand Forks metropolitan area. The economy of Sawyer is largely based on agriculture and tourism, and the city is home to a number of businesses, churches, and schools. The racial makeup of the city is predominantly White, with a small percentage of African American, Native American, and Asian residents.
Common Questions
What is the Total Population of Sawyer?
Total Population of Sawyer is 261.
What is the Total Male Population of Sawyer?
Total Male Population of Sawyer is 132.
What is the Total Female Population of Sawyer?
Total Female Population of Sawyer is 129.
What is the Ratio of Males per 100 Females in Sawyer?
There are 102.33 Males per 100 Females in Sawyer.
What is the Ratio of Females per 100 Males in Sawyer?
There are 97.73 Females per 100 Males in Sawyer.
What is the Median Population Age in Sawyer?
Median Population Age in Sawyer is 43.7 Years.
What is the Average Family Size in Sawyer
Average Family Size in Sawyer is 2.6 People.
What is the Average Household Size in Sawyer
Average Household Size in Sawyer is 2.4 People.
What is Per Capita Income in Sawyer?
Per Capita income in Sawyer is $33,079.
What is the Median Family Income in Sawyer?
Median Family Income in Sawyer is $90,000.
What is the Median Household income in Sawyer?
Median Household Income in Sawyer is $74,375.
What is Inequality or Gini Index in Sawyer?
Inequality or Gini Index in Sawyer is 0.38.
How Large is the Labor Force in Sawyer?
There are 152 People in the Labor Forcein in Sawyer.
What is the Percentage of People in the Labor Force in Sawyer?
69.7% of People are in the Labor Force in Sawyer.
What is the Unemployment Rate in Sawyer?
Unemployment Rate in Sawyer is 0.7%.