Enderlin, ND
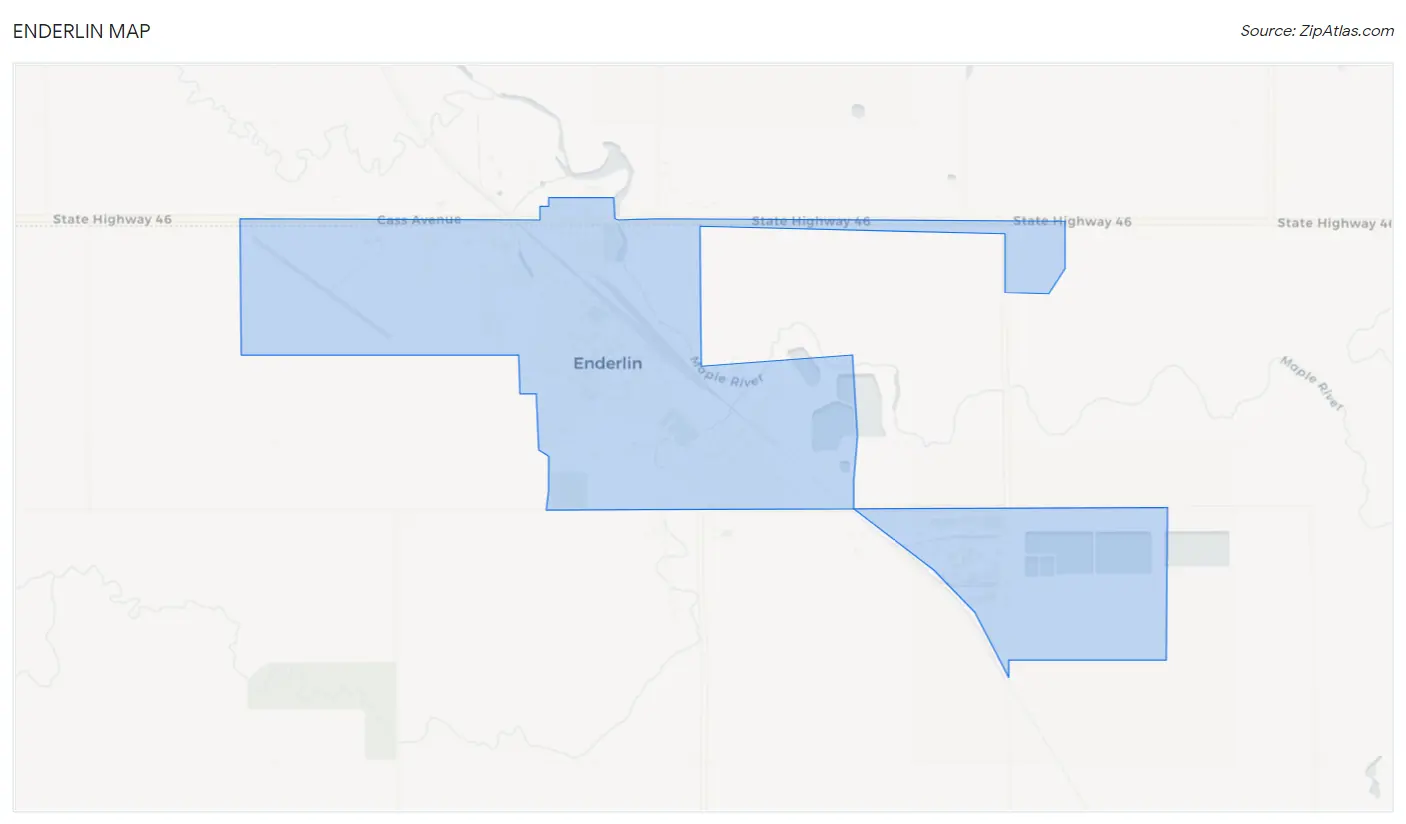
Enderlin Map
Enderlin Overview
1,030
TOTAL POPULATION
511
MALE POPULATION
519
FEMALE POPULATION
98.46
MALES / 100 FEMALES
101.57
FEMALES / 100 MALES
43.4
MEDIAN AGE
2.6
AVG FAMILY SIZE
2.0
AVG HOUSEHOLD SIZE
$34,010
PER CAPITA INCOME
$74,293
AVG FAMILY INCOME
$58,403
AVG HOUSEHOLD INCOME
3.9%
WAGE / INCOME GAP [ % ]
96.1¢/ $1
WAGE / INCOME GAP [ $ ]
0.38
INEQUALITY / GINI INDEX
501
LABOR FORCE [ PEOPLE ]
58.4%
PERCENT IN LABOR FORCE
4.4%
UNEMPLOYMENT RATE
Enderlin Zip Codes
Enderlin Area Codes
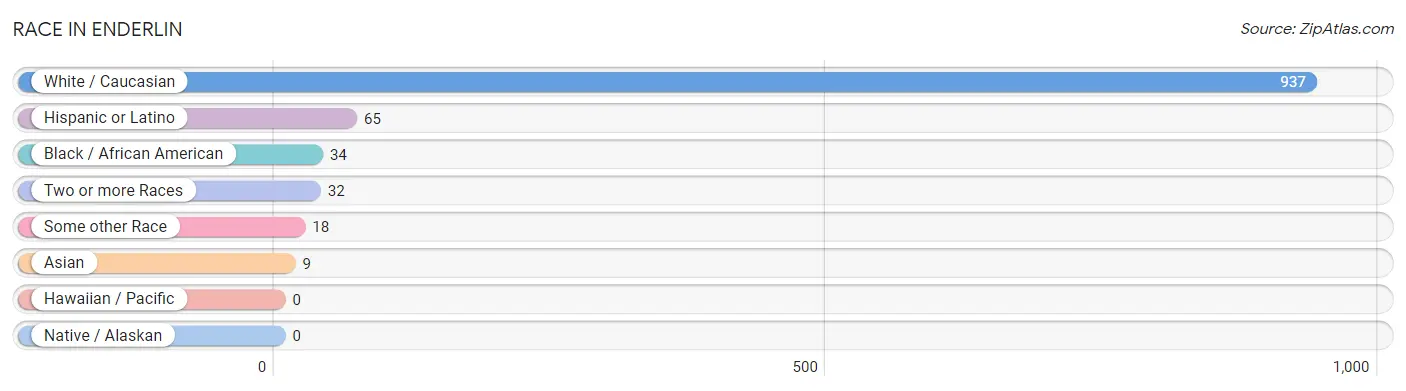
Race in Enderlin
The most populous races in Enderlin are White / Caucasian (937 | 91.0%), Hispanic or Latino (65 | 6.3%), and Black / African American (34 | 3.3%).
| Race | # Population | % Population |
| Asian | 9 | 0.9% |
| Black / African American | 34 | 3.3% |
| Hawaiian / Pacific | 0 | 0.0% |
| Hispanic or Latino | 65 | 6.3% |
| Native / Alaskan | 0 | 0.0% |
| White / Caucasian | 937 | 91.0% |
| Two or more Races | 32 | 3.1% |
| Some other Race | 18 | 1.8% |
| Total | 1,030 | 100.0% |
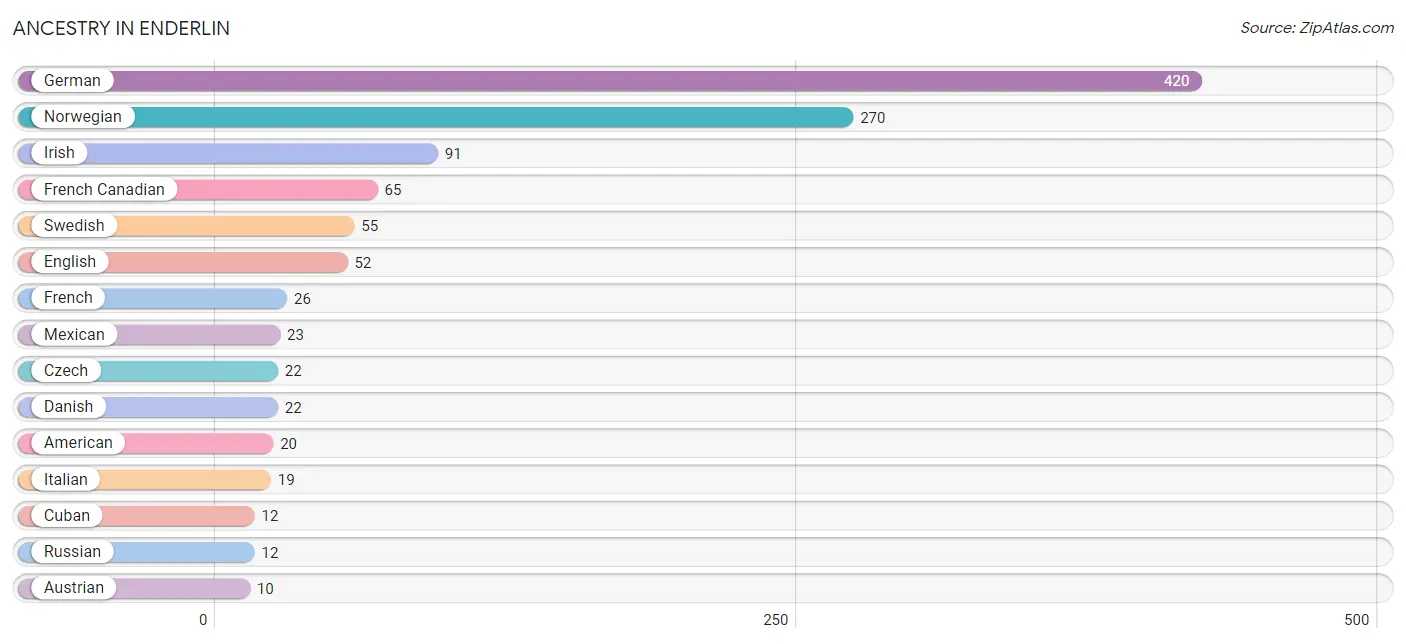
Ancestry in Enderlin
The most populous ancestries reported in Enderlin are German (420 | 40.8%), Norwegian (270 | 26.2%), Irish (91 | 8.8%), French Canadian (65 | 6.3%), and Swedish (55 | 5.3%), together accounting for 87.5% of all Enderlin residents.
| Ancestry | # Population | % Population |
| African | 8 | 0.8% |
| American | 20 | 1.9% |
| Austrian | 10 | 1.0% |
| Belgian | 3 | 0.3% |
| Blackfeet | 4 | 0.4% |
| Colombian | 6 | 0.6% |
| Cuban | 12 | 1.2% |
| Czech | 22 | 2.1% |
| Danish | 22 | 2.1% |
| Dutch | 7 | 0.7% |
| English | 52 | 5.1% |
| European | 5 | 0.5% |
| French | 26 | 2.5% |
| French American Indian | 4 | 0.4% |
| French Canadian | 65 | 6.3% |
| German | 420 | 40.8% |
| Hungarian | 6 | 0.6% |
| Icelander | 3 | 0.3% |
| Irish | 91 | 8.8% |
| Italian | 19 | 1.8% |
| Mexican | 23 | 2.2% |
| Norwegian | 270 | 26.2% |
| Pakistani | 9 | 0.9% |
| Polish | 10 | 1.0% |
| Russian | 12 | 1.2% |
| Scandinavian | 4 | 0.4% |
| Scotch-Irish | 10 | 1.0% |
| Scottish | 3 | 0.3% |
| South American | 6 | 0.6% |
| Subsaharan African | 8 | 0.8% |
| Swedish | 55 | 5.3% |
| Ukrainian | 2 | 0.2% | View All 32 Rows |
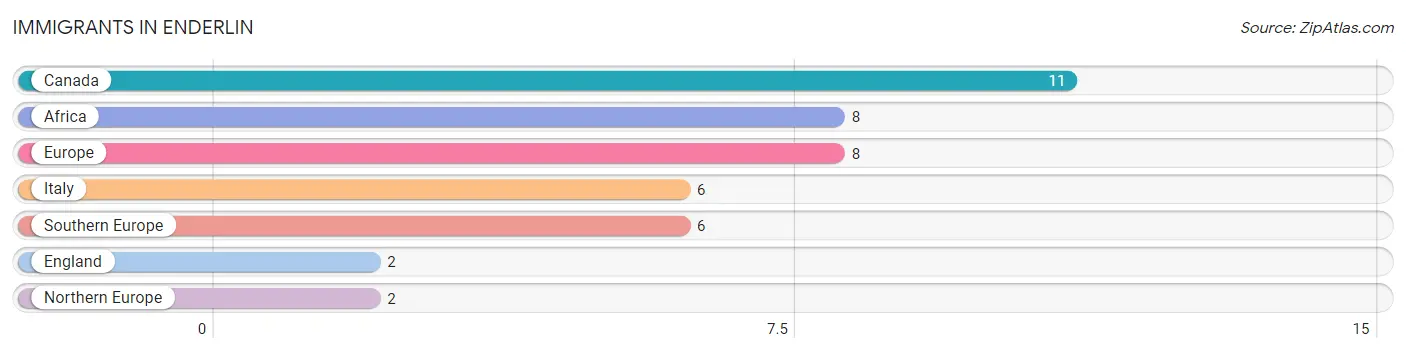
Immigrants in Enderlin
The most numerous immigrant groups reported in Enderlin came from Canada (11 | 1.1%), Africa (8 | 0.8%), Europe (8 | 0.8%), Italy (6 | 0.6%), and Southern Europe (6 | 0.6%), together accounting for 3.8% of all Enderlin residents.
| Immigration Origin | # Population | % Population |
| Africa | 8 | 0.8% |
| Canada | 11 | 1.1% |
| England | 2 | 0.2% |
| Europe | 8 | 0.8% |
| Italy | 6 | 0.6% |
| Northern Europe | 2 | 0.2% |
| Southern Europe | 6 | 0.6% | View All 7 Rows |
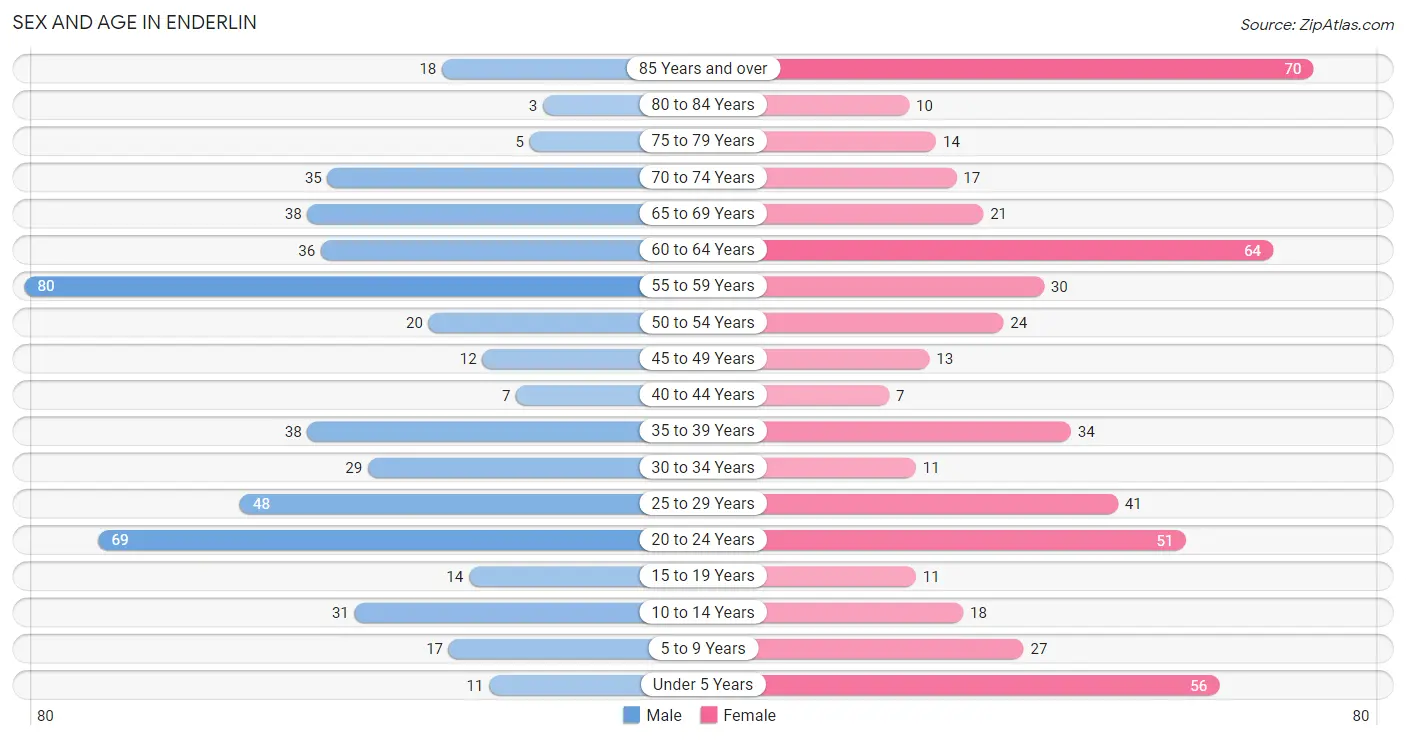
Sex and Age in Enderlin
Sex and Age in Enderlin
The most populous age groups in Enderlin are 55 to 59 Years (80 | 15.7%) for men and 85 Years and over (70 | 13.5%) for women.
| Age Bracket | Male | Female |
| Under 5 Years | 11 (2.1%) | 56 (10.8%) |
| 5 to 9 Years | 17 (3.3%) | 27 (5.2%) |
| 10 to 14 Years | 31 (6.1%) | 18 (3.5%) |
| 15 to 19 Years | 14 (2.7%) | 11 (2.1%) |
| 20 to 24 Years | 69 (13.5%) | 51 (9.8%) |
| 25 to 29 Years | 48 (9.4%) | 41 (7.9%) |
| 30 to 34 Years | 29 (5.7%) | 11 (2.1%) |
| 35 to 39 Years | 38 (7.4%) | 34 (6.6%) |
| 40 to 44 Years | 7 (1.4%) | 7 (1.3%) |
| 45 to 49 Years | 12 (2.4%) | 13 (2.5%) |
| 50 to 54 Years | 20 (3.9%) | 24 (4.6%) |
| 55 to 59 Years | 80 (15.7%) | 30 (5.8%) |
| 60 to 64 Years | 36 (7.0%) | 64 (12.3%) |
| 65 to 69 Years | 38 (7.4%) | 21 (4.1%) |
| 70 to 74 Years | 35 (6.9%) | 17 (3.3%) |
| 75 to 79 Years | 5 (1.0%) | 14 (2.7%) |
| 80 to 84 Years | 3 (0.6%) | 10 (1.9%) |
| 85 Years and over | 18 (3.5%) | 70 (13.5%) |
| Total | 511 (100.0%) | 519 (100.0%) |
Families and Households in Enderlin
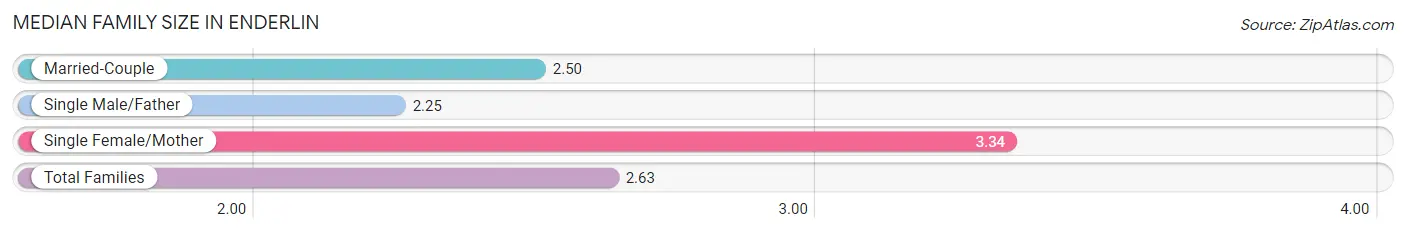
Median Family Size in Enderlin
The median family size in Enderlin is 2.63 persons per family, with single female/mother families (41 | 16.2%) accounting for the largest median family size of 3.34 persons per family. On the other hand, single male/father families (4 | 1.6%) represent the smallest median family size with 2.25 persons per family.
| Family Type | # Families | Family Size |
| Married-Couple | 208 (82.2%) | 2.50 |
| Single Male/Father | 4 (1.6%) | 2.25 |
| Single Female/Mother | 41 (16.2%) | 3.34 |
| Total Families | 253 (100.0%) | 2.63 |
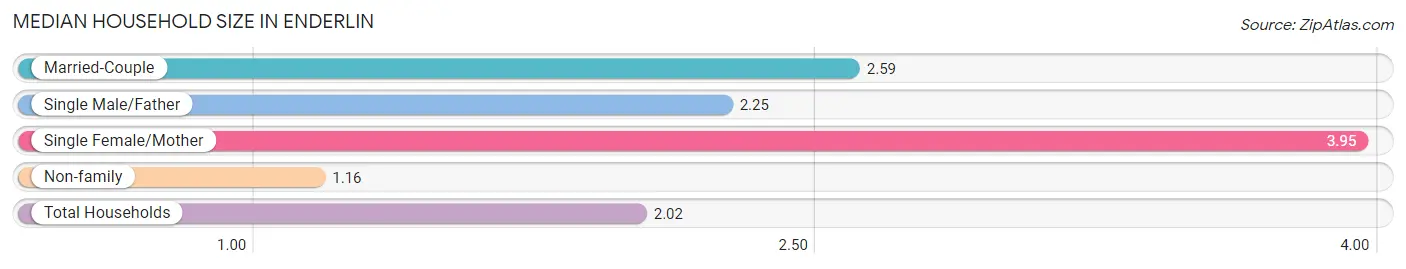
Median Household Size in Enderlin
The median household size in Enderlin is 2.02 persons per household, with single female/mother households (41 | 8.5%) accounting for the largest median household size of 3.95 persons per household. non-family households (228 | 47.4%) represent the smallest median household size with 1.16 persons per household.
| Household Type | # Households | Household Size |
| Married-Couple | 208 (43.2%) | 2.59 |
| Single Male/Father | 4 (0.8%) | 2.25 |
| Single Female/Mother | 41 (8.5%) | 3.95 |
| Non-family | 228 (47.4%) | 1.16 |
| Total Households | 481 (100.0%) | 2.02 |
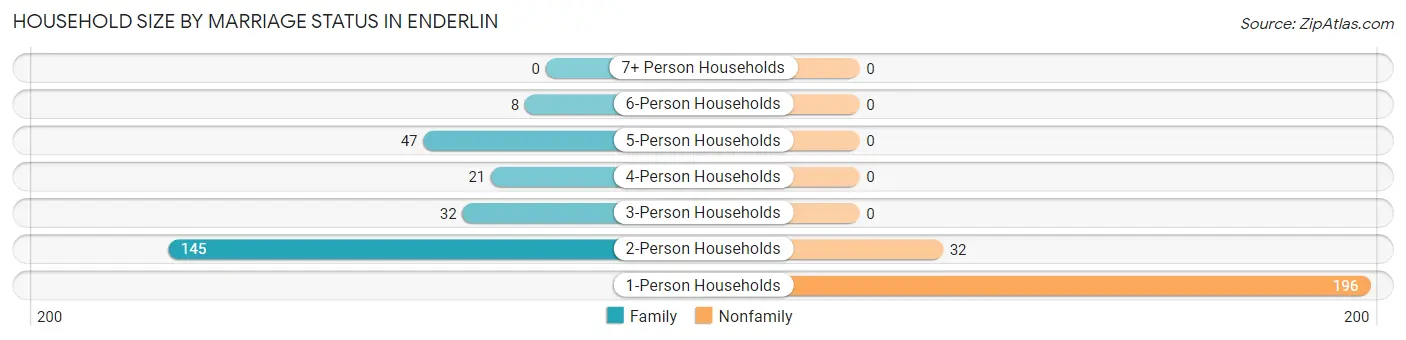
Household Size by Marriage Status in Enderlin
Out of a total of 481 households in Enderlin, 253 (52.6%) are family households, while 228 (47.4%) are nonfamily households. The most numerous type of family households are 2-person households, comprising 145, and the most common type of nonfamily households are 1-person households, comprising 196.
| Household Size | Family Households | Nonfamily Households |
| 1-Person Households | - | 196 (40.7%) |
| 2-Person Households | 145 (30.1%) | 32 (6.7%) |
| 3-Person Households | 32 (6.7%) | 0 (0.0%) |
| 4-Person Households | 21 (4.4%) | 0 (0.0%) |
| 5-Person Households | 47 (9.8%) | 0 (0.0%) |
| 6-Person Households | 8 (1.7%) | 0 (0.0%) |
| 7+ Person Households | 0 (0.0%) | 0 (0.0%) |
| Total | 253 (52.6%) | 228 (47.4%) |
Female Fertility in Enderlin
Fertility by Age in Enderlin
Average fertility rate in Enderlin is 137.0 births per 1,000 women. Women in the age bracket of 20 to 34 years have the highest fertility rate with 223.0 births per 1,000 women. Women in the age bracket of 20 to 34 years acount for 100.0% of all women with births.
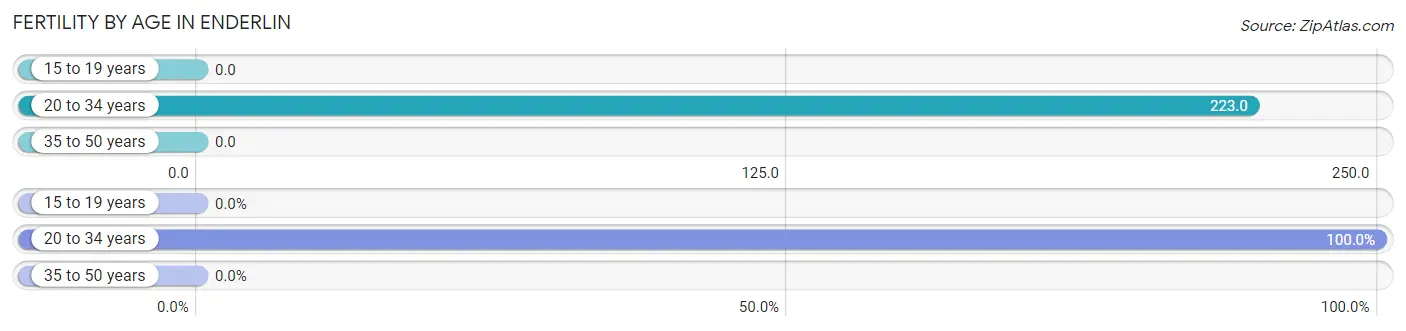
| Age Bracket | Women with Births | Births / 1,000 Women |
| 15 to 19 years | 0 (0.0%) | 0.0 |
| 20 to 34 years | 23 (100.0%) | 223.0 |
| 35 to 50 years | 0 (0.0%) | 0.0 |
| Total | 23 (100.0%) | 137.0 |
Fertility by Age by Marriage Status in Enderlin
47.8% of women with births (23) in Enderlin are married. The highest percentage of unmarried women with births falls into 20 to 34 years age bracket with 52.2% of them unmarried at the time of birth, while the lowest percentage of unmarried women with births belong to 20 to 34 years age bracket with 52.2% of them unmarried.
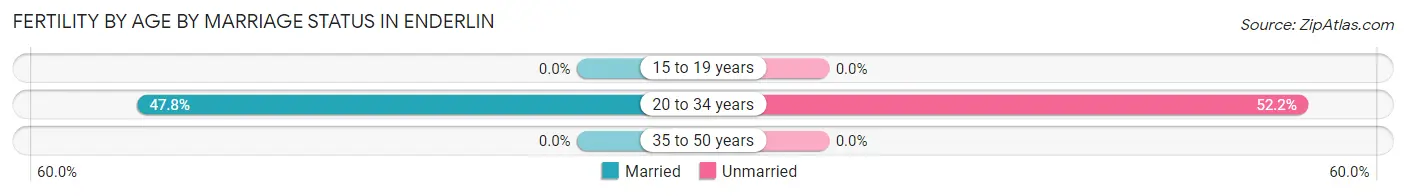
| Age Bracket | Married | Unmarried |
| 15 to 19 years | 0 (0.0%) | 0 (0.0%) |
| 20 to 34 years | 11 (47.8%) | 12 (52.2%) |
| 35 to 50 years | 0 (0.0%) | 0 (0.0%) |
| Total | 11 (47.8%) | 12 (52.2%) |
Fertility by Education in Enderlin
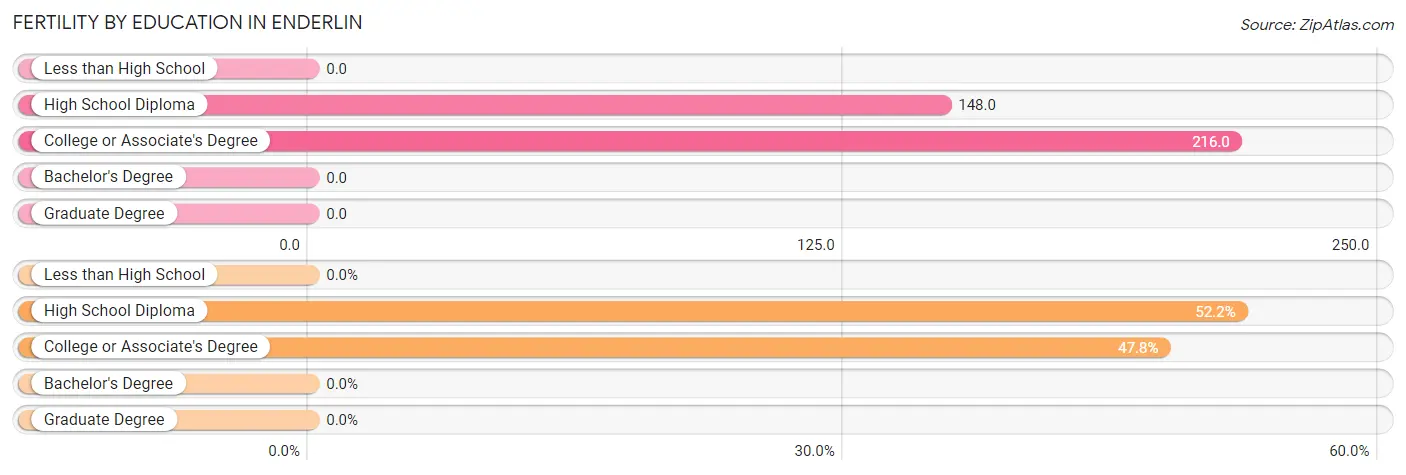
| Educational Attainment | Women with Births | Births / 1,000 Women |
| Less than High School | 0 (0.0%) | 0.0 |
| High School Diploma | 12 (52.2%) | 148.0 |
| College or Associate's Degree | 11 (47.8%) | 216.0 |
| Bachelor's Degree | 0 (0.0%) | 0.0 |
| Graduate Degree | 0 (0.0%) | 0.0 |
| Total | 23 (100.0%) | 137.0 |
Fertility by Education by Marriage Status in Enderlin
52.2% of women with births in Enderlin are unmarried. Women with the educational attainment of college or associate's degree are most likely to be married with 100.0% of them married at childbirth, while women with the educational attainment of high school diploma are least likely to be married with 100.0% of them unmarried at childbirth.
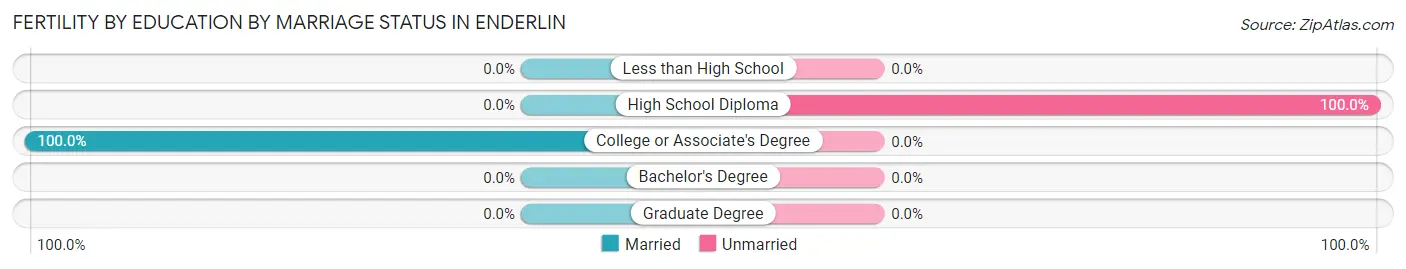
| Educational Attainment | Married | Unmarried |
| Less than High School | 0 (0.0%) | 0 (0.0%) |
| High School Diploma | 0 (0.0%) | 12 (100.0%) |
| College or Associate's Degree | 11 (100.0%) | 0 (0.0%) |
| Bachelor's Degree | 0 (0.0%) | 0 (0.0%) |
| Graduate Degree | 0 (0.0%) | 0 (0.0%) |
| Total | 11 (47.8%) | 12 (52.2%) |
Income in Enderlin
Income Overview in Enderlin
Per Capita Income in Enderlin is $34,010, while median incomes of families and households are $74,293 and $58,403 respectively.
| Characteristic | Number | Measure |
| Per Capita Income | 1,030 | $34,010 |
| Median Family Income | 253 | $74,293 |
| Mean Family Income | 253 | $89,865 |
| Median Household Income | 481 | $58,403 |
| Mean Household Income | 481 | $70,951 |
| Income Deficit | 253 | $0 |
| Wage / Income Gap (%) | 1,030 | 3.89% |
| Wage / Income Gap ($) | 1,030 | 96.11¢ per $1 |
| Gini / Inequality Index | 1,030 | 0.38 |
Earnings by Sex in Enderlin
Average Earnings in Enderlin are $40,069, $40,577 for men and $39,000 for women, a difference of 3.9%.
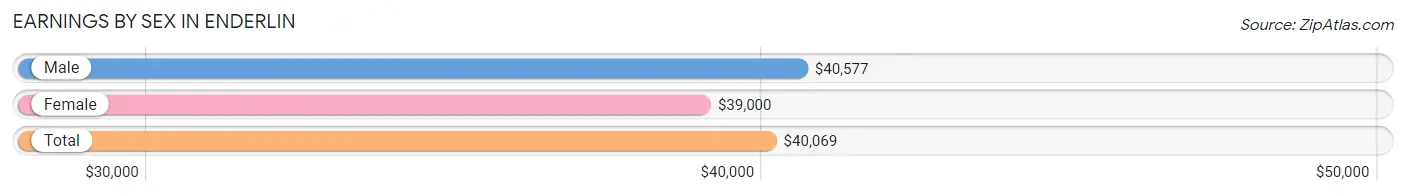
| Sex | Number | Average Earnings |
| Male | 326 (57.8%) | $40,577 |
| Female | 238 (42.2%) | $39,000 |
| Total | 564 (100.0%) | $40,069 |
Earnings by Sex by Income Bracket in Enderlin
The most common earnings brackets in Enderlin are $25,000 to $29,999 for men (84 | 25.8%) and $40,000 to $44,999 for women (36 | 15.1%).
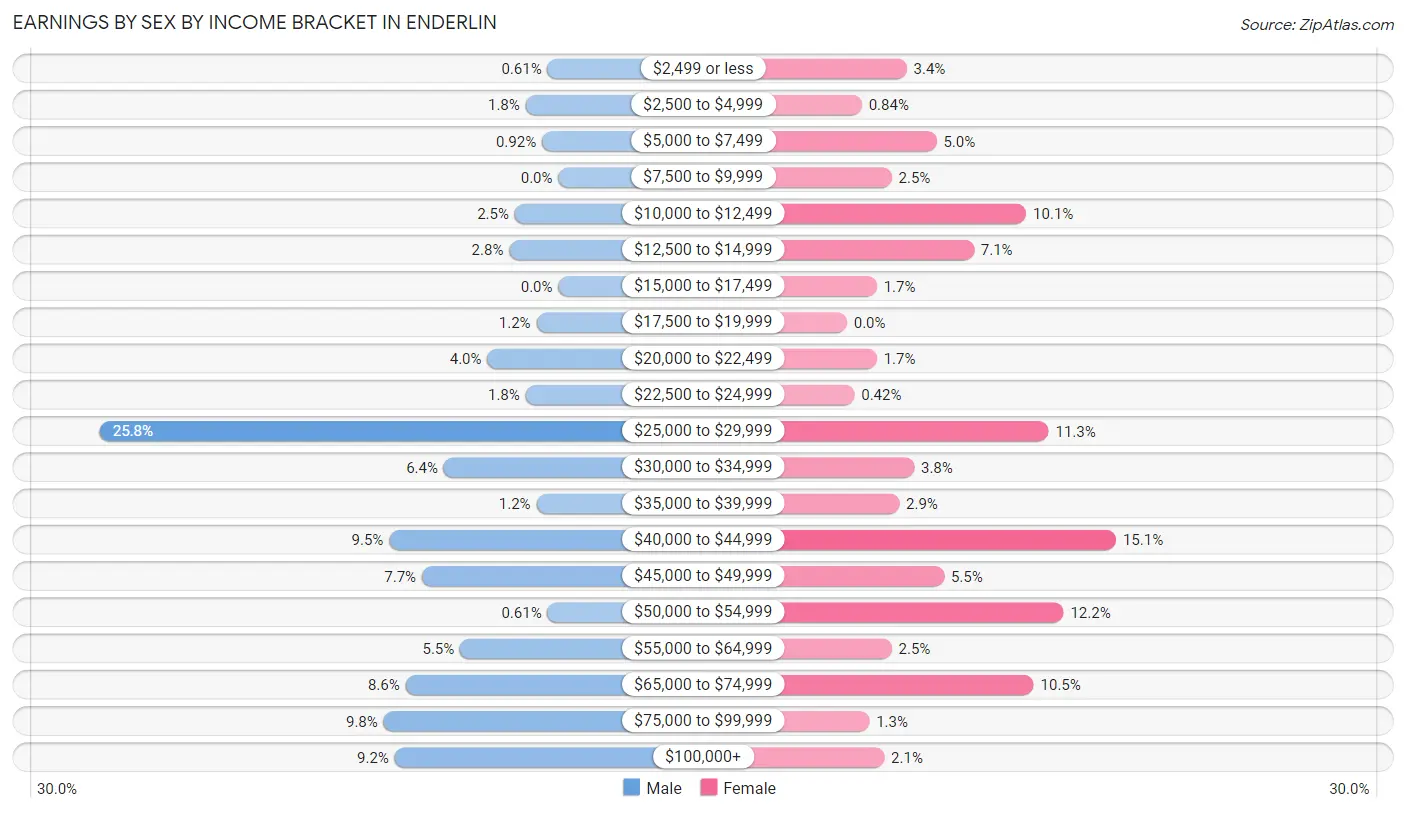
| Income | Male | Female |
| $2,499 or less | 2 (0.6%) | 8 (3.4%) |
| $2,500 to $4,999 | 6 (1.8%) | 2 (0.8%) |
| $5,000 to $7,499 | 3 (0.9%) | 12 (5.0%) |
| $7,500 to $9,999 | 0 (0.0%) | 6 (2.5%) |
| $10,000 to $12,499 | 8 (2.5%) | 24 (10.1%) |
| $12,500 to $14,999 | 9 (2.8%) | 17 (7.1%) |
| $15,000 to $17,499 | 0 (0.0%) | 4 (1.7%) |
| $17,500 to $19,999 | 4 (1.2%) | 0 (0.0%) |
| $20,000 to $22,499 | 13 (4.0%) | 4 (1.7%) |
| $22,500 to $24,999 | 6 (1.8%) | 1 (0.4%) |
| $25,000 to $29,999 | 84 (25.8%) | 27 (11.3%) |
| $30,000 to $34,999 | 21 (6.4%) | 9 (3.8%) |
| $35,000 to $39,999 | 4 (1.2%) | 7 (2.9%) |
| $40,000 to $44,999 | 31 (9.5%) | 36 (15.1%) |
| $45,000 to $49,999 | 25 (7.7%) | 13 (5.5%) |
| $50,000 to $54,999 | 2 (0.6%) | 29 (12.2%) |
| $55,000 to $64,999 | 18 (5.5%) | 6 (2.5%) |
| $65,000 to $74,999 | 28 (8.6%) | 25 (10.5%) |
| $75,000 to $99,999 | 32 (9.8%) | 3 (1.3%) |
| $100,000+ | 30 (9.2%) | 5 (2.1%) |
| Total | 326 (100.0%) | 238 (100.0%) |
Earnings by Sex by Educational Attainment in Enderlin
Average earnings in Enderlin are $43,681 for men and $41,902 for women, a difference of 4.1%. Men with an educational attainment of bachelor's degree enjoy the highest average annual earnings of $82,500, while those with high school diploma education earn the least with $29,939. Women with an educational attainment of high school diploma earn the most with the average annual earnings of $51,563, while those with less than high school education have the smallest earnings of $26,875.
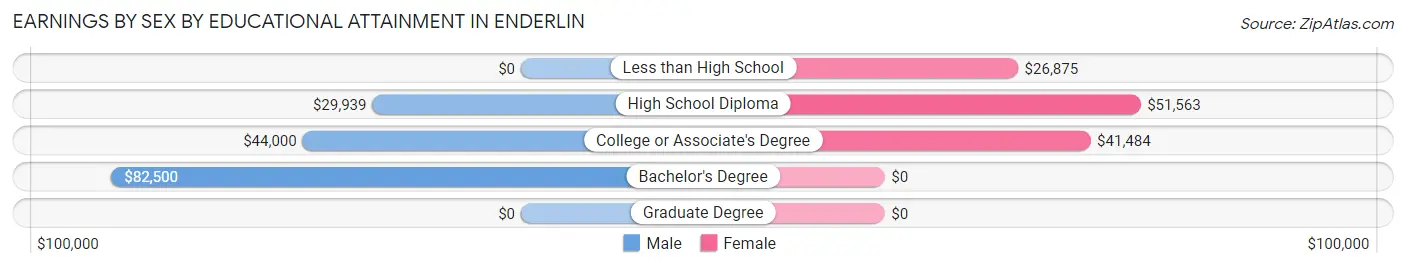
| Educational Attainment | Male Income | Female Income |
| Less than High School | - | - |
| High School Diploma | $29,939 | $51,563 |
| College or Associate's Degree | $44,000 | $41,484 |
| Bachelor's Degree | $82,500 | $0 |
| Graduate Degree | - | - |
| Total | $43,681 | $41,902 |
Family Income in Enderlin
Family Income Brackets in Enderlin
According to the Enderlin family income data, there are 85 families falling into the $50,000 to $74,999 income range, which is the most common income bracket and makes up 33.6% of all families. Conversely, the less than $10,000 income bracket is the least frequent group with only 1 families (0.4%) belonging to this category.
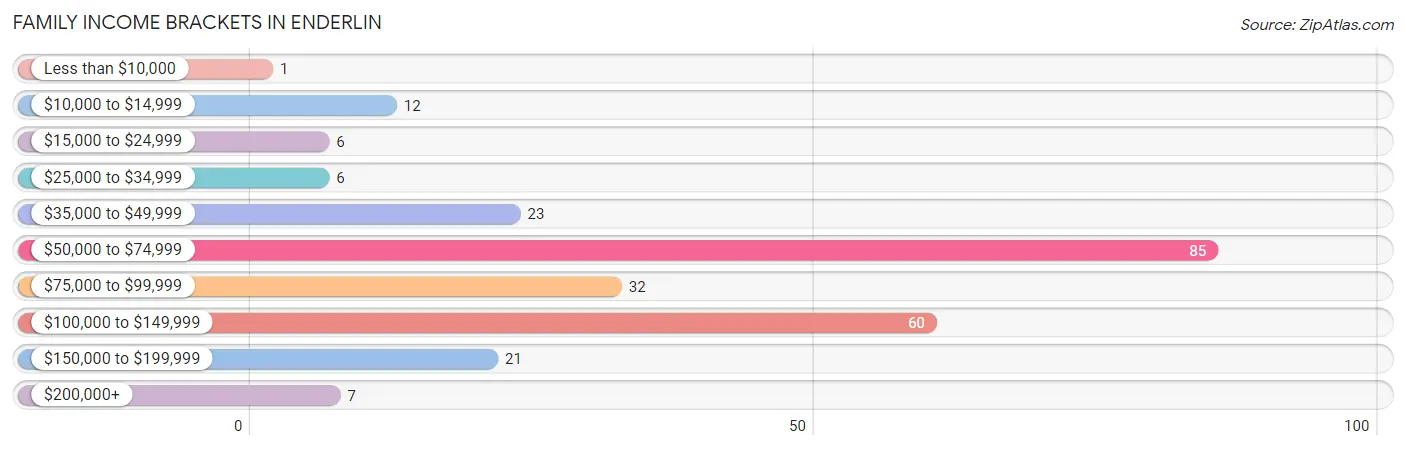
| Income Bracket | # Families | % Families |
| Less than $10,000 | 1 | 0.4% |
| $10,000 to $14,999 | 12 | 4.7% |
| $15,000 to $24,999 | 6 | 2.4% |
| $25,000 to $34,999 | 6 | 2.4% |
| $35,000 to $49,999 | 23 | 9.1% |
| $50,000 to $74,999 | 85 | 33.6% |
| $75,000 to $99,999 | 32 | 12.6% |
| $100,000 to $149,999 | 60 | 23.7% |
| $150,000 to $199,999 | 21 | 8.3% |
| $200,000+ | 7 | 2.8% |
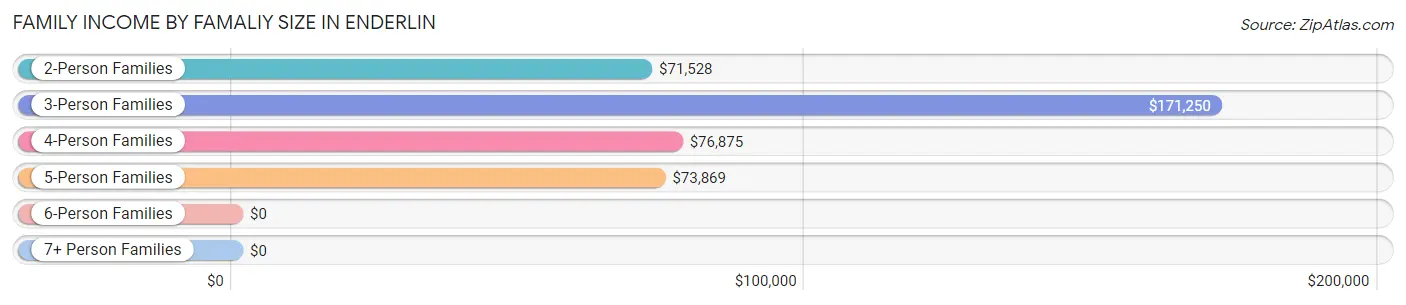
Family Income by Famaliy Size in Enderlin
3-person families (14 | 5.5%) account for the highest median family income in Enderlin with $171,250 per family, while 3-person families (14 | 5.5%) have the highest median income of $57,083 per family member.
| Income Bracket | # Families | Median Income |
| 2-Person Families | 164 (64.8%) | $71,528 |
| 3-Person Families | 14 (5.5%) | $171,250 |
| 4-Person Families | 27 (10.7%) | $76,875 |
| 5-Person Families | 47 (18.6%) | $73,869 |
| 6-Person Families | 1 (0.4%) | $0 |
| 7+ Person Families | 0 (0.0%) | $0 |
| Total | 253 (100.0%) | $74,293 |
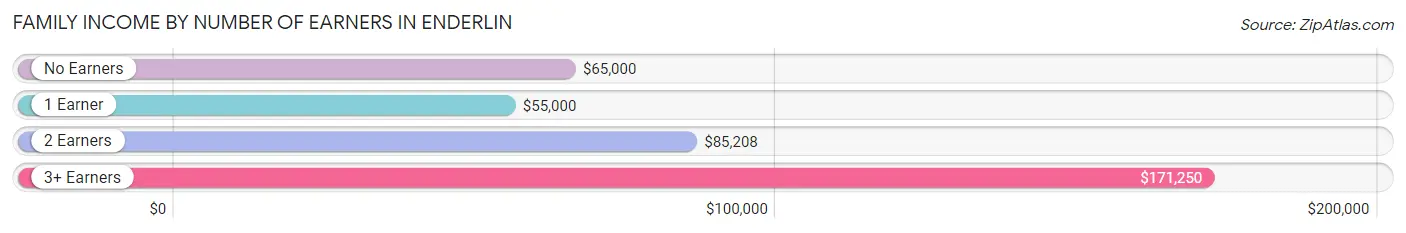
Family Income by Number of Earners in Enderlin
The median family income in Enderlin is $74,293, with families comprising 3+ earners (14) having the highest median family income of $171,250, while families with 1 earner (94) have the lowest median family income of $55,000, accounting for 5.5% and 37.1% of families, respectively.
| Number of Earners | # Families | Median Income |
| No Earners | 32 (12.7%) | $65,000 |
| 1 Earner | 94 (37.1%) | $55,000 |
| 2 Earners | 113 (44.7%) | $85,208 |
| 3+ Earners | 14 (5.5%) | $171,250 |
| Total | 253 (100.0%) | $74,293 |
Household Income in Enderlin
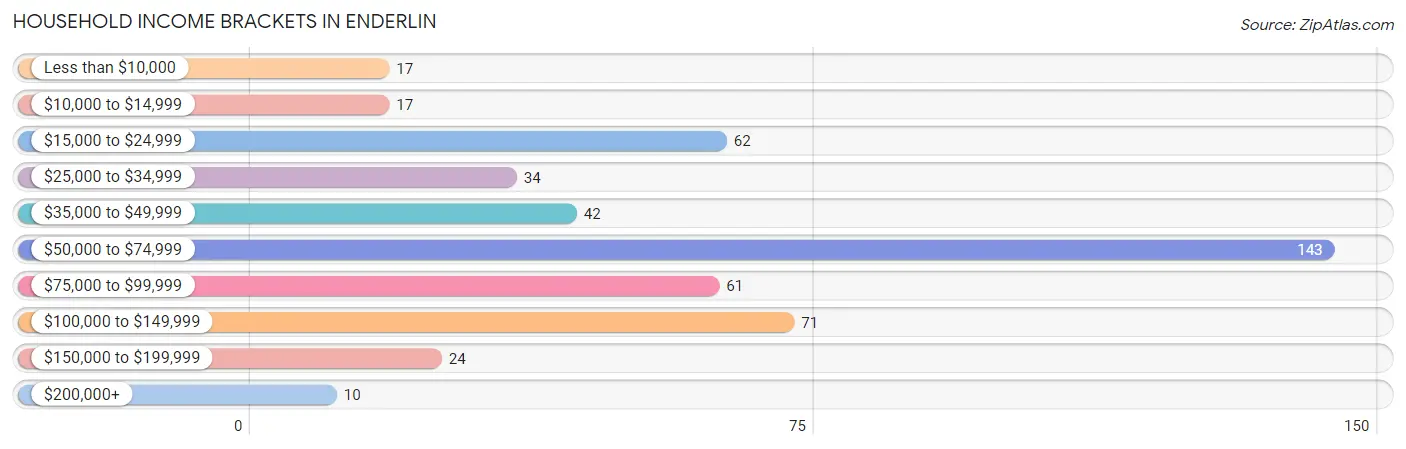
Household Income Brackets in Enderlin
With 143 households falling in the category, the $50,000 to $74,999 income range is the most frequent in Enderlin, accounting for 29.7% of all households. In contrast, only 10 households (2.1%) fall into the $200,000+ income bracket, making it the least populous group.
| Income Bracket | # Households | % Households |
| Less than $10,000 | 17 | 3.5% |
| $10,000 to $14,999 | 17 | 3.5% |
| $15,000 to $24,999 | 62 | 12.9% |
| $25,000 to $34,999 | 34 | 7.1% |
| $35,000 to $49,999 | 42 | 8.7% |
| $50,000 to $74,999 | 143 | 29.7% |
| $75,000 to $99,999 | 61 | 12.7% |
| $100,000 to $149,999 | 71 | 14.8% |
| $150,000 to $199,999 | 24 | 5.0% |
| $200,000+ | 10 | 2.1% |
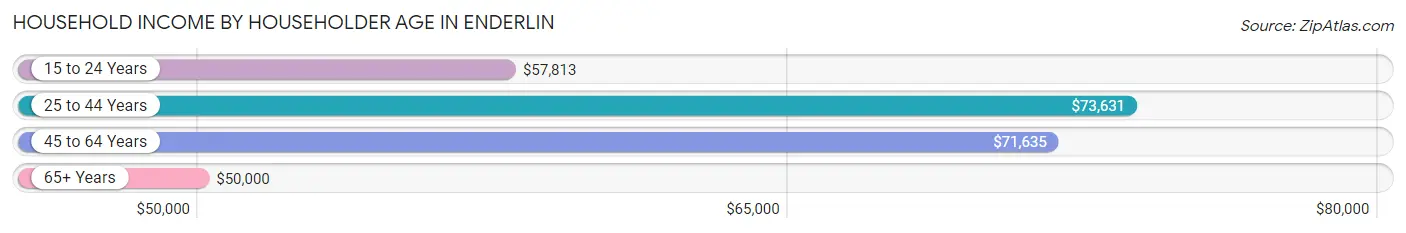
Household Income by Householder Age in Enderlin
The median household income in Enderlin is $58,403, with the highest median household income of $73,631 found in the 25 to 44 years age bracket for the primary householder. A total of 131 households (27.2%) fall into this category. Meanwhile, the 65+ years age bracket for the primary householder has the lowest median household income of $50,000, with 140 households (29.1%) in this group.
| Income Bracket | # Households | Median Income |
| 15 to 24 Years | 65 (13.5%) | $57,813 |
| 25 to 44 Years | 131 (27.2%) | $73,631 |
| 45 to 64 Years | 145 (30.1%) | $71,635 |
| 65+ Years | 140 (29.1%) | $50,000 |
| Total | 481 (100.0%) | $58,403 |
Poverty in Enderlin
Income Below Poverty by Sex and Age in Enderlin
With 3.3% poverty level for males and 15.1% for females among the residents of Enderlin, 15 year old males and 16 and 17 year old females are the most vulnerable to poverty, with 3 males (25.0%) and 6 females (100.0%) in their respective age groups living below the poverty level.
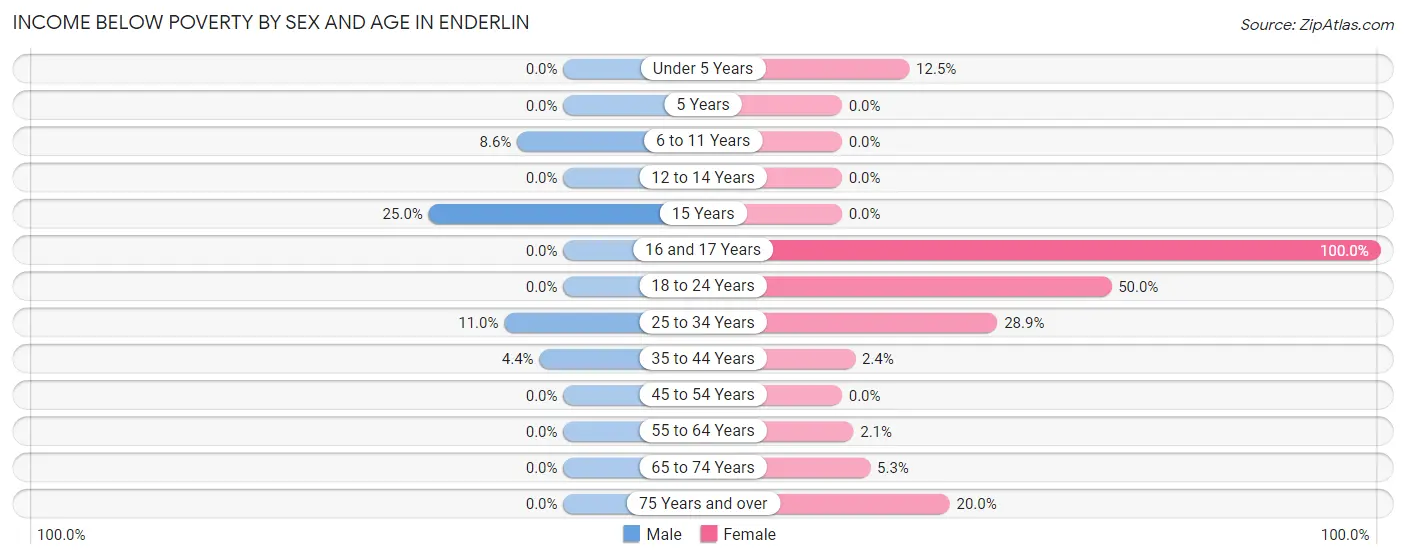
| Age Bracket | Male | Female |
| Under 5 Years | 0 (0.0%) | 7 (12.5%) |
| 5 Years | 0 (0.0%) | 0 (0.0%) |
| 6 to 11 Years | 3 (8.6%) | 0 (0.0%) |
| 12 to 14 Years | 0 (0.0%) | 0 (0.0%) |
| 15 Years | 3 (25.0%) | 0 (0.0%) |
| 16 and 17 Years | 0 (0.0%) | 6 (100.0%) |
| 18 to 24 Years | 0 (0.0%) | 28 (50.0%) |
| 25 to 34 Years | 8 (11.0%) | 15 (28.8%) |
| 35 to 44 Years | 2 (4.4%) | 1 (2.4%) |
| 45 to 54 Years | 0 (0.0%) | 0 (0.0%) |
| 55 to 64 Years | 0 (0.0%) | 2 (2.1%) |
| 65 to 74 Years | 0 (0.0%) | 2 (5.3%) |
| 75 Years and over | 0 (0.0%) | 13 (20.0%) |
| Total | 16 (3.3%) | 74 (15.1%) |
Income Above Poverty by Sex and Age in Enderlin
According to the poverty statistics in Enderlin, males aged under 5 years and females aged 5 years are the age groups that are most secure financially, with 100.0% of males and 100.0% of females in these age groups living above the poverty line.
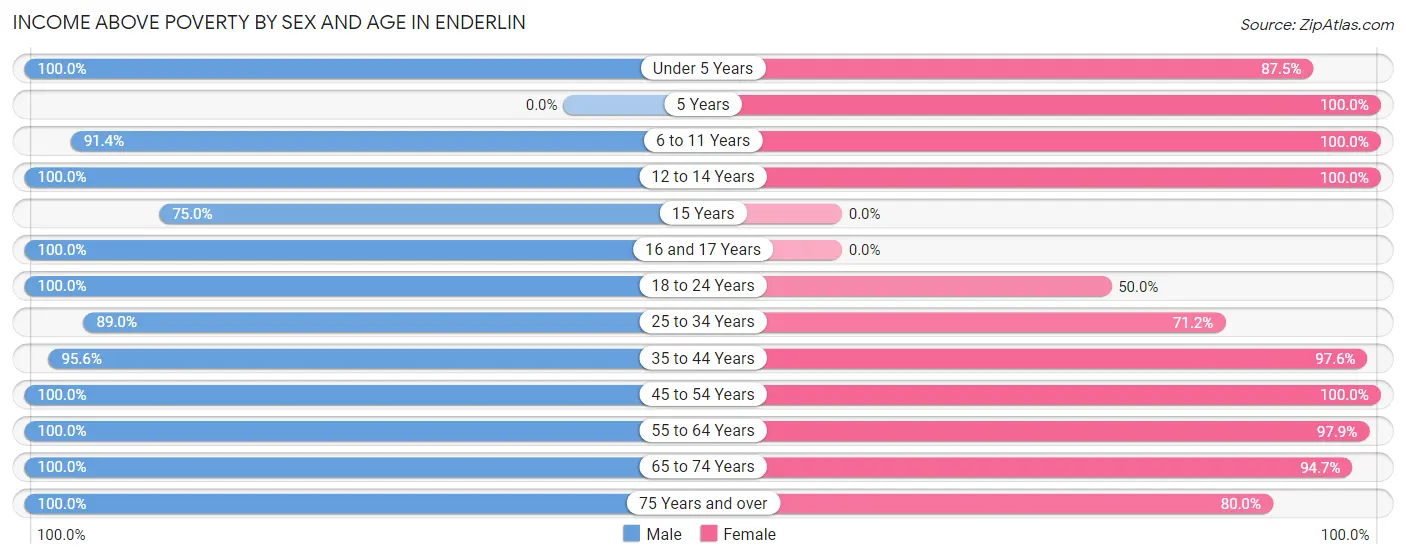
| Age Bracket | Male | Female |
| Under 5 Years | 11 (100.0%) | 49 (87.5%) |
| 5 Years | 0 (0.0%) | 1 (100.0%) |
| 6 to 11 Years | 32 (91.4%) | 27 (100.0%) |
| 12 to 14 Years | 13 (100.0%) | 17 (100.0%) |
| 15 Years | 9 (75.0%) | 0 (0.0%) |
| 16 and 17 Years | 2 (100.0%) | 0 (0.0%) |
| 18 to 24 Years | 69 (100.0%) | 28 (50.0%) |
| 25 to 34 Years | 65 (89.0%) | 37 (71.2%) |
| 35 to 44 Years | 43 (95.6%) | 40 (97.6%) |
| 45 to 54 Years | 32 (100.0%) | 37 (100.0%) |
| 55 to 64 Years | 108 (100.0%) | 92 (97.9%) |
| 65 to 74 Years | 69 (100.0%) | 36 (94.7%) |
| 75 Years and over | 14 (100.0%) | 52 (80.0%) |
| Total | 467 (96.7%) | 416 (84.9%) |
Income Below Poverty Among Married-Couple Families in Enderlin
The poverty statistics for married-couple families in Enderlin show that 1.4% or 3 of the total 208 families live below the poverty line. Families with 1 or 2 children have the highest poverty rate of 10.0%, comprising of 3 families. On the other hand, families with no children have the lowest poverty rate of 0.0%, which includes 0 families.
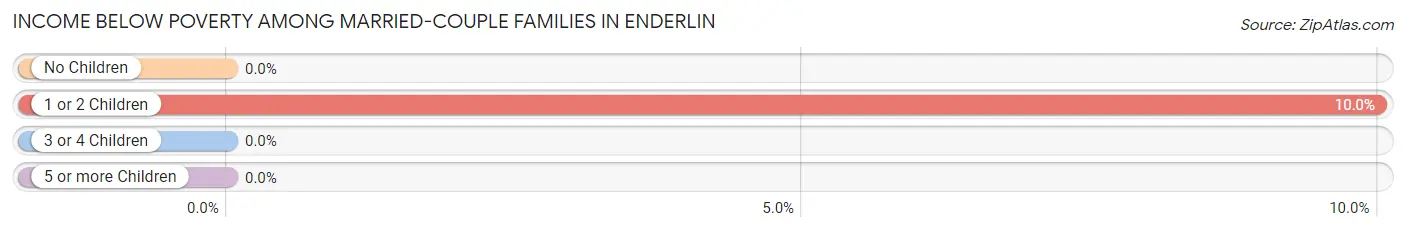
| Children | Above Poverty | Below Poverty |
| No Children | 142 (100.0%) | 0 (0.0%) |
| 1 or 2 Children | 27 (90.0%) | 3 (10.0%) |
| 3 or 4 Children | 36 (100.0%) | 0 (0.0%) |
| 5 or more Children | 0 (0.0%) | 0 (0.0%) |
| Total | 205 (98.6%) | 3 (1.4%) |
Income Below Poverty Among Single-Parent Households in Enderlin
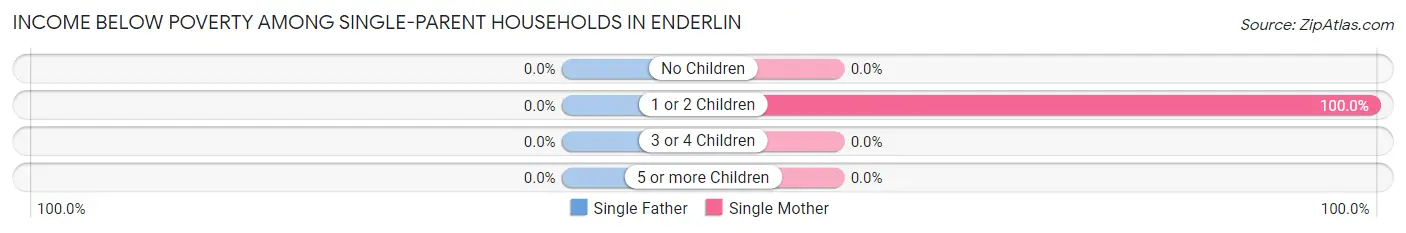
| Children | Single Father | Single Mother |
| No Children | 0 (0.0%) | 0 (0.0%) |
| 1 or 2 Children | 0 (0.0%) | 13 (100.0%) |
| 3 or 4 Children | 0 (0.0%) | 0 (0.0%) |
| 5 or more Children | 0 (0.0%) | 0 (0.0%) |
| Total | 0 (0.0%) | 13 (31.7%) |
Income Below Poverty Among Married-Couple vs Single-Parent Households in Enderlin
The poverty data for Enderlin shows that 3 of the married-couple family households (1.4%) and 13 of the single-parent households (28.9%) are living below the poverty level. Within the married-couple family households, those with 1 or 2 children have the highest poverty rate, with 3 households (10.0%) falling below the poverty line. Among the single-parent households, those with 1 or 2 children have the highest poverty rate, with 13 household (76.5%) living below poverty.
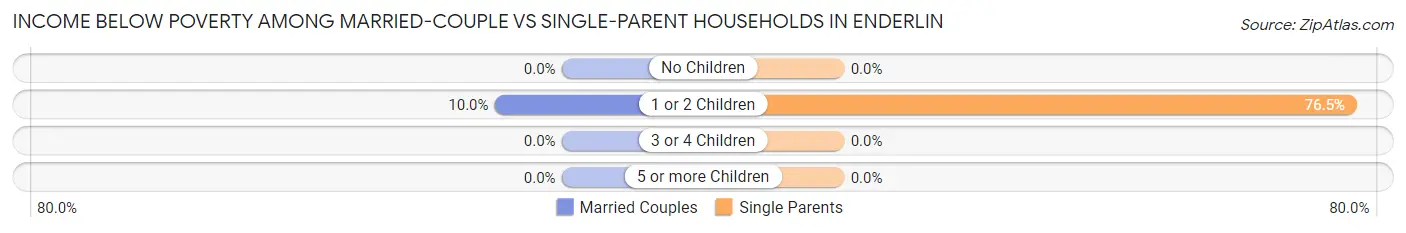
| Children | Married-Couple Families | Single-Parent Households |
| No Children | 0 (0.0%) | 0 (0.0%) |
| 1 or 2 Children | 3 (10.0%) | 13 (76.5%) |
| 3 or 4 Children | 0 (0.0%) | 0 (0.0%) |
| 5 or more Children | 0 (0.0%) | 0 (0.0%) |
| Total | 3 (1.4%) | 13 (28.9%) |
Employment Characteristics in Enderlin
Employment by Class of Employer in Enderlin
Among the 478 employed individuals in Enderlin, private company employees (317 | 66.3%), local government employees (63 | 13.2%), and not-for-profit organizations (41 | 8.6%) make up the most common classes of employment.
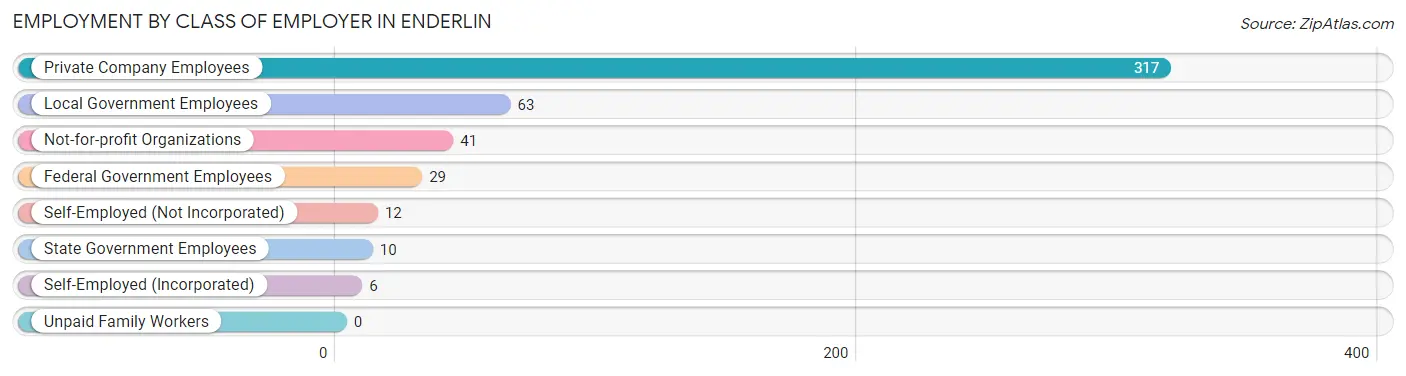
| Employer Class | # Employees | % Employees |
| Private Company Employees | 317 | 66.3% |
| Self-Employed (Incorporated) | 6 | 1.3% |
| Self-Employed (Not Incorporated) | 12 | 2.5% |
| Not-for-profit Organizations | 41 | 8.6% |
| Local Government Employees | 63 | 13.2% |
| State Government Employees | 10 | 2.1% |
| Federal Government Employees | 29 | 6.1% |
| Unpaid Family Workers | 0 | 0.0% |
| Total | 478 | 100.0% |
Employment Status by Age in Enderlin
According to the labor force statistics for Enderlin, out of the total population over 16 years of age (858), 58.4% or 501 individuals are in the labor force, with 4.4% or 22 of them unemployed. The age group with the highest labor force participation rate is 35 to 44 years, with 97.7% or 84 individuals in the labor force. Within the labor force, the 20 to 24 years age range has the highest percentage of unemployed individuals, with 14.1% or 16 of them being unemployed.
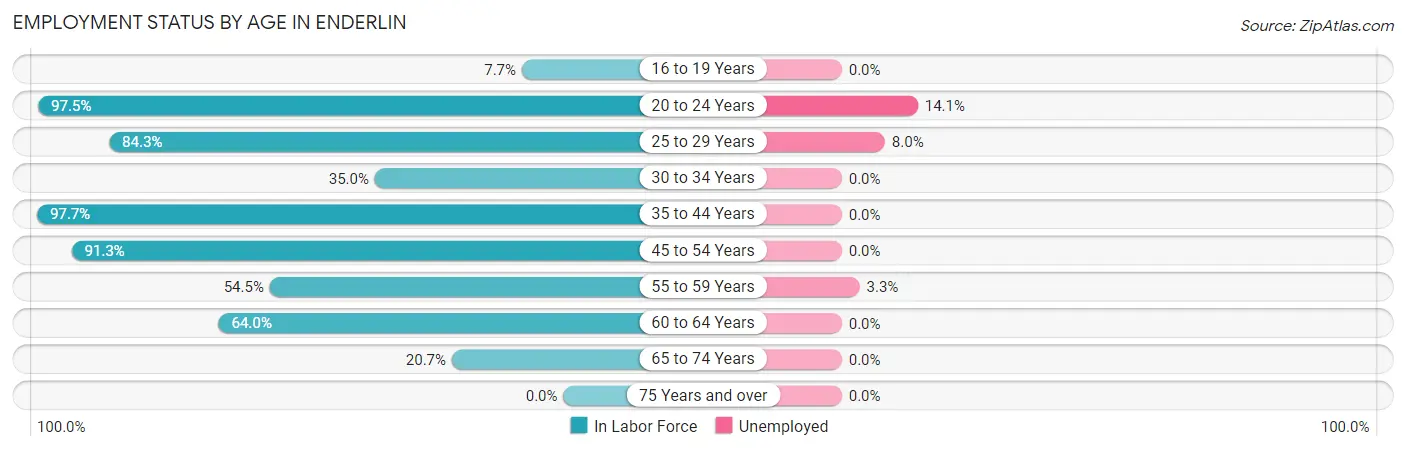
| Age Bracket | In Labor Force | Unemployed |
| 16 to 19 Years | 1 (7.7%) | 0 (0.0%) |
| 20 to 24 Years | 117 (97.5%) | 16 (14.1%) |
| 25 to 29 Years | 75 (84.3%) | 6 (8.0%) |
| 30 to 34 Years | 14 (35.0%) | 0 (0.0%) |
| 35 to 44 Years | 84 (97.7%) | 0 (0.0%) |
| 45 to 54 Years | 63 (91.3%) | 0 (0.0%) |
| 55 to 59 Years | 60 (54.5%) | 2 (3.3%) |
| 60 to 64 Years | 64 (64.0%) | 0 (0.0%) |
| 65 to 74 Years | 23 (20.7%) | 0 (0.0%) |
| 75 Years and over | 0 (0.0%) | 0 (0.0%) |
| Total | 501 (58.4%) | 22 (4.4%) |
Employment Status by Educational Attainment in Enderlin
According to labor force statistics for Enderlin, 72.9% of individuals (360) out of the total population between 25 and 64 years of age (494) are in the labor force, with 2.2% or 8 of them being unemployed. The group with the highest labor force participation rate are those with the educational attainment of less than high school, with 92.9% or 26 individuals in the labor force. Within the labor force, individuals with high school diploma education have the highest percentage of unemployment, with 6.5% or 8 of them being unemployed.
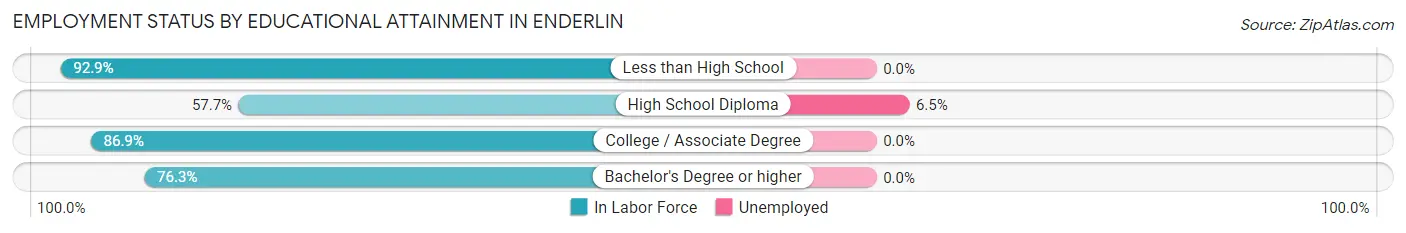
| Educational Attainment | In Labor Force | Unemployed |
| Less than High School | 26 (92.9%) | 0 (0.0%) |
| High School Diploma | 124 (57.7%) | 14 (6.5%) |
| College / Associate Degree | 152 (86.9%) | 0 (0.0%) |
| Bachelor's Degree or higher | 58 (76.3%) | 0 (0.0%) |
| Total | 360 (72.9%) | 11 (2.2%) |
Employment Occupations by Sex in Enderlin
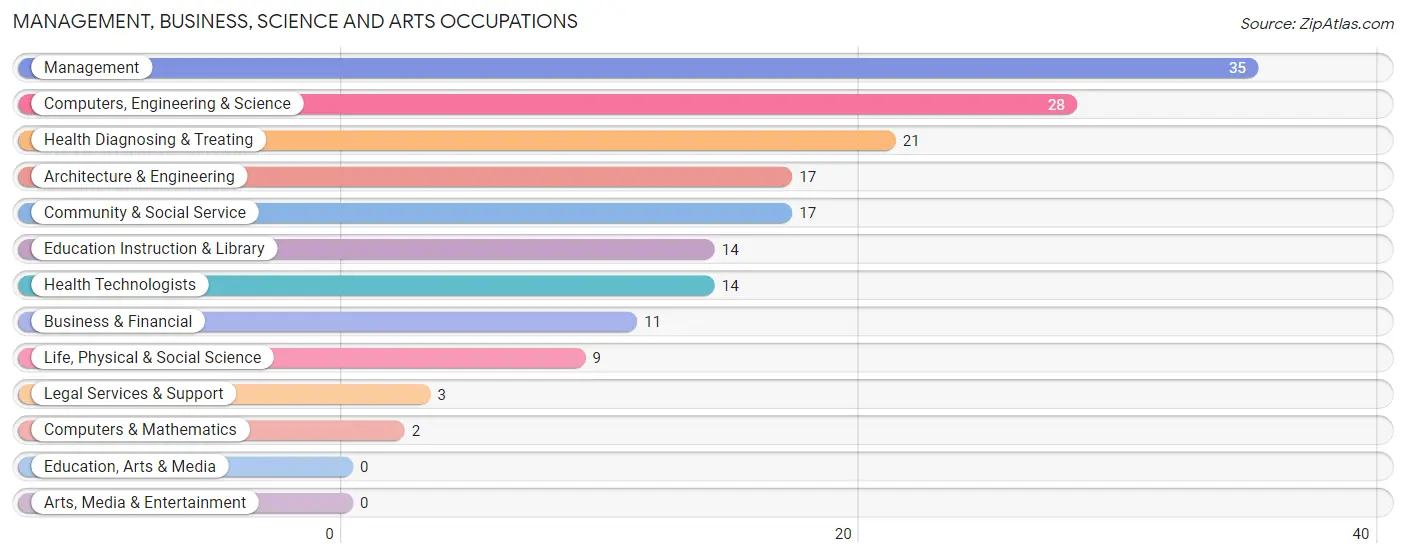
Management, Business, Science and Arts Occupations
The most common Management, Business, Science and Arts occupations in Enderlin are Management (35 | 7.7%), Computers, Engineering & Science (28 | 6.1%), Health Diagnosing & Treating (21 | 4.6%), Architecture & Engineering (17 | 3.7%), and Community & Social Service (17 | 3.7%).
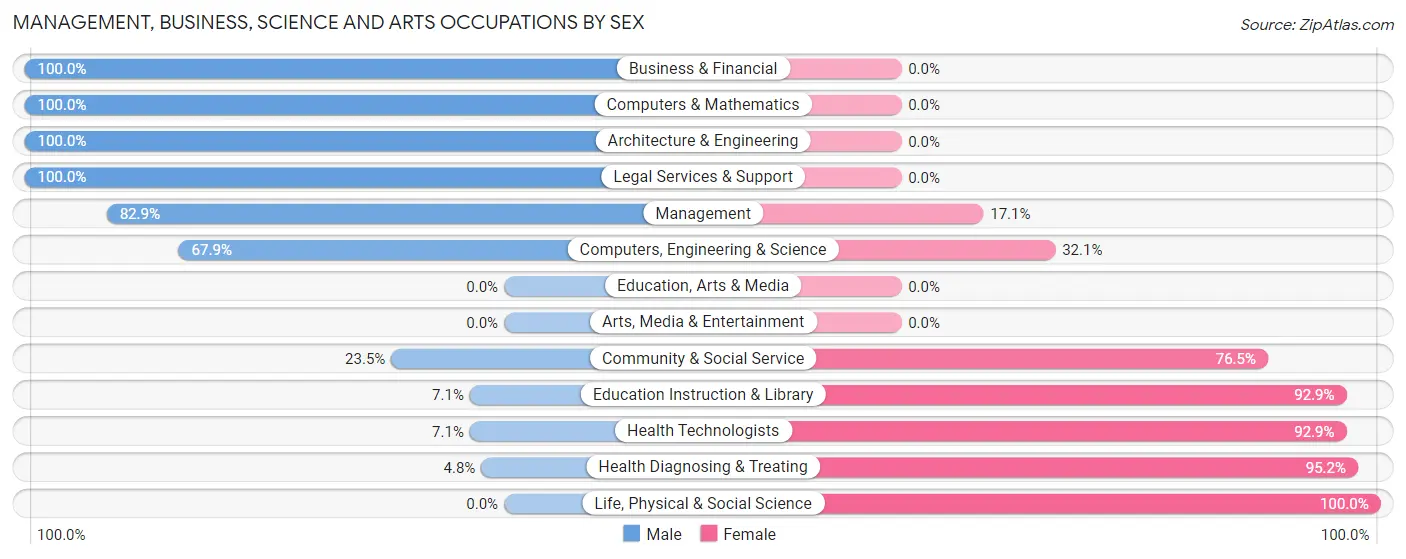
Management, Business, Science and Arts Occupations by Sex
Within the Management, Business, Science and Arts occupations in Enderlin, the most male-oriented occupations are Business & Financial (100.0%), Computers & Mathematics (100.0%), and Architecture & Engineering (100.0%), while the most female-oriented occupations are Life, Physical & Social Science (100.0%), Health Diagnosing & Treating (95.2%), and Education Instruction & Library (92.9%).
| Occupation | Male | Female |
| Management | 29 (82.9%) | 6 (17.1%) |
| Business & Financial | 11 (100.0%) | 0 (0.0%) |
| Computers, Engineering & Science | 19 (67.9%) | 9 (32.1%) |
| Computers & Mathematics | 2 (100.0%) | 0 (0.0%) |
| Architecture & Engineering | 17 (100.0%) | 0 (0.0%) |
| Life, Physical & Social Science | 0 (0.0%) | 9 (100.0%) |
| Community & Social Service | 4 (23.5%) | 13 (76.5%) |
| Education, Arts & Media | 0 (0.0%) | 0 (0.0%) |
| Legal Services & Support | 3 (100.0%) | 0 (0.0%) |
| Education Instruction & Library | 1 (7.1%) | 13 (92.9%) |
| Arts, Media & Entertainment | 0 (0.0%) | 0 (0.0%) |
| Health Diagnosing & Treating | 1 (4.8%) | 20 (95.2%) |
| Health Technologists | 1 (7.1%) | 13 (92.9%) |
| Total (Category) | 64 (57.1%) | 48 (42.9%) |
| Total (Overall) | 246 (54.1%) | 209 (45.9%) |
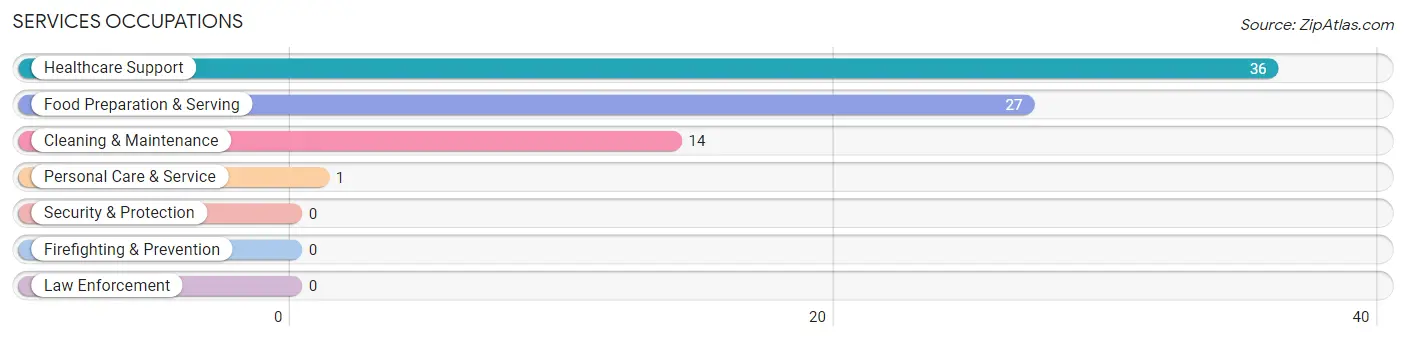
Services Occupations
The most common Services occupations in Enderlin are Healthcare Support (36 | 7.9%), Food Preparation & Serving (27 | 5.9%), Cleaning & Maintenance (14 | 3.1%), and Personal Care & Service (1 | 0.2%).
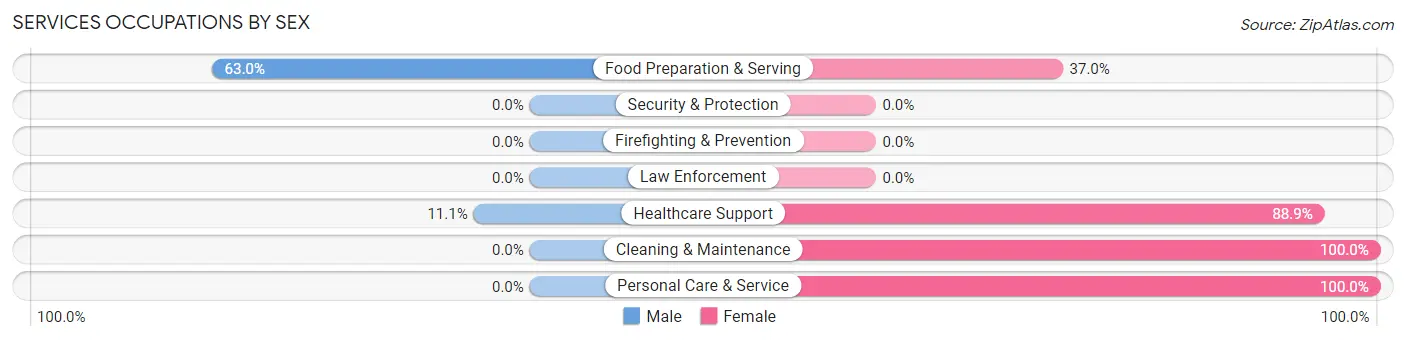
Services Occupations by Sex
Within the Services occupations in Enderlin, the most male-oriented occupations are Food Preparation & Serving (63.0%), and Healthcare Support (11.1%), while the most female-oriented occupations are Cleaning & Maintenance (100.0%), Personal Care & Service (100.0%), and Healthcare Support (88.9%).
| Occupation | Male | Female |
| Healthcare Support | 4 (11.1%) | 32 (88.9%) |
| Security & Protection | 0 (0.0%) | 0 (0.0%) |
| Firefighting & Prevention | 0 (0.0%) | 0 (0.0%) |
| Law Enforcement | 0 (0.0%) | 0 (0.0%) |
| Food Preparation & Serving | 17 (63.0%) | 10 (37.0%) |
| Cleaning & Maintenance | 0 (0.0%) | 14 (100.0%) |
| Personal Care & Service | 0 (0.0%) | 1 (100.0%) |
| Total (Category) | 21 (26.9%) | 57 (73.1%) |
| Total (Overall) | 246 (54.1%) | 209 (45.9%) |
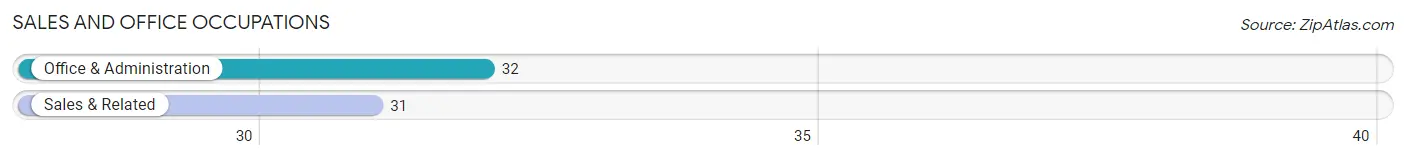
Sales and Office Occupations
The most common Sales and Office occupations in Enderlin are Office & Administration (32 | 7.0%), and Sales & Related (31 | 6.8%).
Sales and Office Occupations by Sex
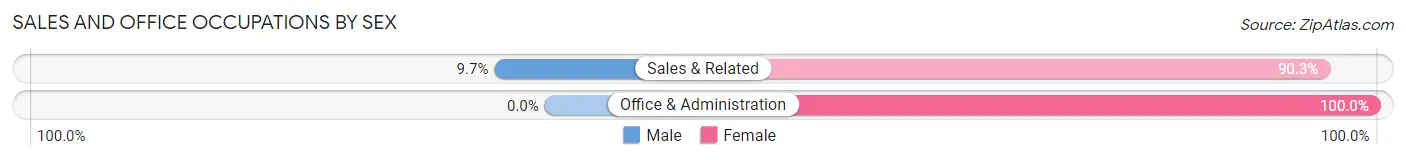
| Occupation | Male | Female |
| Sales & Related | 3 (9.7%) | 28 (90.3%) |
| Office & Administration | 0 (0.0%) | 32 (100.0%) |
| Total (Category) | 3 (4.8%) | 60 (95.2%) |
| Total (Overall) | 246 (54.1%) | 209 (45.9%) |
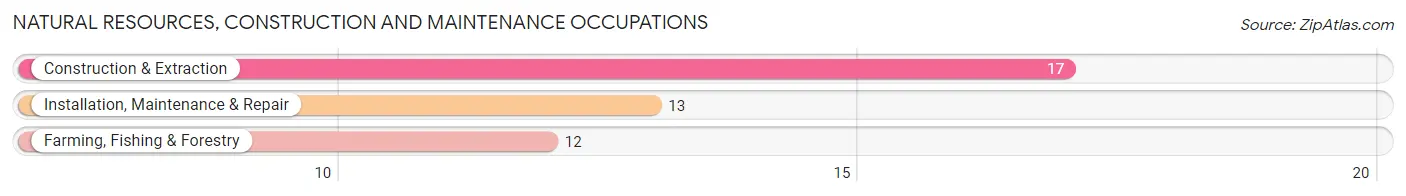
Natural Resources, Construction and Maintenance Occupations
The most common Natural Resources, Construction and Maintenance occupations in Enderlin are Construction & Extraction (17 | 3.7%), Installation, Maintenance & Repair (13 | 2.9%), and Farming, Fishing & Forestry (12 | 2.6%).
Natural Resources, Construction and Maintenance Occupations by Sex
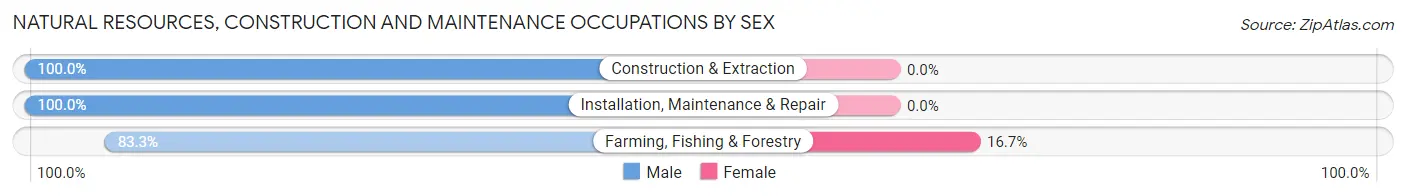
| Occupation | Male | Female |
| Farming, Fishing & Forestry | 10 (83.3%) | 2 (16.7%) |
| Construction & Extraction | 17 (100.0%) | 0 (0.0%) |
| Installation, Maintenance & Repair | 13 (100.0%) | 0 (0.0%) |
| Total (Category) | 40 (95.2%) | 2 (4.8%) |
| Total (Overall) | 246 (54.1%) | 209 (45.9%) |
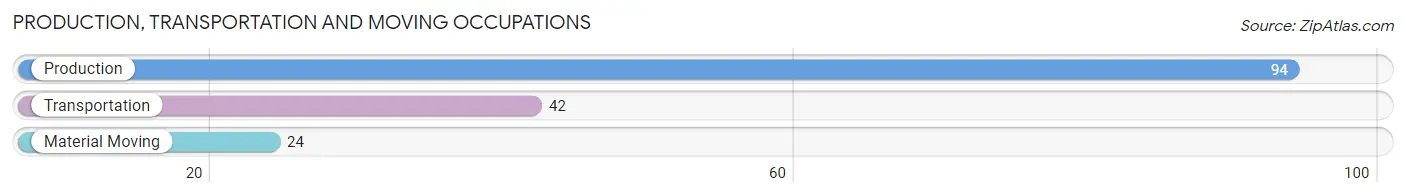
Production, Transportation and Moving Occupations
The most common Production, Transportation and Moving occupations in Enderlin are Production (94 | 20.7%), Transportation (42 | 9.2%), and Material Moving (24 | 5.3%).
Production, Transportation and Moving Occupations by Sex
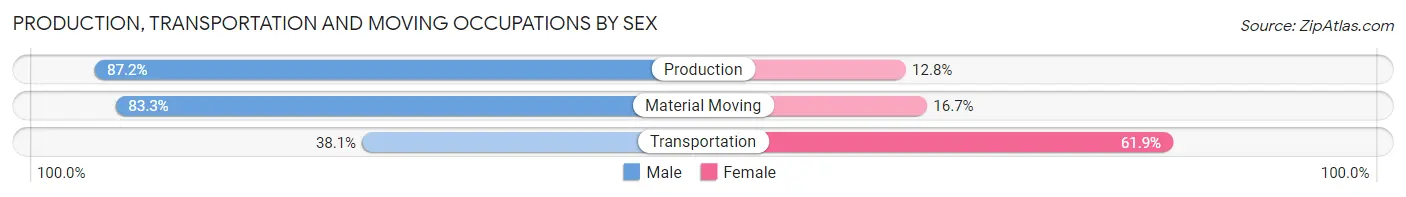
| Occupation | Male | Female |
| Production | 82 (87.2%) | 12 (12.8%) |
| Transportation | 16 (38.1%) | 26 (61.9%) |
| Material Moving | 20 (83.3%) | 4 (16.7%) |
| Total (Category) | 118 (73.8%) | 42 (26.3%) |
| Total (Overall) | 246 (54.1%) | 209 (45.9%) |
Employment Industries by Sex in Enderlin
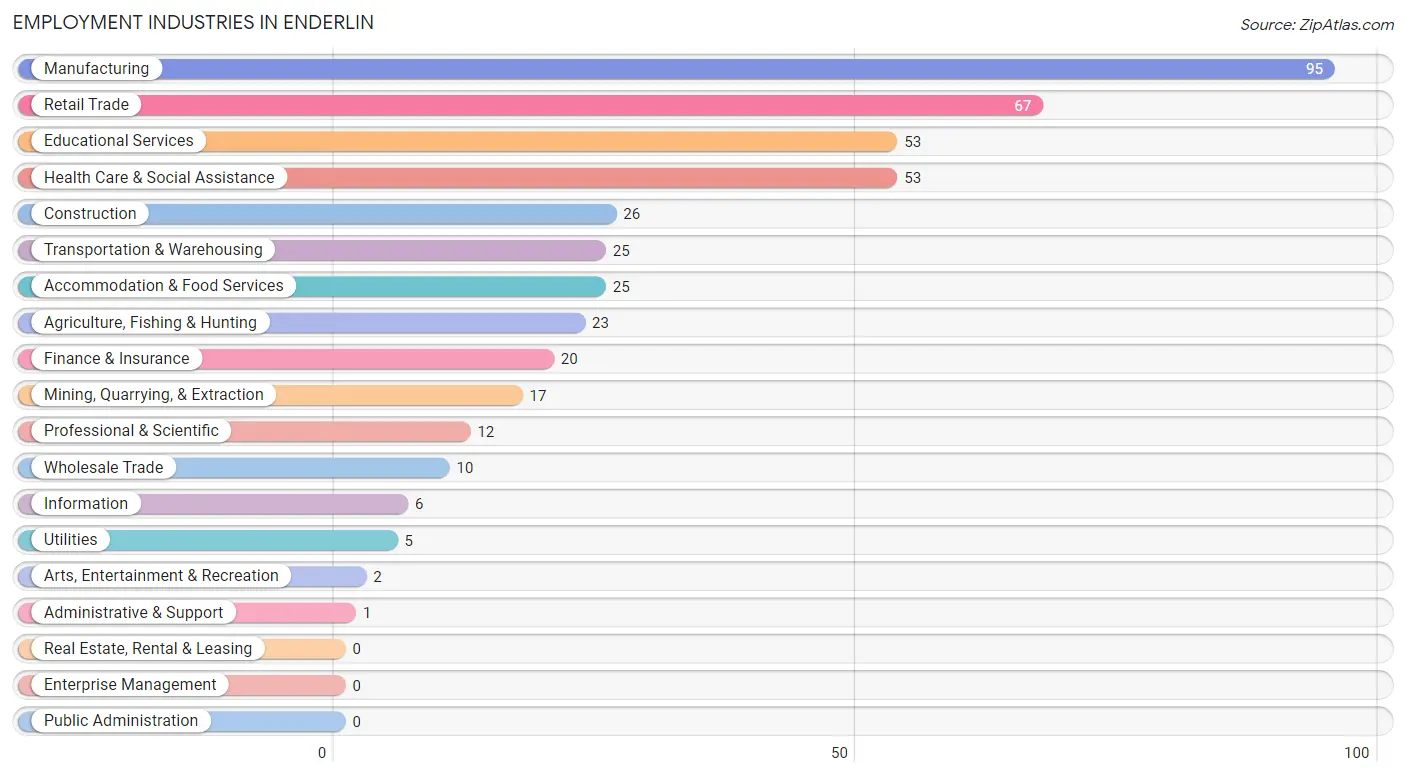
Employment Industries in Enderlin
The major employment industries in Enderlin include Manufacturing (95 | 20.9%), Retail Trade (67 | 14.7%), Educational Services (53 | 11.7%), Health Care & Social Assistance (53 | 11.7%), and Construction (26 | 5.7%).
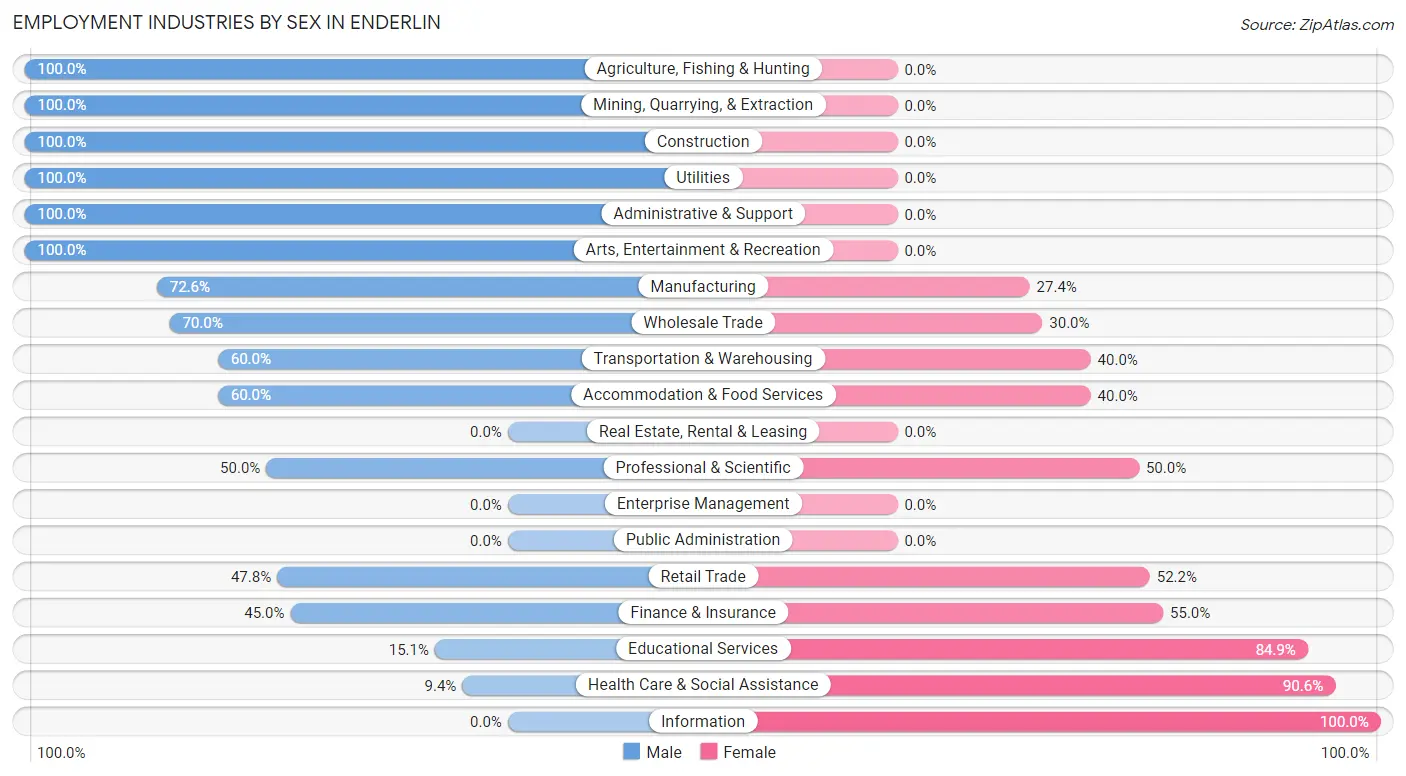
Employment Industries by Sex in Enderlin
The Enderlin industries that see more men than women are Agriculture, Fishing & Hunting (100.0%), Mining, Quarrying, & Extraction (100.0%), and Construction (100.0%), whereas the industries that tend to have a higher number of women are Information (100.0%), Health Care & Social Assistance (90.6%), and Educational Services (84.9%).
| Industry | Male | Female |
| Agriculture, Fishing & Hunting | 23 (100.0%) | 0 (0.0%) |
| Mining, Quarrying, & Extraction | 17 (100.0%) | 0 (0.0%) |
| Construction | 26 (100.0%) | 0 (0.0%) |
| Manufacturing | 69 (72.6%) | 26 (27.4%) |
| Wholesale Trade | 7 (70.0%) | 3 (30.0%) |
| Retail Trade | 32 (47.8%) | 35 (52.2%) |
| Transportation & Warehousing | 15 (60.0%) | 10 (40.0%) |
| Utilities | 5 (100.0%) | 0 (0.0%) |
| Information | 0 (0.0%) | 6 (100.0%) |
| Finance & Insurance | 9 (45.0%) | 11 (55.0%) |
| Real Estate, Rental & Leasing | 0 (0.0%) | 0 (0.0%) |
| Professional & Scientific | 6 (50.0%) | 6 (50.0%) |
| Enterprise Management | 0 (0.0%) | 0 (0.0%) |
| Administrative & Support | 1 (100.0%) | 0 (0.0%) |
| Educational Services | 8 (15.1%) | 45 (84.9%) |
| Health Care & Social Assistance | 5 (9.4%) | 48 (90.6%) |
| Arts, Entertainment & Recreation | 2 (100.0%) | 0 (0.0%) |
| Accommodation & Food Services | 15 (60.0%) | 10 (40.0%) |
| Public Administration | 0 (0.0%) | 0 (0.0%) |
| Total | 246 (54.1%) | 209 (45.9%) |
Education in Enderlin
School Enrollment in Enderlin
The most common levels of schooling among the 189 students in Enderlin are college / undergraduate (64 | 33.9%), middle school (45 | 23.8%), and elementary school (39 | 20.6%).
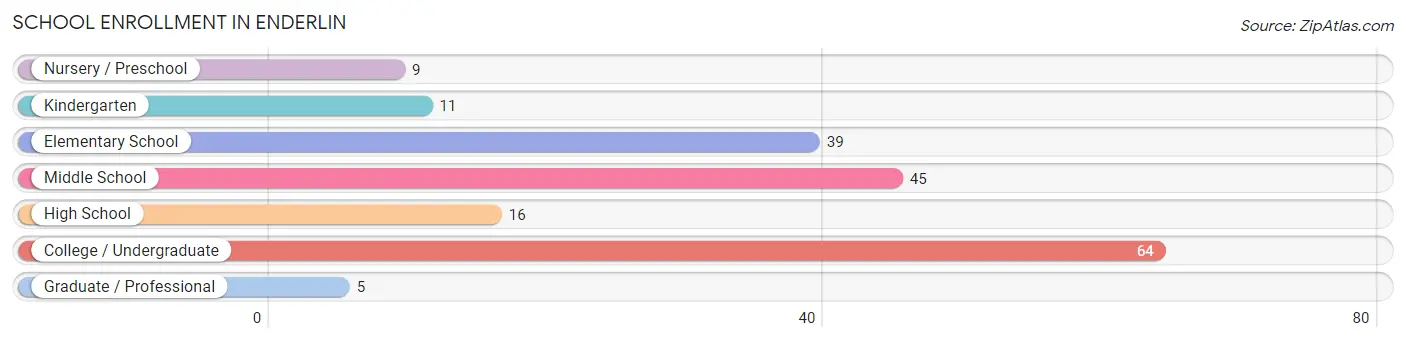
| School Level | # Students | % Students |
| Nursery / Preschool | 9 | 4.8% |
| Kindergarten | 11 | 5.8% |
| Elementary School | 39 | 20.6% |
| Middle School | 45 | 23.8% |
| High School | 16 | 8.5% |
| College / Undergraduate | 64 | 33.9% |
| Graduate / Professional | 5 | 2.6% |
| Total | 189 | 100.0% |
School Enrollment by Age by Funding Source in Enderlin
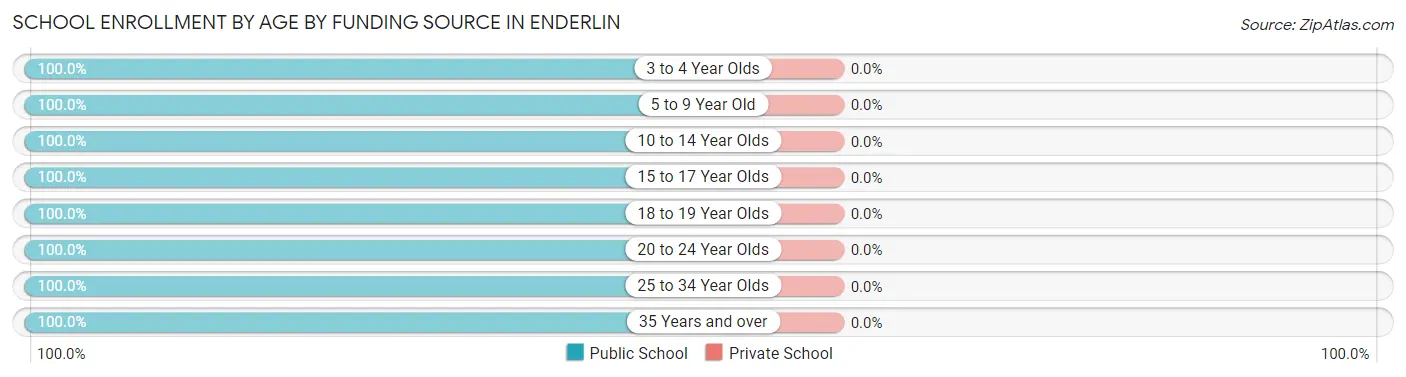
| Age Bracket | Public School | Private School |
| 3 to 4 Year Olds | 9 (100.0%) | 0 (0.0%) |
| 5 to 9 Year Old | 44 (100.0%) | 0 (0.0%) |
| 10 to 14 Year Olds | 43 (100.0%) | 0 (0.0%) |
| 15 to 17 Year Olds | 20 (100.0%) | 0 (0.0%) |
| 18 to 19 Year Olds | 4 (100.0%) | 0 (0.0%) |
| 20 to 24 Year Olds | 50 (100.0%) | 0 (0.0%) |
| 25 to 34 Year Olds | 5 (100.0%) | 0 (0.0%) |
| 35 Years and over | 14 (100.0%) | 0 (0.0%) |
| Total | 189 (100.0%) | 0 (0.0%) |
Educational Attainment by Field of Study in Enderlin
Education (33 | 28.2%), arts & humanities (18 | 15.4%), engineering (15 | 12.8%), science & technology (13 | 11.1%), and liberal arts & history (11 | 9.4%) are the most common fields of study among 117 individuals in Enderlin who have obtained a bachelor's degree or higher.
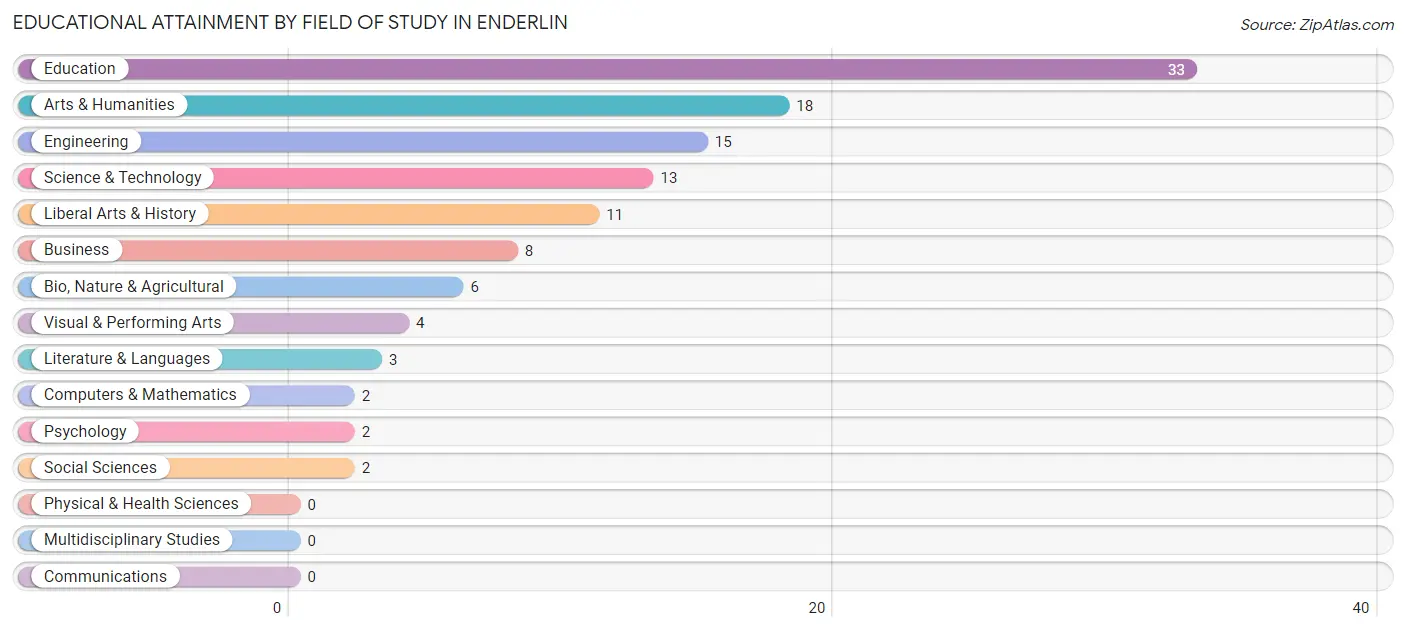
| Field of Study | # Graduates | % Graduates |
| Computers & Mathematics | 2 | 1.7% |
| Bio, Nature & Agricultural | 6 | 5.1% |
| Physical & Health Sciences | 0 | 0.0% |
| Psychology | 2 | 1.7% |
| Social Sciences | 2 | 1.7% |
| Engineering | 15 | 12.8% |
| Multidisciplinary Studies | 0 | 0.0% |
| Science & Technology | 13 | 11.1% |
| Business | 8 | 6.8% |
| Education | 33 | 28.2% |
| Literature & Languages | 3 | 2.6% |
| Liberal Arts & History | 11 | 9.4% |
| Visual & Performing Arts | 4 | 3.4% |
| Communications | 0 | 0.0% |
| Arts & Humanities | 18 | 15.4% |
| Total | 117 | 100.0% |
Transportation & Commute in Enderlin
Vehicle Availability by Sex in Enderlin
The most prevalent vehicle ownership categories in Enderlin are males with 1 vehicle (99, accounting for 36.5%) and females with 1 vehicle (34, making up 47.8%).
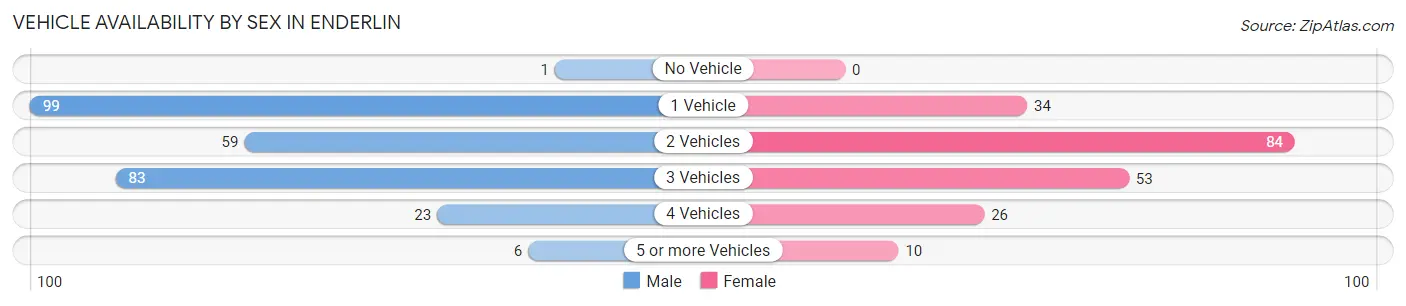
| Vehicles Available | Male | Female |
| No Vehicle | 1 (0.4%) | 0 (0.0%) |
| 1 Vehicle | 99 (36.5%) | 34 (16.4%) |
| 2 Vehicles | 59 (21.8%) | 84 (40.6%) |
| 3 Vehicles | 83 (30.6%) | 53 (25.6%) |
| 4 Vehicles | 23 (8.5%) | 26 (12.6%) |
| 5 or more Vehicles | 6 (2.2%) | 10 (4.8%) |
| Total | 271 (100.0%) | 207 (100.0%) |
Commute Time in Enderlin
The most frequently occuring commute durations in Enderlin are 5 to 9 minutes (191 commuters, 40.0%), less than 5 minutes (111 commuters, 23.3%), and 10 to 14 minutes (40 commuters, 8.4%).
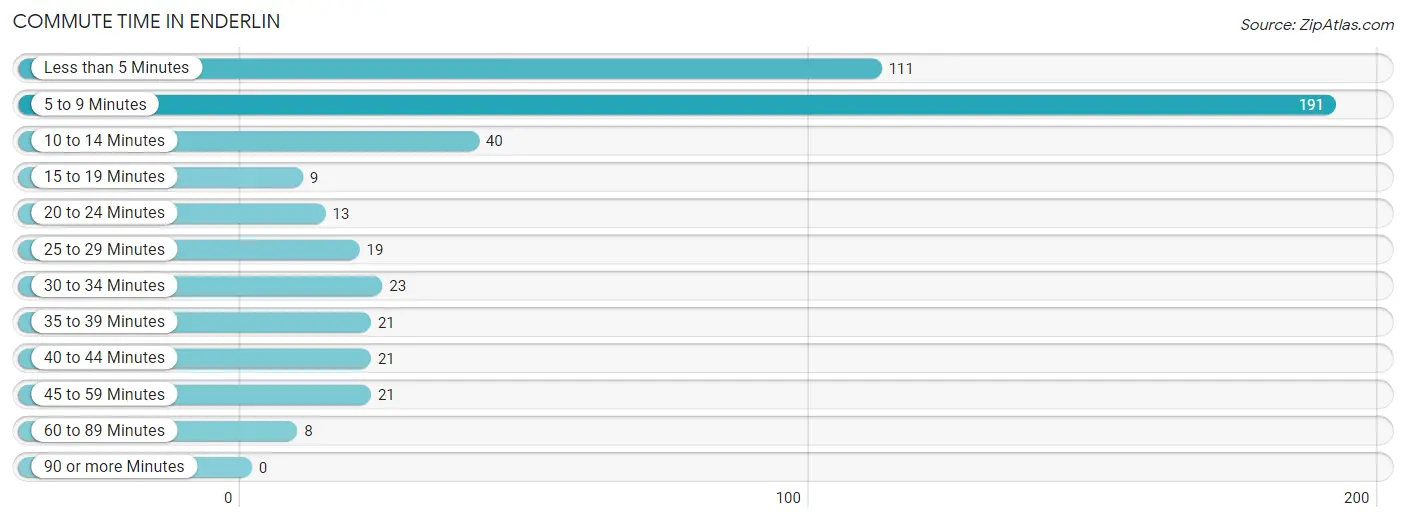
| Commute Time | # Commuters | % Commuters |
| Less than 5 Minutes | 111 | 23.3% |
| 5 to 9 Minutes | 191 | 40.0% |
| 10 to 14 Minutes | 40 | 8.4% |
| 15 to 19 Minutes | 9 | 1.9% |
| 20 to 24 Minutes | 13 | 2.7% |
| 25 to 29 Minutes | 19 | 4.0% |
| 30 to 34 Minutes | 23 | 4.8% |
| 35 to 39 Minutes | 21 | 4.4% |
| 40 to 44 Minutes | 21 | 4.4% |
| 45 to 59 Minutes | 21 | 4.4% |
| 60 to 89 Minutes | 8 | 1.7% |
| 90 or more Minutes | 0 | 0.0% |
Commute Time by Sex in Enderlin
The most common commute times in Enderlin are 5 to 9 minutes (97 commuters, 35.9%) for males and 5 to 9 minutes (94 commuters, 45.4%) for females.
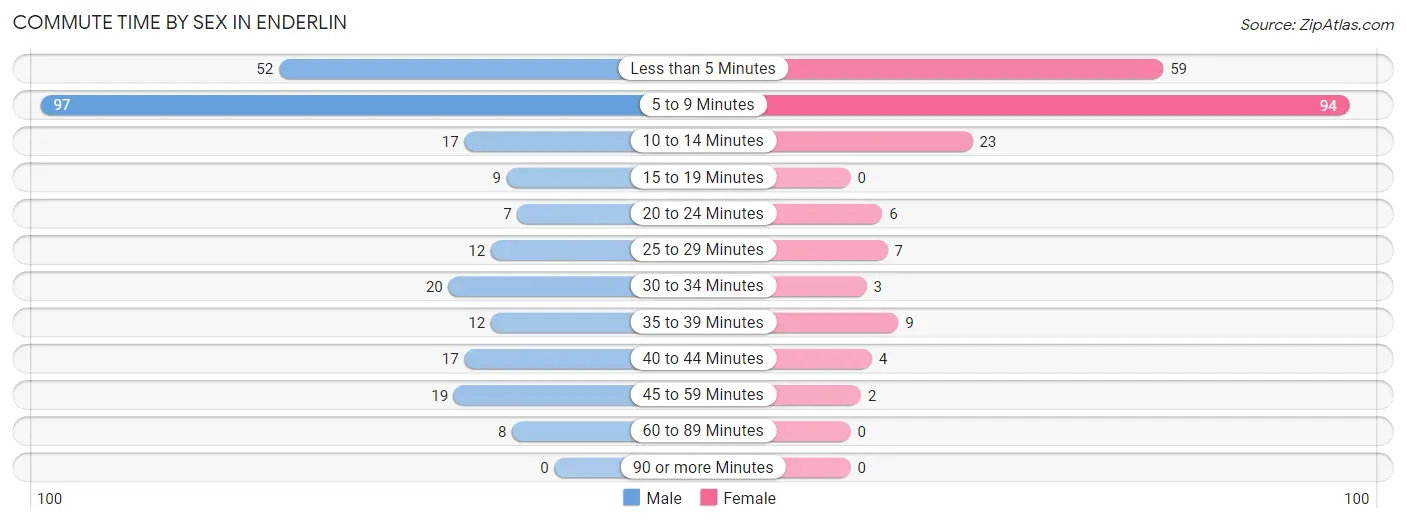
| Commute Time | Male | Female |
| Less than 5 Minutes | 52 (19.3%) | 59 (28.5%) |
| 5 to 9 Minutes | 97 (35.9%) | 94 (45.4%) |
| 10 to 14 Minutes | 17 (6.3%) | 23 (11.1%) |
| 15 to 19 Minutes | 9 (3.3%) | 0 (0.0%) |
| 20 to 24 Minutes | 7 (2.6%) | 6 (2.9%) |
| 25 to 29 Minutes | 12 (4.4%) | 7 (3.4%) |
| 30 to 34 Minutes | 20 (7.4%) | 3 (1.5%) |
| 35 to 39 Minutes | 12 (4.4%) | 9 (4.3%) |
| 40 to 44 Minutes | 17 (6.3%) | 4 (1.9%) |
| 45 to 59 Minutes | 19 (7.0%) | 2 (1.0%) |
| 60 to 89 Minutes | 8 (3.0%) | 0 (0.0%) |
| 90 or more Minutes | 0 (0.0%) | 0 (0.0%) |
Time of Departure to Work by Sex in Enderlin
The most frequent times of departure to work in Enderlin are 6:30 AM to 6:59 AM (43, 15.9%) for males and 6:30 AM to 6:59 AM (57, 27.5%) for females.
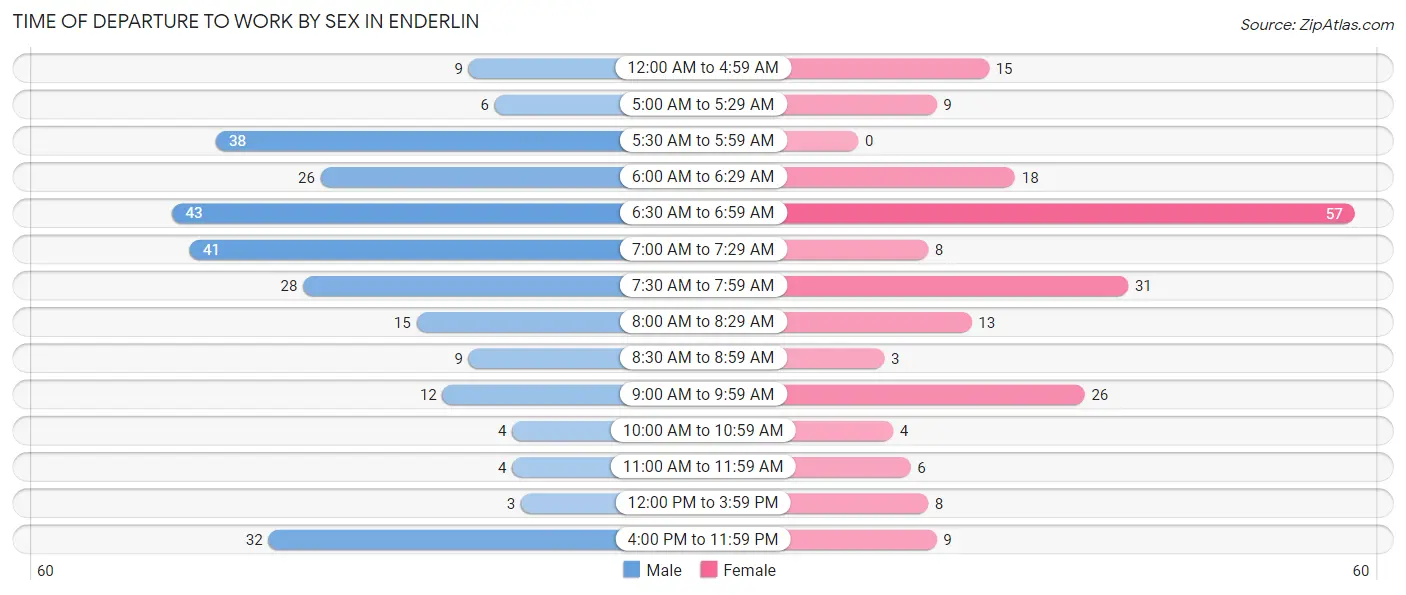
| Time of Departure | Male | Female |
| 12:00 AM to 4:59 AM | 9 (3.3%) | 15 (7.2%) |
| 5:00 AM to 5:29 AM | 6 (2.2%) | 9 (4.3%) |
| 5:30 AM to 5:59 AM | 38 (14.1%) | 0 (0.0%) |
| 6:00 AM to 6:29 AM | 26 (9.6%) | 18 (8.7%) |
| 6:30 AM to 6:59 AM | 43 (15.9%) | 57 (27.5%) |
| 7:00 AM to 7:29 AM | 41 (15.2%) | 8 (3.9%) |
| 7:30 AM to 7:59 AM | 28 (10.4%) | 31 (15.0%) |
| 8:00 AM to 8:29 AM | 15 (5.6%) | 13 (6.3%) |
| 8:30 AM to 8:59 AM | 9 (3.3%) | 3 (1.5%) |
| 9:00 AM to 9:59 AM | 12 (4.4%) | 26 (12.6%) |
| 10:00 AM to 10:59 AM | 4 (1.5%) | 4 (1.9%) |
| 11:00 AM to 11:59 AM | 4 (1.5%) | 6 (2.9%) |
| 12:00 PM to 3:59 PM | 3 (1.1%) | 8 (3.9%) |
| 4:00 PM to 11:59 PM | 32 (11.8%) | 9 (4.3%) |
| Total | 270 (100.0%) | 207 (100.0%) |
Housing Occupancy in Enderlin
Occupancy by Ownership in Enderlin
Of the total 481 dwellings in Enderlin, owner-occupied units account for 347 (72.1%), while renter-occupied units make up 134 (27.9%).
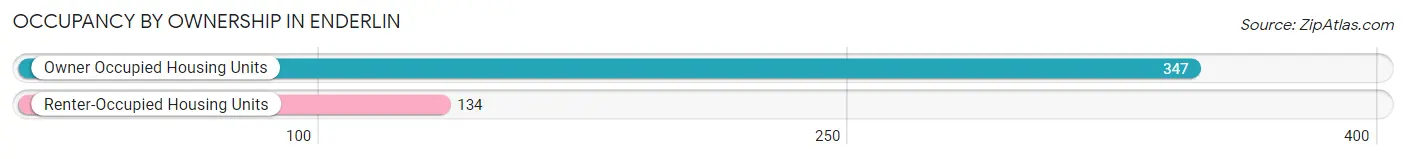
| Occupancy | # Housing Units | % Housing Units |
| Owner Occupied Housing Units | 347 | 72.1% |
| Renter-Occupied Housing Units | 134 | 27.9% |
| Total Occupied Housing Units | 481 | 100.0% |
Occupancy by Household Size in Enderlin
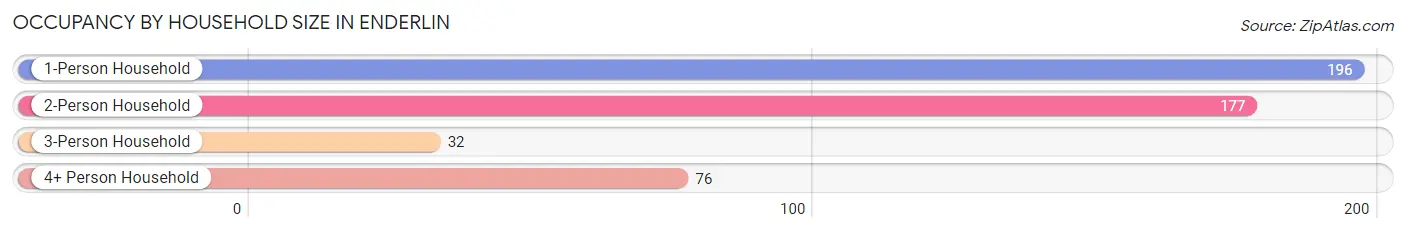
| Household Size | # Housing Units | % Housing Units |
| 1-Person Household | 196 | 40.7% |
| 2-Person Household | 177 | 36.8% |
| 3-Person Household | 32 | 6.7% |
| 4+ Person Household | 76 | 15.8% |
| Total Housing Units | 481 | 100.0% |
Occupancy by Ownership by Household Size in Enderlin
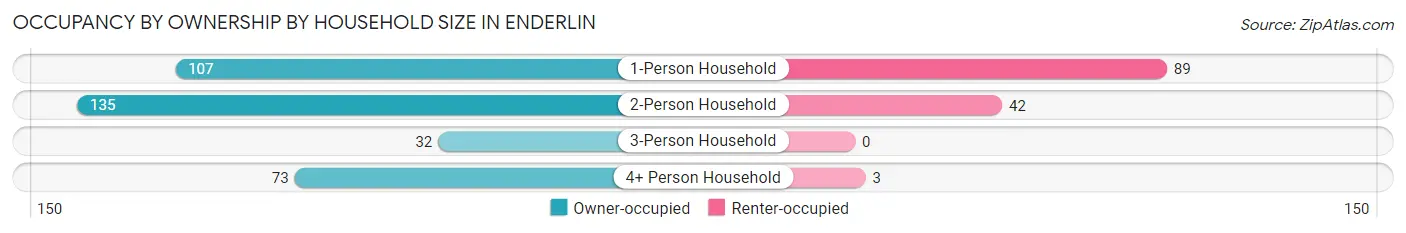
| Household Size | Owner-occupied | Renter-occupied |
| 1-Person Household | 107 (54.6%) | 89 (45.4%) |
| 2-Person Household | 135 (76.3%) | 42 (23.7%) |
| 3-Person Household | 32 (100.0%) | 0 (0.0%) |
| 4+ Person Household | 73 (96.1%) | 3 (4.0%) |
| Total Housing Units | 347 (72.1%) | 134 (27.9%) |
Occupancy by Educational Attainment in Enderlin
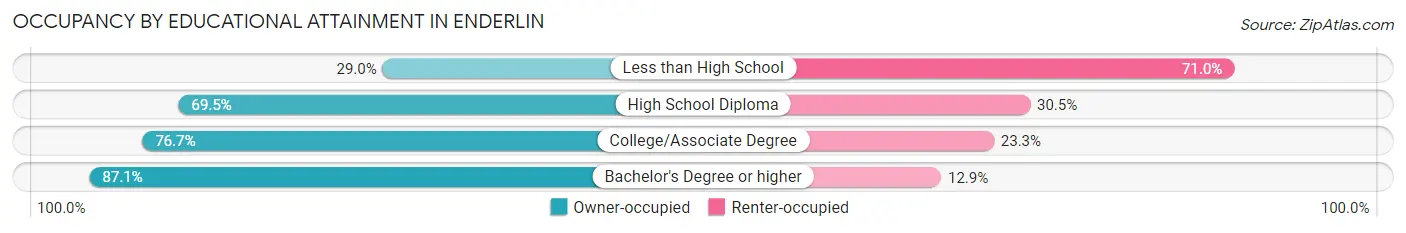
| Household Size | Owner-occupied | Renter-occupied |
| Less than High School | 9 (29.0%) | 22 (71.0%) |
| High School Diploma | 139 (69.5%) | 61 (30.5%) |
| College/Associate Degree | 138 (76.7%) | 42 (23.3%) |
| Bachelor's Degree or higher | 61 (87.1%) | 9 (12.9%) |
Occupancy by Age of Householder in Enderlin
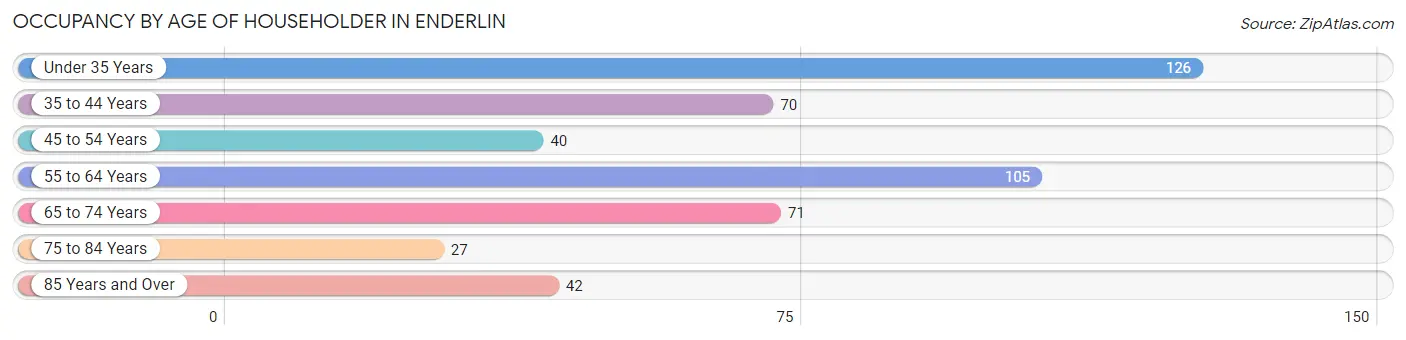
| Age Bracket | # Households | % Households |
| Under 35 Years | 126 | 26.2% |
| 35 to 44 Years | 70 | 14.5% |
| 45 to 54 Years | 40 | 8.3% |
| 55 to 64 Years | 105 | 21.8% |
| 65 to 74 Years | 71 | 14.8% |
| 75 to 84 Years | 27 | 5.6% |
| 85 Years and Over | 42 | 8.7% |
| Total | 481 | 100.0% |
Housing Finances in Enderlin
Median Income by Occupancy in Enderlin
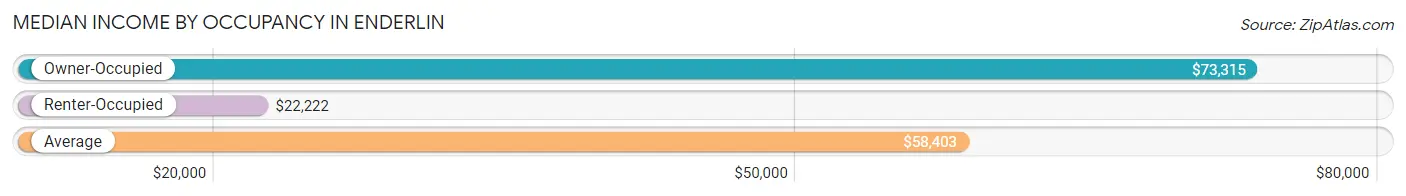
| Occupancy Type | # Households | Median Income |
| Owner-Occupied | 347 (72.1%) | $73,315 |
| Renter-Occupied | 134 (27.9%) | $22,222 |
| Average | 481 (100.0%) | $58,403 |
Occupancy by Householder Income Bracket in Enderlin
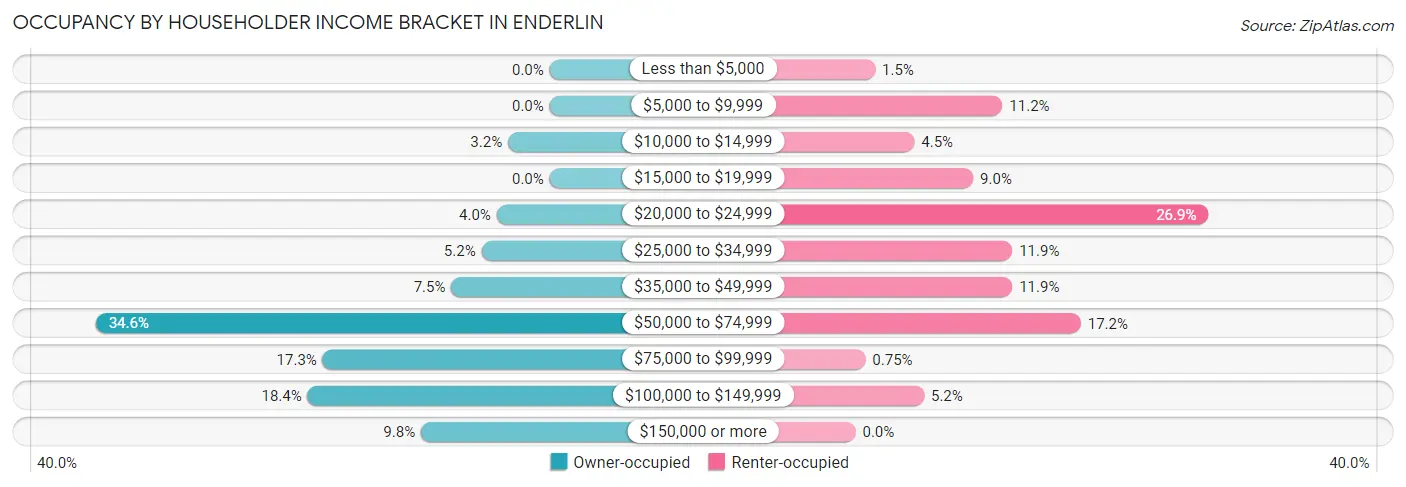
| Income Bracket | Owner-occupied | Renter-occupied |
| Less than $5,000 | 0 (0.0%) | 2 (1.5%) |
| $5,000 to $9,999 | 0 (0.0%) | 15 (11.2%) |
| $10,000 to $14,999 | 11 (3.2%) | 6 (4.5%) |
| $15,000 to $19,999 | 0 (0.0%) | 12 (9.0%) |
| $20,000 to $24,999 | 14 (4.0%) | 36 (26.9%) |
| $25,000 to $34,999 | 18 (5.2%) | 16 (11.9%) |
| $35,000 to $49,999 | 26 (7.5%) | 16 (11.9%) |
| $50,000 to $74,999 | 120 (34.6%) | 23 (17.2%) |
| $75,000 to $99,999 | 60 (17.3%) | 1 (0.7%) |
| $100,000 to $149,999 | 64 (18.4%) | 7 (5.2%) |
| $150,000 or more | 34 (9.8%) | 0 (0.0%) |
| Total | 347 (100.0%) | 134 (100.0%) |
Monthly Housing Cost Tiers in Enderlin
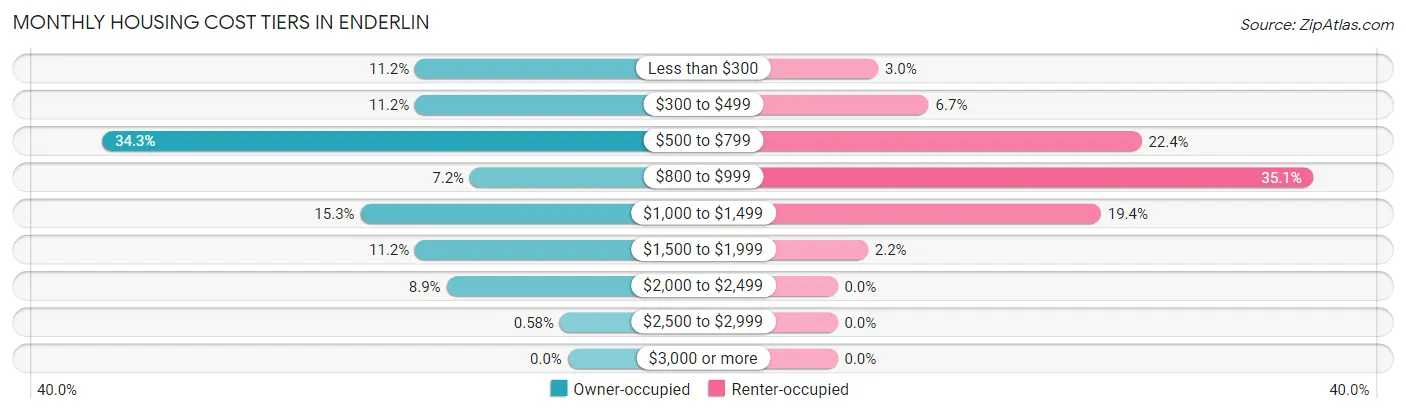
| Monthly Cost | Owner-occupied | Renter-occupied |
| Less than $300 | 39 (11.2%) | 4 (3.0%) |
| $300 to $499 | 39 (11.2%) | 9 (6.7%) |
| $500 to $799 | 119 (34.3%) | 30 (22.4%) |
| $800 to $999 | 25 (7.2%) | 47 (35.1%) |
| $1,000 to $1,499 | 53 (15.3%) | 26 (19.4%) |
| $1,500 to $1,999 | 39 (11.2%) | 3 (2.2%) |
| $2,000 to $2,499 | 31 (8.9%) | 0 (0.0%) |
| $2,500 to $2,999 | 2 (0.6%) | 0 (0.0%) |
| $3,000 or more | 0 (0.0%) | 0 (0.0%) |
| Total | 347 (100.0%) | 134 (100.0%) |
Physical Housing Characteristics in Enderlin
Housing Structures in Enderlin
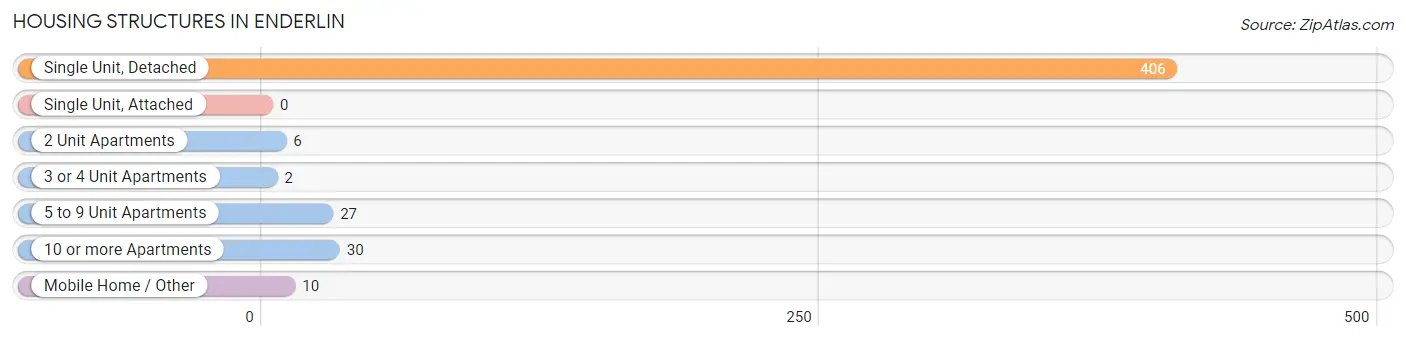
| Structure Type | # Housing Units | % Housing Units |
| Single Unit, Detached | 406 | 84.4% |
| Single Unit, Attached | 0 | 0.0% |
| 2 Unit Apartments | 6 | 1.3% |
| 3 or 4 Unit Apartments | 2 | 0.4% |
| 5 to 9 Unit Apartments | 27 | 5.6% |
| 10 or more Apartments | 30 | 6.2% |
| Mobile Home / Other | 10 | 2.1% |
| Total | 481 | 100.0% |
Housing Structures by Occupancy in Enderlin
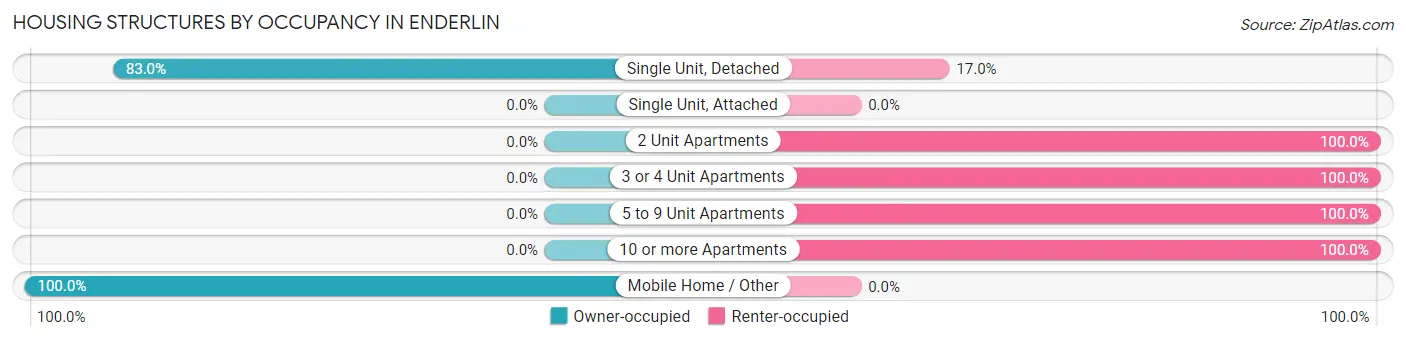
| Structure Type | Owner-occupied | Renter-occupied |
| Single Unit, Detached | 337 (83.0%) | 69 (17.0%) |
| Single Unit, Attached | 0 (0.0%) | 0 (0.0%) |
| 2 Unit Apartments | 0 (0.0%) | 6 (100.0%) |
| 3 or 4 Unit Apartments | 0 (0.0%) | 2 (100.0%) |
| 5 to 9 Unit Apartments | 0 (0.0%) | 27 (100.0%) |
| 10 or more Apartments | 0 (0.0%) | 30 (100.0%) |
| Mobile Home / Other | 10 (100.0%) | 0 (0.0%) |
| Total | 347 (72.1%) | 134 (27.9%) |
Housing Structures by Number of Rooms in Enderlin
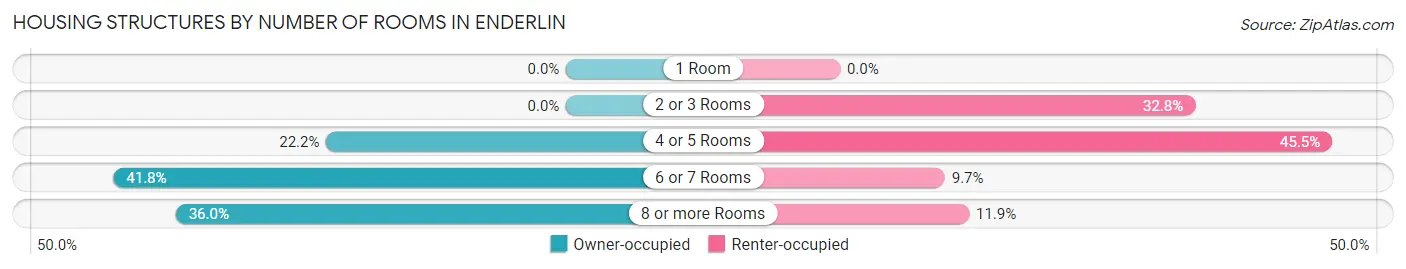
| Number of Rooms | Owner-occupied | Renter-occupied |
| 1 Room | 0 (0.0%) | 0 (0.0%) |
| 2 or 3 Rooms | 0 (0.0%) | 44 (32.8%) |
| 4 or 5 Rooms | 77 (22.2%) | 61 (45.5%) |
| 6 or 7 Rooms | 145 (41.8%) | 13 (9.7%) |
| 8 or more Rooms | 125 (36.0%) | 16 (11.9%) |
| Total | 347 (100.0%) | 134 (100.0%) |
Housing Structure by Heating Type in Enderlin
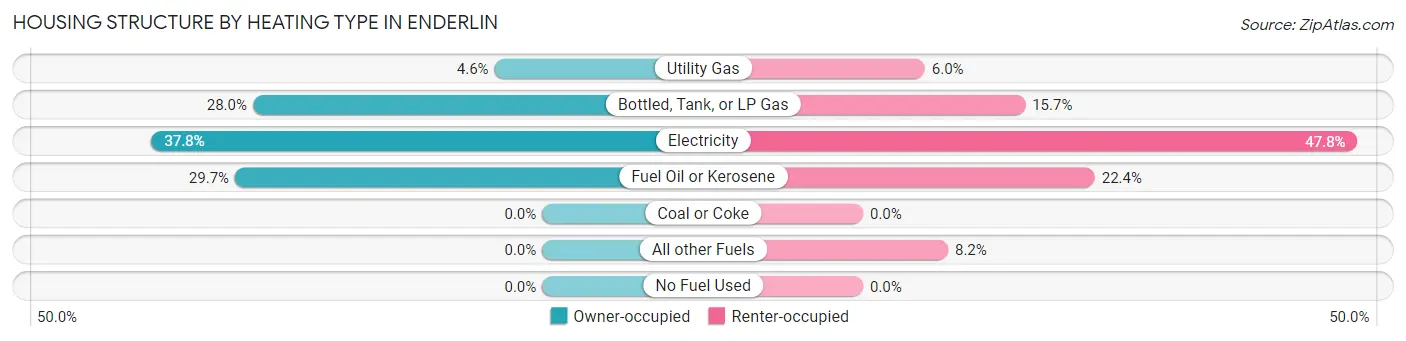
| Heating Type | Owner-occupied | Renter-occupied |
| Utility Gas | 16 (4.6%) | 8 (6.0%) |
| Bottled, Tank, or LP Gas | 97 (28.0%) | 21 (15.7%) |
| Electricity | 131 (37.8%) | 64 (47.8%) |
| Fuel Oil or Kerosene | 103 (29.7%) | 30 (22.4%) |
| Coal or Coke | 0 (0.0%) | 0 (0.0%) |
| All other Fuels | 0 (0.0%) | 11 (8.2%) |
| No Fuel Used | 0 (0.0%) | 0 (0.0%) |
| Total | 347 (100.0%) | 134 (100.0%) |
Household Vehicle Usage in Enderlin
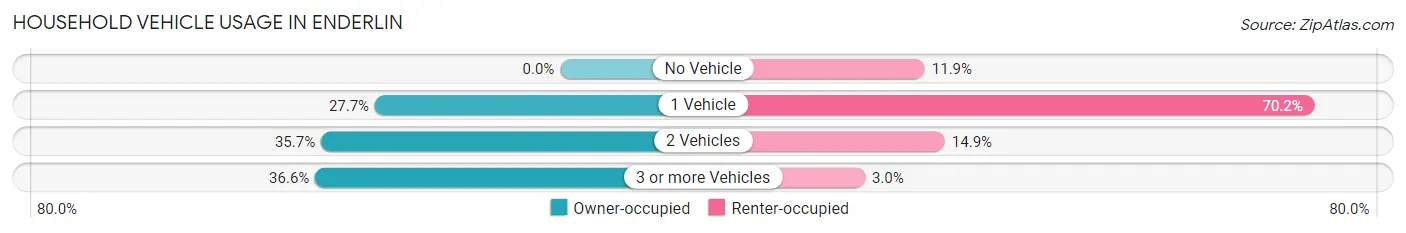
| Vehicles per Household | Owner-occupied | Renter-occupied |
| No Vehicle | 0 (0.0%) | 16 (11.9%) |
| 1 Vehicle | 96 (27.7%) | 94 (70.2%) |
| 2 Vehicles | 124 (35.7%) | 20 (14.9%) |
| 3 or more Vehicles | 127 (36.6%) | 4 (3.0%) |
| Total | 347 (100.0%) | 134 (100.0%) |
Real Estate & Mortgages in Enderlin
Real Estate and Mortgage Overview in Enderlin
| Characteristic | Without Mortgage | With Mortgage |
| Housing Units | 161 | 186 |
| Median Property Value | $94,200 | $122,100 |
| Median Household Income | $63,750 | $14 |
| Monthly Housing Costs | $516 | $0 |
| Real Estate Taxes | $1,482 | $16 |
Property Value by Mortgage Status in Enderlin
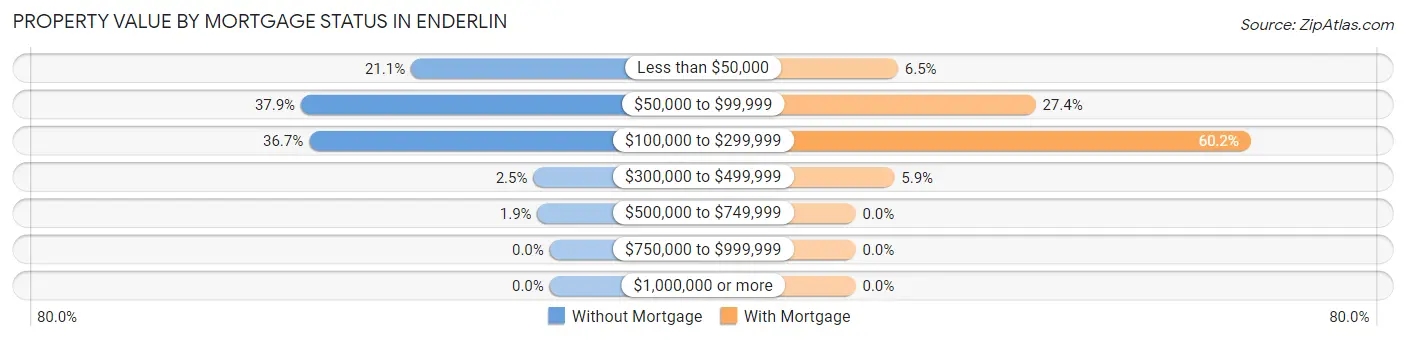
| Property Value | Without Mortgage | With Mortgage |
| Less than $50,000 | 34 (21.1%) | 12 (6.5%) |
| $50,000 to $99,999 | 61 (37.9%) | 51 (27.4%) |
| $100,000 to $299,999 | 59 (36.6%) | 112 (60.2%) |
| $300,000 to $499,999 | 4 (2.5%) | 11 (5.9%) |
| $500,000 to $749,999 | 3 (1.9%) | 0 (0.0%) |
| $750,000 to $999,999 | 0 (0.0%) | 0 (0.0%) |
| $1,000,000 or more | 0 (0.0%) | 0 (0.0%) |
| Total | 161 (100.0%) | 186 (100.0%) |
Household Income by Mortgage Status in Enderlin
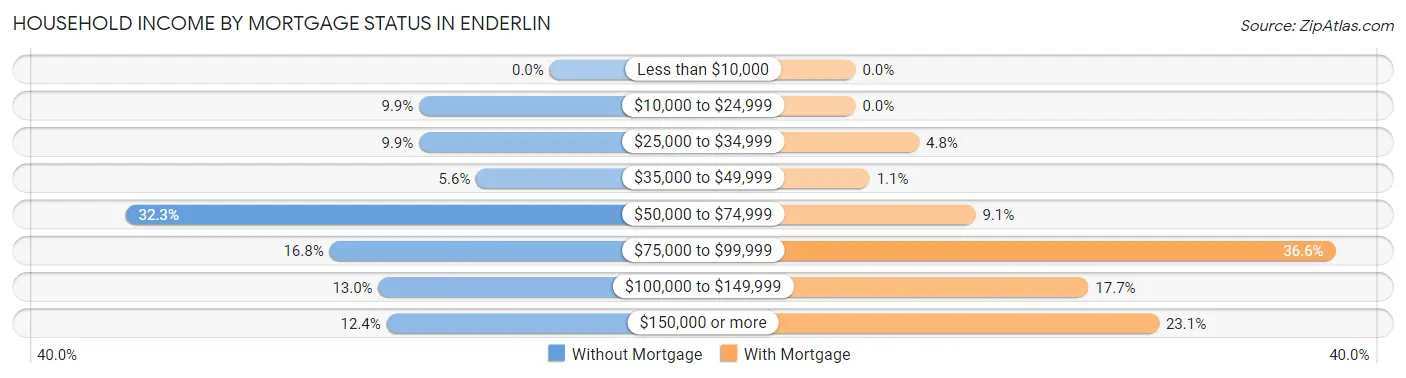
| Household Income | Without Mortgage | With Mortgage |
| Less than $10,000 | 0 (0.0%) | 0 (0.0%) |
| $10,000 to $24,999 | 16 (9.9%) | 0 (0.0%) |
| $25,000 to $34,999 | 16 (9.9%) | 9 (4.8%) |
| $35,000 to $49,999 | 9 (5.6%) | 2 (1.1%) |
| $50,000 to $74,999 | 52 (32.3%) | 17 (9.1%) |
| $75,000 to $99,999 | 27 (16.8%) | 68 (36.6%) |
| $100,000 to $149,999 | 21 (13.0%) | 33 (17.7%) |
| $150,000 or more | 20 (12.4%) | 43 (23.1%) |
| Total | 161 (100.0%) | 186 (100.0%) |
Property Value to Household Income Ratio in Enderlin
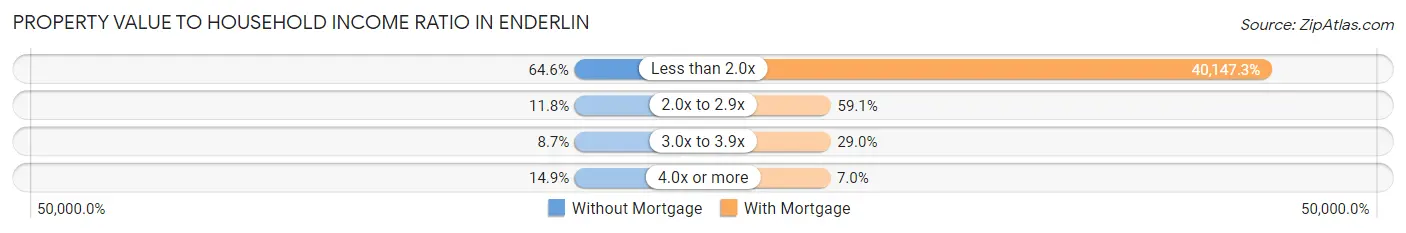
| Value-to-Income Ratio | Without Mortgage | With Mortgage |
| Less than 2.0x | 104 (64.6%) | 74,674 (40,147.3%) |
| 2.0x to 2.9x | 19 (11.8%) | 110 (59.1%) |
| 3.0x to 3.9x | 14 (8.7%) | 54 (29.0%) |
| 4.0x or more | 24 (14.9%) | 13 (7.0%) |
| Total | 161 (100.0%) | 186 (100.0%) |
Real Estate Taxes by Mortgage Status in Enderlin
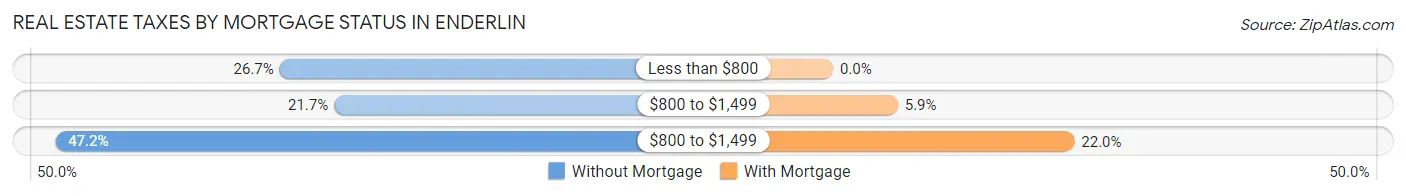
| Property Taxes | Without Mortgage | With Mortgage |
| Less than $800 | 43 (26.7%) | 0 (0.0%) |
| $800 to $1,499 | 35 (21.7%) | 11 (5.9%) |
| $800 to $1,499 | 76 (47.2%) | 41 (22.0%) |
| Total | 161 (100.0%) | 186 (100.0%) |
Health & Disability in Enderlin
Health Insurance Coverage by Age in Enderlin
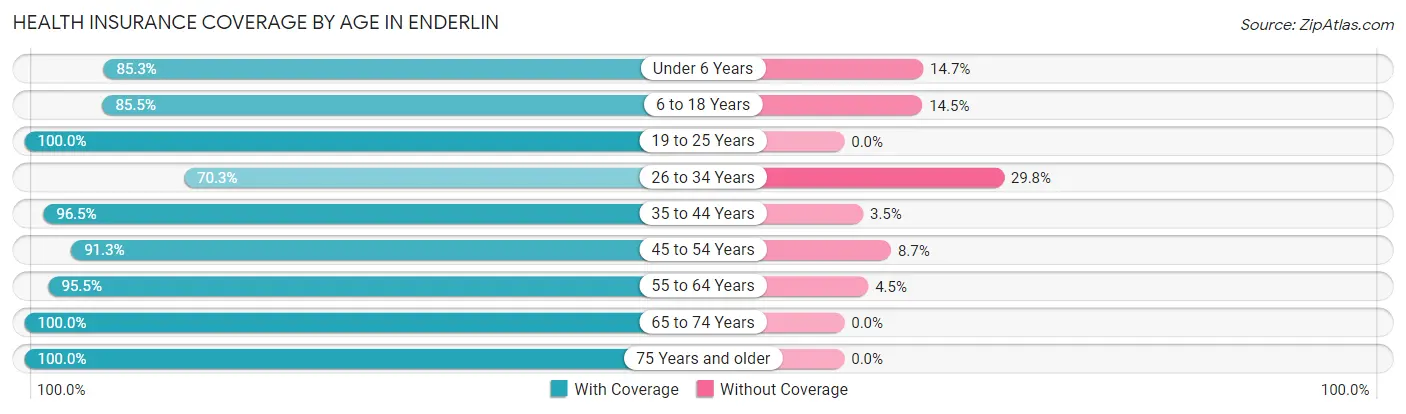
| Age Bracket | With Coverage | Without Coverage |
| Under 6 Years | 58 (85.3%) | 10 (14.7%) |
| 6 to 18 Years | 100 (85.5%) | 17 (14.5%) |
| 19 to 25 Years | 99 (100.0%) | 0 (0.0%) |
| 26 to 34 Years | 85 (70.3%) | 36 (29.7%) |
| 35 to 44 Years | 83 (96.5%) | 3 (3.5%) |
| 45 to 54 Years | 63 (91.3%) | 6 (8.7%) |
| 55 to 64 Years | 193 (95.5%) | 9 (4.5%) |
| 65 to 74 Years | 107 (100.0%) | 0 (0.0%) |
| 75 Years and older | 79 (100.0%) | 0 (0.0%) |
| Total | 867 (91.5%) | 81 (8.5%) |
Health Insurance Coverage by Citizenship Status in Enderlin
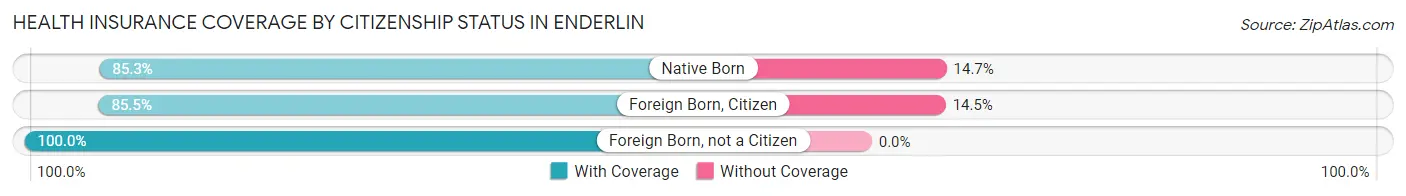
| Citizenship Status | With Coverage | Without Coverage |
| Native Born | 58 (85.3%) | 10 (14.7%) |
| Foreign Born, Citizen | 100 (85.5%) | 17 (14.5%) |
| Foreign Born, not a Citizen | 99 (100.0%) | 0 (0.0%) |
Health Insurance Coverage by Household Income in Enderlin
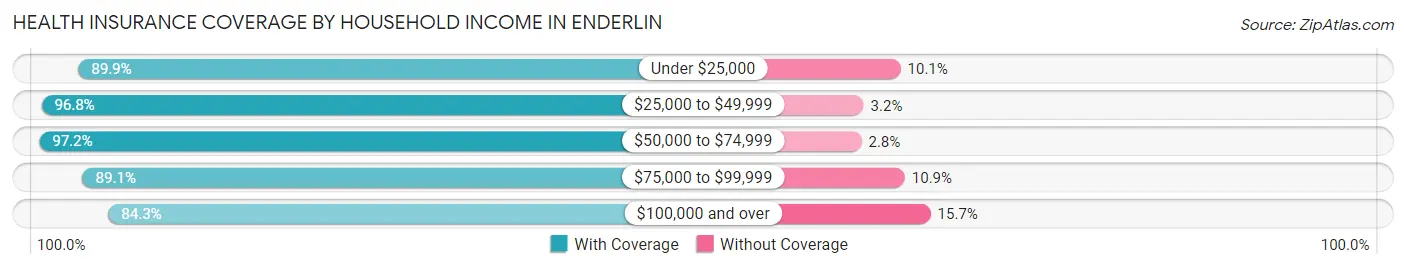
| Household Income | With Coverage | Without Coverage |
| Under $25,000 | 107 (89.9%) | 12 (10.1%) |
| $25,000 to $49,999 | 92 (96.8%) | 3 (3.2%) |
| $50,000 to $74,999 | 317 (97.2%) | 9 (2.8%) |
| $75,000 to $99,999 | 131 (89.1%) | 16 (10.9%) |
| $100,000 and over | 220 (84.3%) | 41 (15.7%) |
Public vs Private Health Insurance Coverage by Age in Enderlin
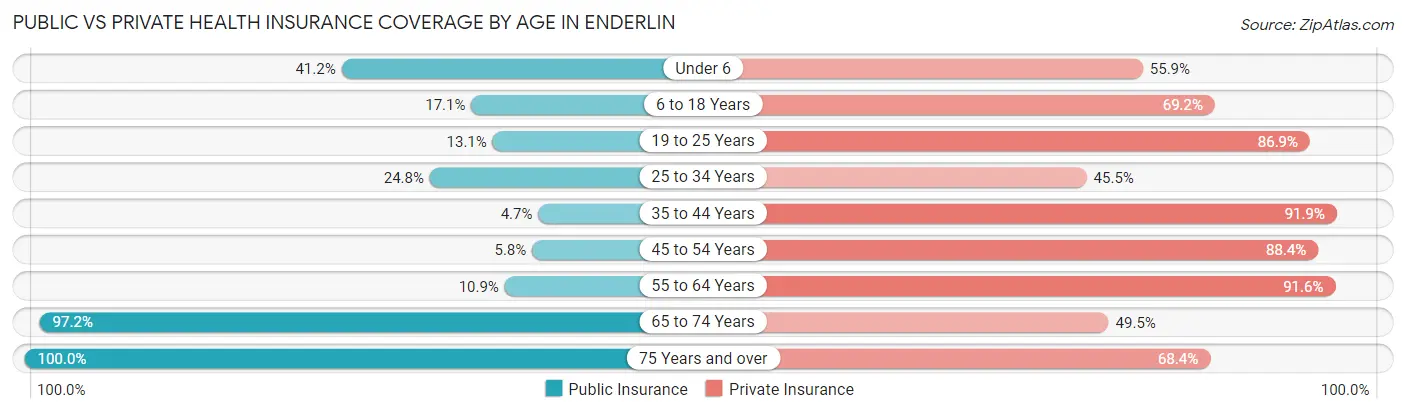
| Age Bracket | Public Insurance | Private Insurance |
| Under 6 | 28 (41.2%) | 38 (55.9%) |
| 6 to 18 Years | 20 (17.1%) | 81 (69.2%) |
| 19 to 25 Years | 13 (13.1%) | 86 (86.9%) |
| 25 to 34 Years | 30 (24.8%) | 55 (45.5%) |
| 35 to 44 Years | 4 (4.6%) | 79 (91.9%) |
| 45 to 54 Years | 4 (5.8%) | 61 (88.4%) |
| 55 to 64 Years | 22 (10.9%) | 185 (91.6%) |
| 65 to 74 Years | 104 (97.2%) | 53 (49.5%) |
| 75 Years and over | 79 (100.0%) | 54 (68.3%) |
| Total | 304 (32.1%) | 692 (73.0%) |
Disability Status by Sex by Age in Enderlin
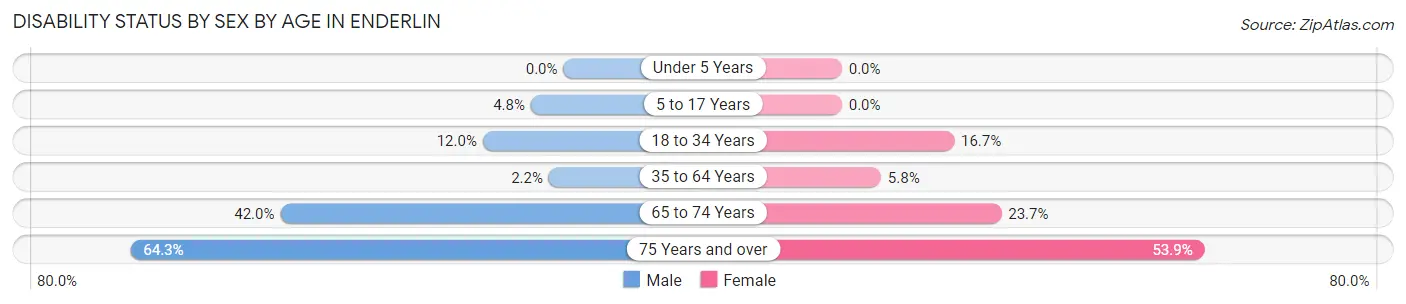
| Age Bracket | Male | Female |
| Under 5 Years | 0 (0.0%) | 0 (0.0%) |
| 5 to 17 Years | 3 (4.8%) | 0 (0.0%) |
| 18 to 34 Years | 14 (12.0%) | 18 (16.7%) |
| 35 to 64 Years | 4 (2.2%) | 10 (5.8%) |
| 65 to 74 Years | 29 (42.0%) | 9 (23.7%) |
| 75 Years and over | 9 (64.3%) | 35 (53.8%) |
Disability Class by Sex by Age in Enderlin
Disability Class: Hearing Difficulty
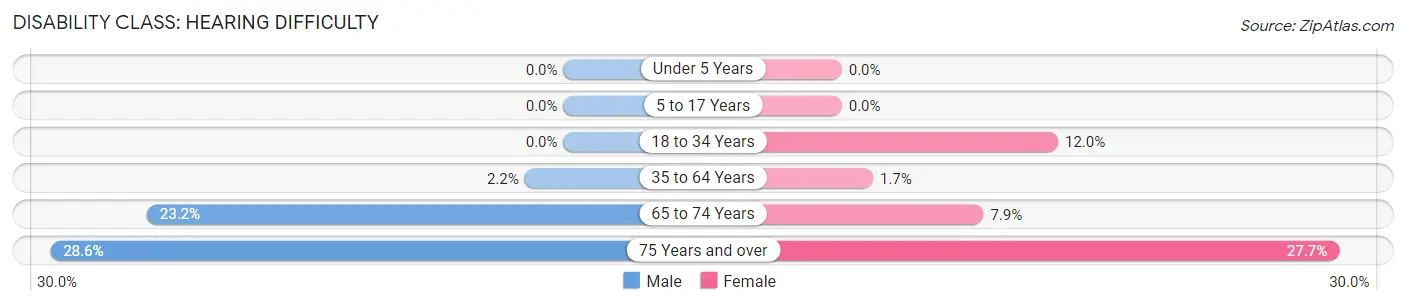
| Age Bracket | Male | Female |
| Under 5 Years | 0 (0.0%) | 0 (0.0%) |
| 5 to 17 Years | 0 (0.0%) | 0 (0.0%) |
| 18 to 34 Years | 0 (0.0%) | 13 (12.0%) |
| 35 to 64 Years | 4 (2.2%) | 3 (1.7%) |
| 65 to 74 Years | 16 (23.2%) | 3 (7.9%) |
| 75 Years and over | 4 (28.6%) | 18 (27.7%) |
Disability Class: Vision Difficulty
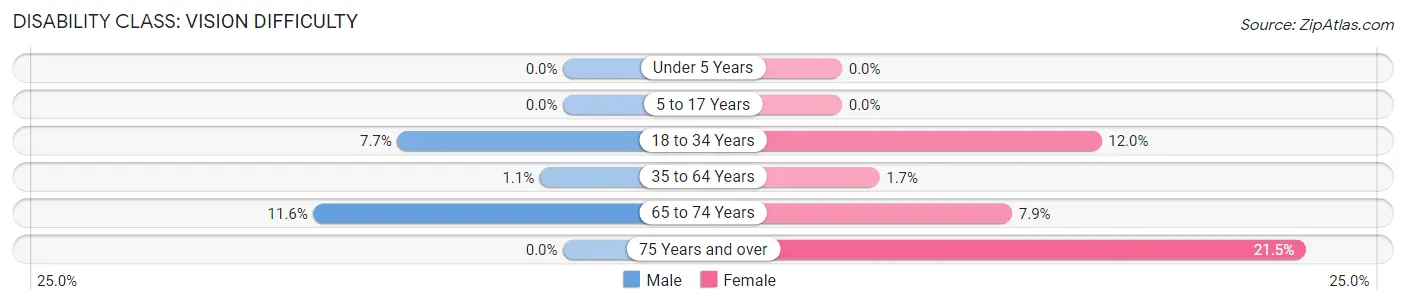
| Age Bracket | Male | Female |
| Under 5 Years | 0 (0.0%) | 0 (0.0%) |
| 5 to 17 Years | 0 (0.0%) | 0 (0.0%) |
| 18 to 34 Years | 9 (7.7%) | 13 (12.0%) |
| 35 to 64 Years | 2 (1.1%) | 3 (1.7%) |
| 65 to 74 Years | 8 (11.6%) | 3 (7.9%) |
| 75 Years and over | 0 (0.0%) | 14 (21.5%) |
Disability Class: Cognitive Difficulty
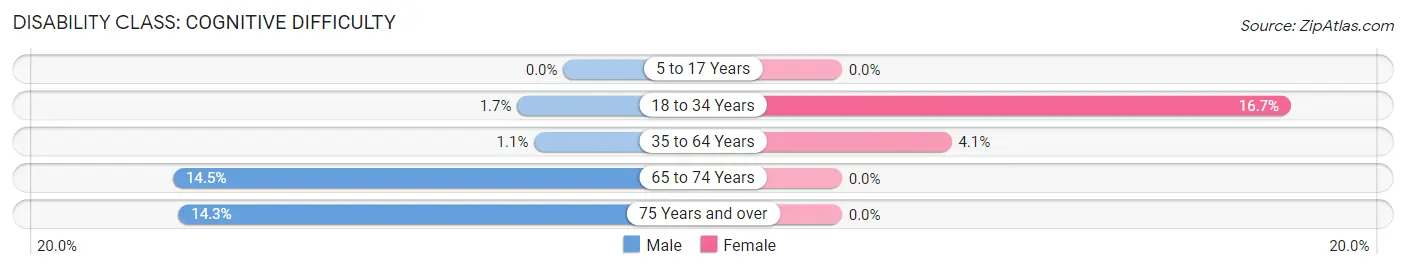
| Age Bracket | Male | Female |
| 5 to 17 Years | 0 (0.0%) | 0 (0.0%) |
| 18 to 34 Years | 2 (1.7%) | 18 (16.7%) |
| 35 to 64 Years | 2 (1.1%) | 7 (4.1%) |
| 65 to 74 Years | 10 (14.5%) | 0 (0.0%) |
| 75 Years and over | 2 (14.3%) | 0 (0.0%) |
Disability Class: Ambulatory Difficulty
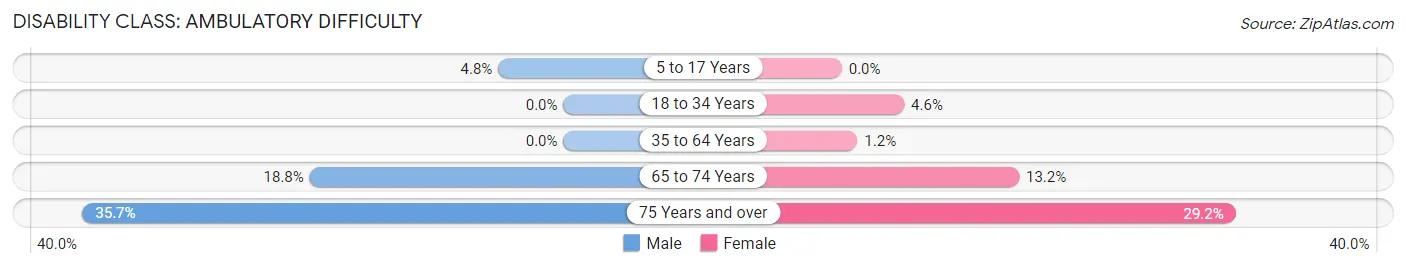
| Age Bracket | Male | Female |
| 5 to 17 Years | 3 (4.8%) | 0 (0.0%) |
| 18 to 34 Years | 0 (0.0%) | 5 (4.6%) |
| 35 to 64 Years | 0 (0.0%) | 2 (1.2%) |
| 65 to 74 Years | 13 (18.8%) | 5 (13.2%) |
| 75 Years and over | 5 (35.7%) | 19 (29.2%) |
Disability Class: Self-Care Difficulty
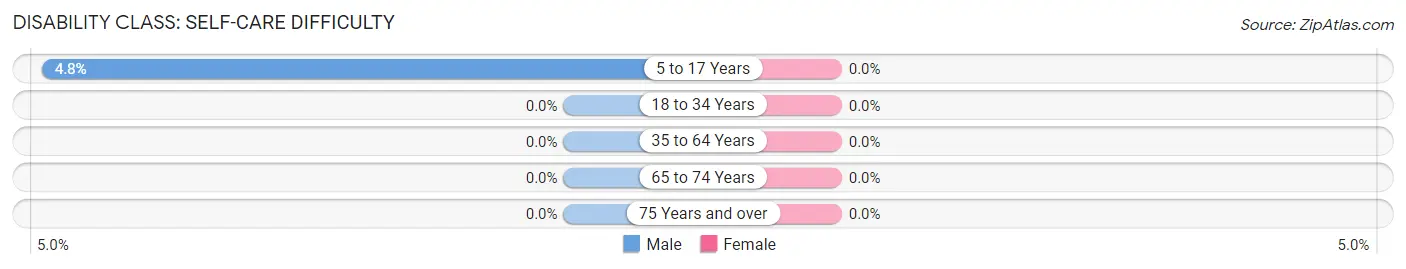
| Age Bracket | Male | Female |
| 5 to 17 Years | 3 (4.8%) | 0 (0.0%) |
| 18 to 34 Years | 0 (0.0%) | 0 (0.0%) |
| 35 to 64 Years | 0 (0.0%) | 0 (0.0%) |
| 65 to 74 Years | 0 (0.0%) | 0 (0.0%) |
| 75 Years and over | 0 (0.0%) | 0 (0.0%) |
Technology Access in Enderlin
Computing Device Access in Enderlin
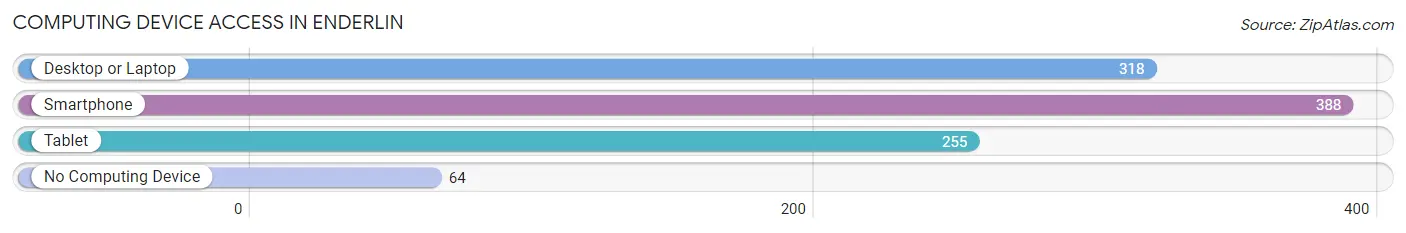
| Device Type | # Households | % Households |
| Desktop or Laptop | 318 | 66.1% |
| Smartphone | 388 | 80.7% |
| Tablet | 255 | 53.0% |
| No Computing Device | 64 | 13.3% |
| Total | 481 | 100.0% |
Internet Access in Enderlin
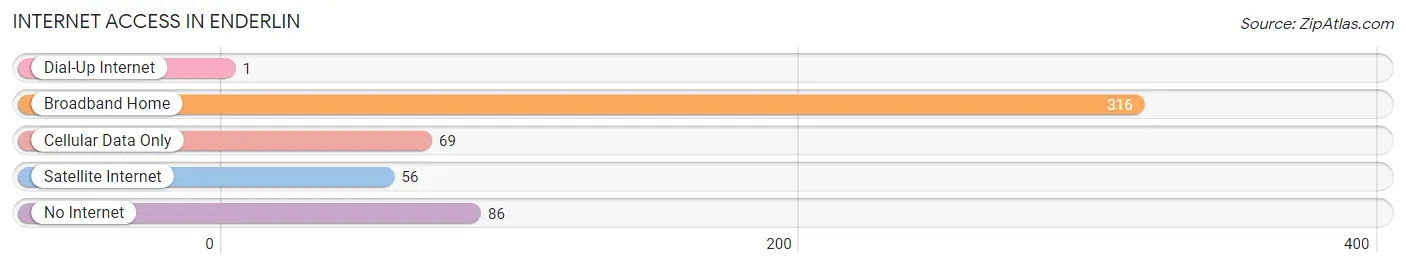
| Internet Type | # Households | % Households |
| Dial-Up Internet | 1 | 0.2% |
| Broadband Home | 316 | 65.7% |
| Cellular Data Only | 69 | 14.3% |
| Satellite Internet | 56 | 11.6% |
| No Internet | 86 | 17.9% |
| Total | 481 | 100.0% |
Enderlin Summary
Enderlin is a city located in southeastern North Dakota, in the United States. It is the county seat of Cass County and is part of the Fargo-Moorhead metropolitan area. The city was founded in 1881 and has a population of 1,845 as of the 2010 census.
Geography
Enderlin is located at the intersection of Interstate 94 and North Dakota Highway 13, about 25 miles west of Fargo. The city is situated on the Sheyenne River, which flows through the city and is a major source of recreation for the area. The city is surrounded by agricultural land, with the nearest major city being Fargo, about 25 miles to the east.
Climate
Enderlin has a humid continental climate, with cold winters and hot summers. The average annual temperature is 45°F, with an average high of 57°F in July and an average low of 33°F in January. The average annual precipitation is 22 inches, with the most occurring in June and July.
Demographics
As of the 2010 census, there were 1,845 people, 745 households, and 486 families residing in the city. The population density was 1,092.3 people per square mile. The racial makeup of the city was 97.2% White, 0.7% African American, 0.3% Native American, 0.2% Asian, 0.1% Pacific Islander, 0.4% from other races, and 1.1% from two or more races. Hispanic or Latino of any race were 1.2% of the population.
Economy
Enderlin's economy is largely based on agriculture, with the city being surrounded by agricultural land. The city is also home to several businesses, including a grocery store, a hardware store, a bank, and a few restaurants. The city is also home to a few manufacturing companies, including a plastics manufacturer and a metal fabrication company.
Education
Enderlin is served by the Enderlin Public School District, which consists of one elementary school, one middle school, and one high school. The city is also home to a branch of the North Dakota State College of Science, which offers a variety of degree programs.
Transportation
Enderlin is served by Interstate 94, which runs east-west through the city. The city is also served by North Dakota Highway 13, which runs north-south through the city. The city is served by the Enderlin Municipal Airport, which offers general aviation services.
Culture
Enderlin is home to a variety of cultural attractions, including the Enderlin Historical Museum, which houses artifacts from the city's history, and the Enderlin Arts Center, which offers a variety of art classes and exhibits. The city also hosts a variety of annual events, including the Enderlin Summer Festival, which features a parade, live music, and a variety of food vendors.
Common Questions
What is the Total Population of Enderlin?
Total Population of Enderlin is 1,030.
What is the Total Male Population of Enderlin?
Total Male Population of Enderlin is 511.
What is the Total Female Population of Enderlin?
Total Female Population of Enderlin is 519.
What is the Ratio of Males per 100 Females in Enderlin?
There are 98.46 Males per 100 Females in Enderlin.
What is the Ratio of Females per 100 Males in Enderlin?
There are 101.57 Females per 100 Males in Enderlin.
What is the Median Population Age in Enderlin?
Median Population Age in Enderlin is 43.4 Years.
What is the Average Family Size in Enderlin
Average Family Size in Enderlin is 2.6 People.
What is the Average Household Size in Enderlin
Average Household Size in Enderlin is 2.0 People.
What is Per Capita Income in Enderlin?
Per Capita income in Enderlin is $34,010.
What is the Median Family Income in Enderlin?
Median Family Income in Enderlin is $74,293.
What is the Median Household income in Enderlin?
Median Household Income in Enderlin is $58,403.
What is Income or Wage Gap in Enderlin?
Income or Wage Gap in Enderlin is 3.9%.
Women in Enderlin earn 96.1 cents for every dollar earned by a man.
What is Inequality or Gini Index in Enderlin?
Inequality or Gini Index in Enderlin is 0.38.
How Large is the Labor Force in Enderlin?
There are 501 People in the Labor Forcein in Enderlin.
What is the Percentage of People in the Labor Force in Enderlin?
58.4% of People are in the Labor Force in Enderlin.
What is the Unemployment Rate in Enderlin?
Unemployment Rate in Enderlin is 4.4%.