Emerado, ND
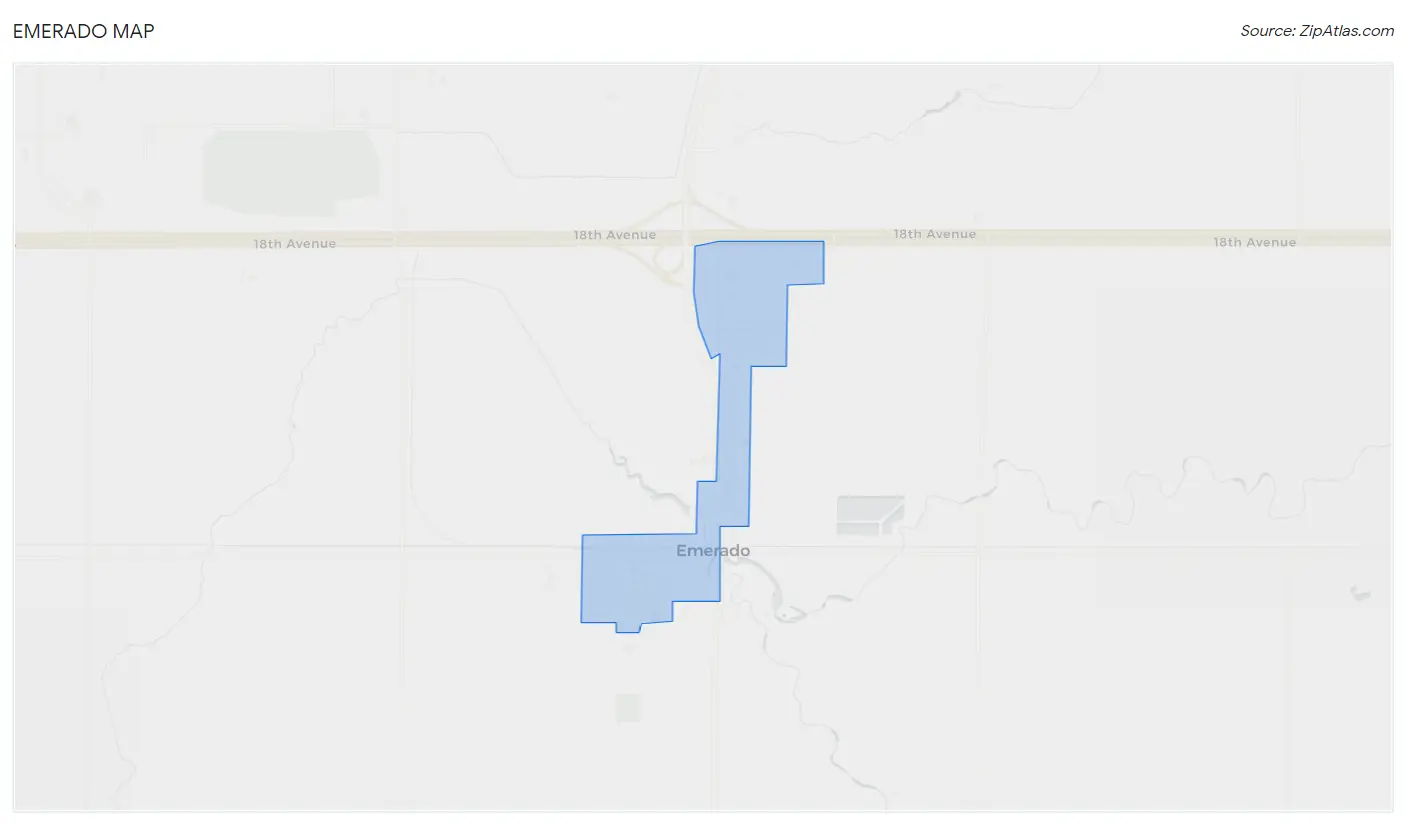
Emerado Map
Emerado Overview
416
TOTAL POPULATION
211
MALE POPULATION
205
FEMALE POPULATION
102.93
MALES / 100 FEMALES
97.16
FEMALES / 100 MALES
31.5
MEDIAN AGE
2.7
AVG FAMILY SIZE
2.2
AVG HOUSEHOLD SIZE
$31,916
PER CAPITA INCOME
$93,750
AVG FAMILY INCOME
$64,271
AVG HOUSEHOLD INCOME
18.4%
WAGE / INCOME GAP [ % ]
81.6¢/ $1
WAGE / INCOME GAP [ $ ]
0.33
INEQUALITY / GINI INDEX
219
LABOR FORCE [ PEOPLE ]
72.5%
PERCENT IN LABOR FORCE
3.3%
UNEMPLOYMENT RATE
Emerado Zip Codes
Emerado Area Codes
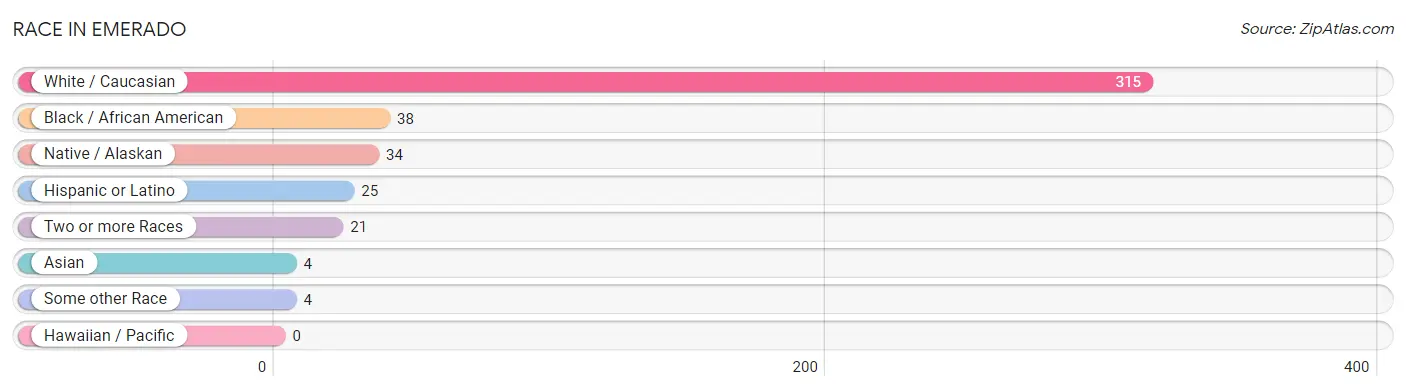
Race in Emerado
The most populous races in Emerado are White / Caucasian (315 | 75.7%), Black / African American (38 | 9.1%), and Native / Alaskan (34 | 8.2%).
| Race | # Population | % Population |
| Asian | 4 | 1.0% |
| Black / African American | 38 | 9.1% |
| Hawaiian / Pacific | 0 | 0.0% |
| Hispanic or Latino | 25 | 6.0% |
| Native / Alaskan | 34 | 8.2% |
| White / Caucasian | 315 | 75.7% |
| Two or more Races | 21 | 5.1% |
| Some other Race | 4 | 1.0% |
| Total | 416 | 100.0% |
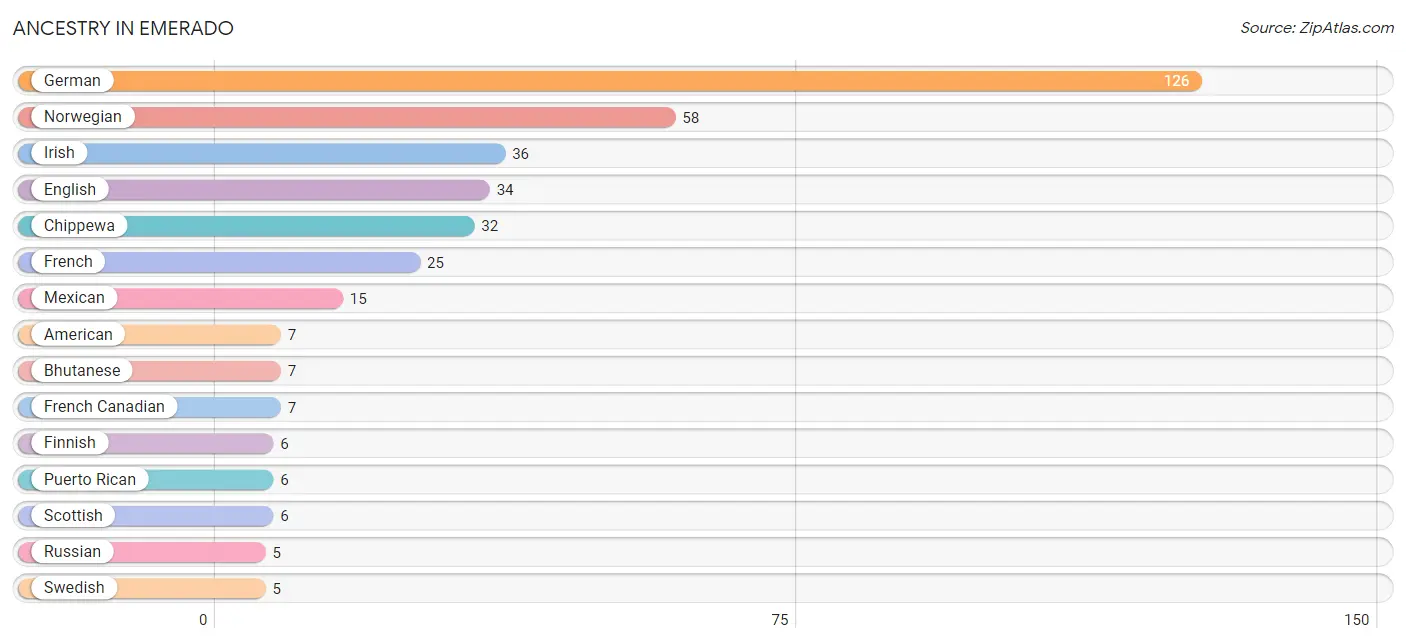
Ancestry in Emerado
The most populous ancestries reported in Emerado are German (126 | 30.3%), Norwegian (58 | 13.9%), Irish (36 | 8.6%), English (34 | 8.2%), and Chippewa (32 | 7.7%), together accounting for 68.7% of all Emerado residents.
| Ancestry | # Population | % Population |
| American | 7 | 1.7% |
| Bhutanese | 7 | 1.7% |
| Chippewa | 32 | 7.7% |
| Cuban | 4 | 1.0% |
| Czech | 4 | 1.0% |
| Danish | 2 | 0.5% |
| Dutch | 3 | 0.7% |
| English | 34 | 8.2% |
| Finnish | 6 | 1.4% |
| French | 25 | 6.0% |
| French Canadian | 7 | 1.7% |
| German | 126 | 30.3% |
| Icelander | 4 | 1.0% |
| Irish | 36 | 8.6% |
| Korean | 4 | 1.0% |
| Mexican | 15 | 3.6% |
| Norwegian | 58 | 13.9% |
| Puerto Rican | 6 | 1.4% |
| Russian | 5 | 1.2% |
| Scandinavian | 3 | 0.7% |
| Scottish | 6 | 1.4% |
| Sioux | 2 | 0.5% |
| Swedish | 5 | 1.2% |
| Welsh | 3 | 0.7% | View All 24 Rows |
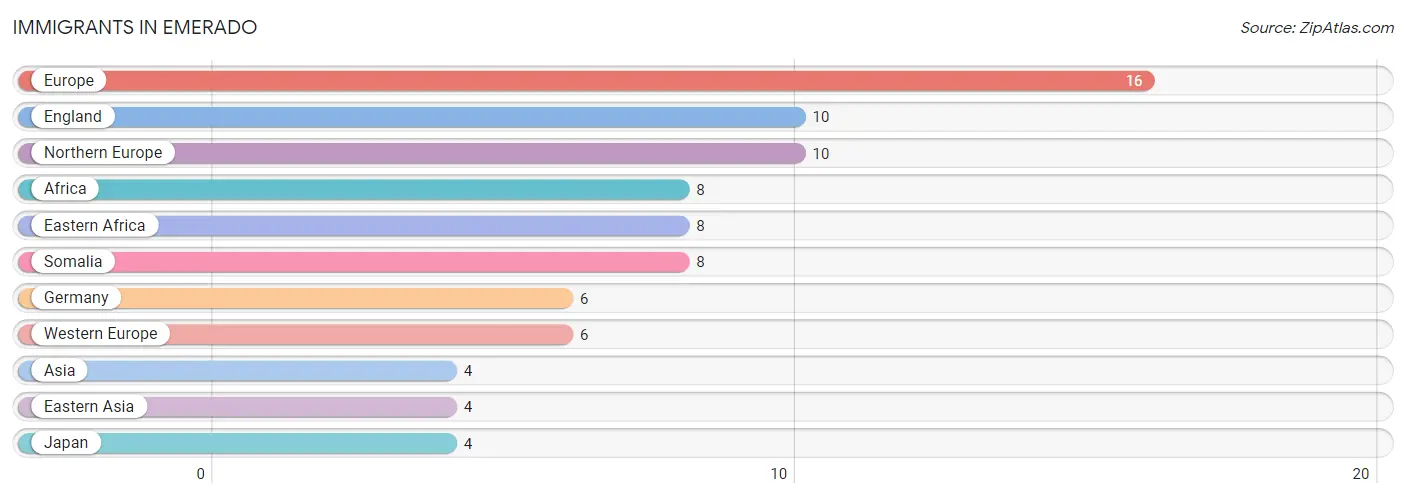
Immigrants in Emerado
The most numerous immigrant groups reported in Emerado came from Europe (16 | 3.8%), England (10 | 2.4%), Northern Europe (10 | 2.4%), Africa (8 | 1.9%), and Eastern Africa (8 | 1.9%), together accounting for 12.5% of all Emerado residents.
| Immigration Origin | # Population | % Population |
| Africa | 8 | 1.9% |
| Asia | 4 | 1.0% |
| Eastern Africa | 8 | 1.9% |
| Eastern Asia | 4 | 1.0% |
| England | 10 | 2.4% |
| Europe | 16 | 3.8% |
| Germany | 6 | 1.4% |
| Japan | 4 | 1.0% |
| Northern Europe | 10 | 2.4% |
| Somalia | 8 | 1.9% |
| Western Europe | 6 | 1.4% | View All 11 Rows |
Sex and Age in Emerado
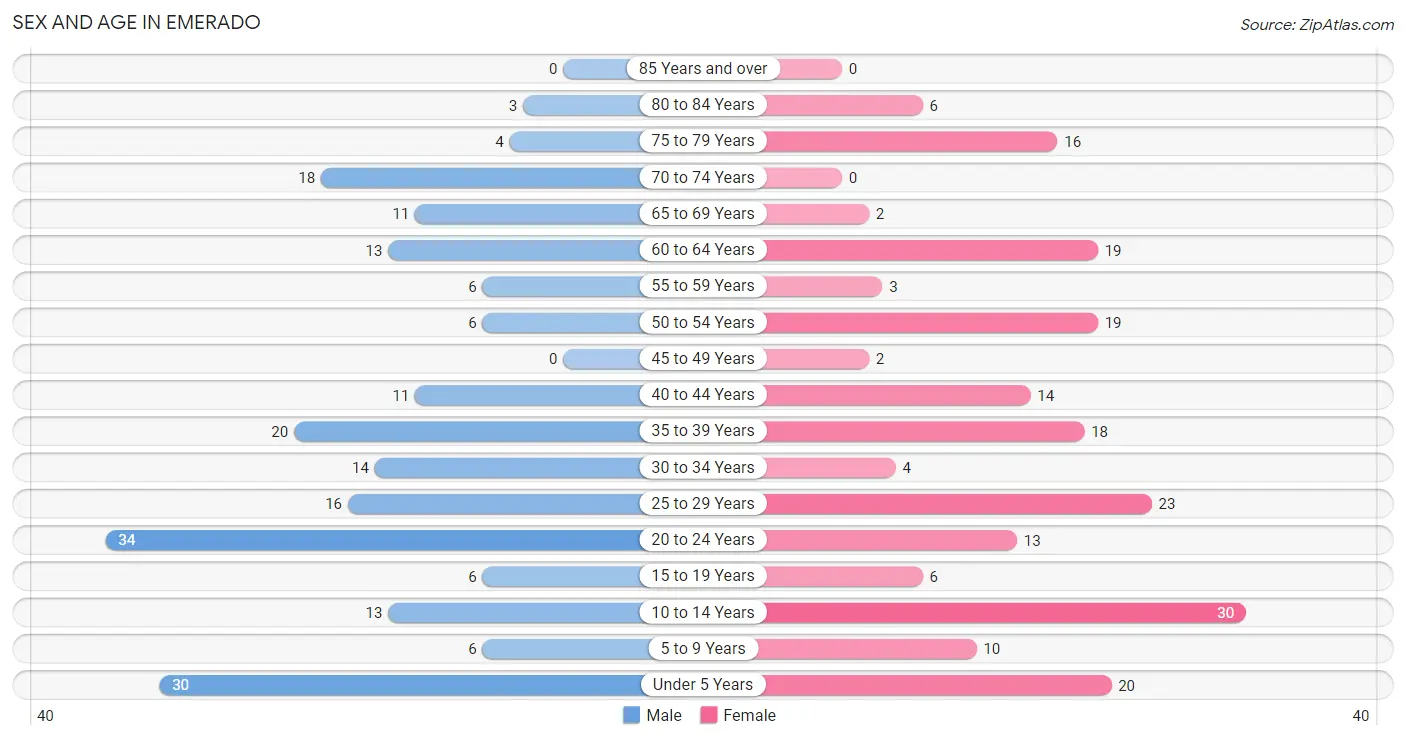
Sex and Age in Emerado
The most populous age groups in Emerado are 20 to 24 Years (34 | 16.1%) for men and 10 to 14 Years (30 | 14.6%) for women.
| Age Bracket | Male | Female |
| Under 5 Years | 30 (14.2%) | 20 (9.8%) |
| 5 to 9 Years | 6 (2.8%) | 10 (4.9%) |
| 10 to 14 Years | 13 (6.2%) | 30 (14.6%) |
| 15 to 19 Years | 6 (2.8%) | 6 (2.9%) |
| 20 to 24 Years | 34 (16.1%) | 13 (6.3%) |
| 25 to 29 Years | 16 (7.6%) | 23 (11.2%) |
| 30 to 34 Years | 14 (6.6%) | 4 (1.9%) |
| 35 to 39 Years | 20 (9.5%) | 18 (8.8%) |
| 40 to 44 Years | 11 (5.2%) | 14 (6.8%) |
| 45 to 49 Years | 0 (0.0%) | 2 (1.0%) |
| 50 to 54 Years | 6 (2.8%) | 19 (9.3%) |
| 55 to 59 Years | 6 (2.8%) | 3 (1.5%) |
| 60 to 64 Years | 13 (6.2%) | 19 (9.3%) |
| 65 to 69 Years | 11 (5.2%) | 2 (1.0%) |
| 70 to 74 Years | 18 (8.5%) | 0 (0.0%) |
| 75 to 79 Years | 4 (1.9%) | 16 (7.8%) |
| 80 to 84 Years | 3 (1.4%) | 6 (2.9%) |
| 85 Years and over | 0 (0.0%) | 0 (0.0%) |
| Total | 211 (100.0%) | 205 (100.0%) |
Families and Households in Emerado
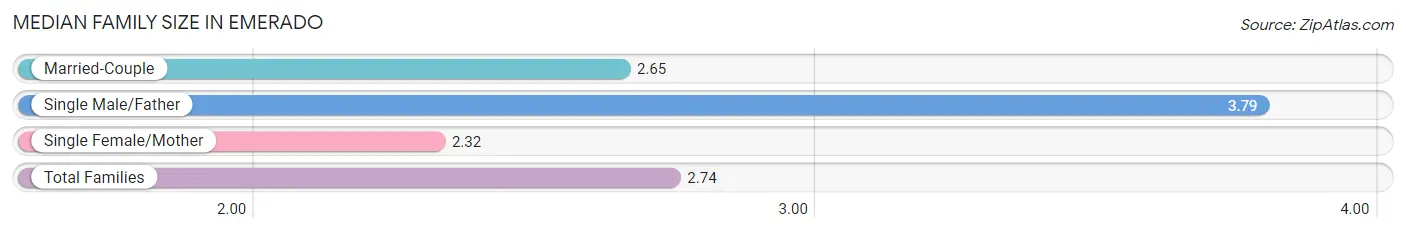
Median Family Size in Emerado
The median family size in Emerado is 2.74 persons per family, with single male/father families (14 | 13.0%) accounting for the largest median family size of 3.79 persons per family. On the other hand, single female/mother families (19 | 17.6%) represent the smallest median family size with 2.32 persons per family.
| Family Type | # Families | Family Size |
| Married-Couple | 75 (69.4%) | 2.65 |
| Single Male/Father | 14 (13.0%) | 3.79 |
| Single Female/Mother | 19 (17.6%) | 2.32 |
| Total Families | 108 (100.0%) | 2.74 |
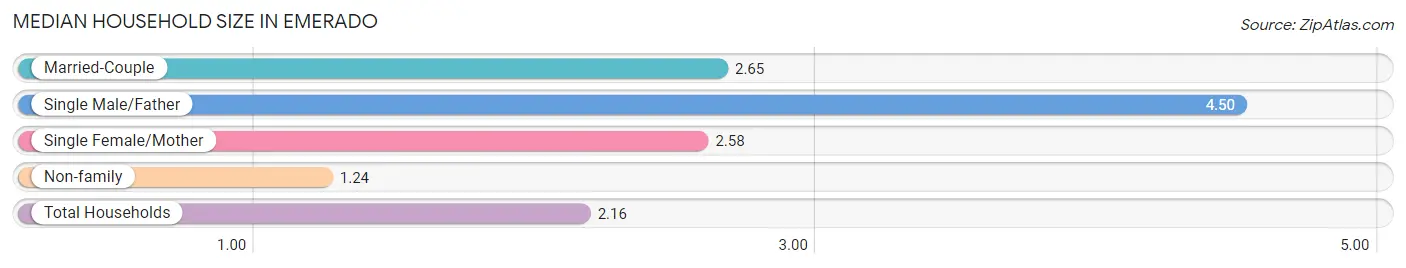
Median Household Size in Emerado
The median household size in Emerado is 2.16 persons per household, with single male/father households (14 | 7.2%) accounting for the largest median household size of 4.5 persons per household. non-family households (85 | 44.0%) represent the smallest median household size with 1.24 persons per household.
| Household Type | # Households | Household Size |
| Married-Couple | 75 (38.9%) | 2.65 |
| Single Male/Father | 14 (7.2%) | 4.50 |
| Single Female/Mother | 19 (9.8%) | 2.58 |
| Non-family | 85 (44.0%) | 1.24 |
| Total Households | 193 (100.0%) | 2.16 |
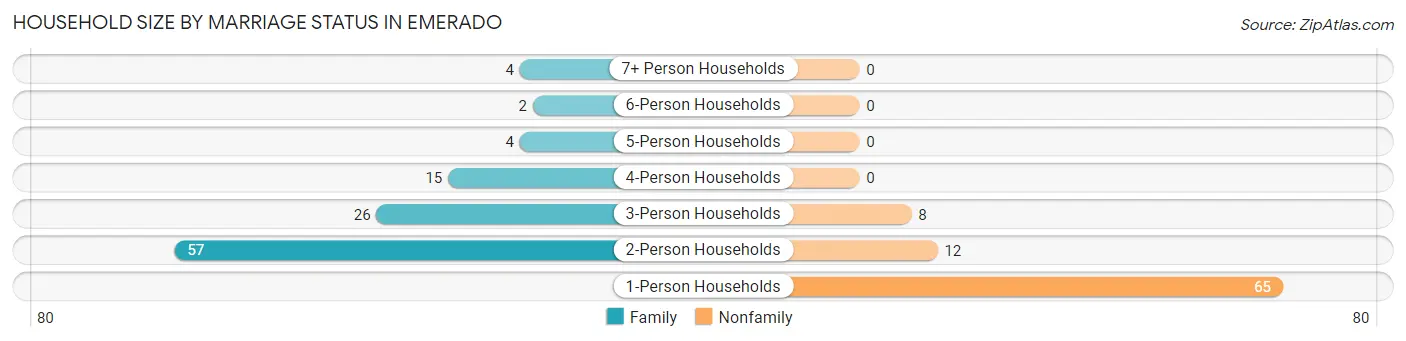
Household Size by Marriage Status in Emerado
Out of a total of 193 households in Emerado, 108 (56.0%) are family households, while 85 (44.0%) are nonfamily households. The most numerous type of family households are 2-person households, comprising 57, and the most common type of nonfamily households are 1-person households, comprising 65.
| Household Size | Family Households | Nonfamily Households |
| 1-Person Households | - | 65 (33.7%) |
| 2-Person Households | 57 (29.5%) | 12 (6.2%) |
| 3-Person Households | 26 (13.5%) | 8 (4.2%) |
| 4-Person Households | 15 (7.8%) | 0 (0.0%) |
| 5-Person Households | 4 (2.1%) | 0 (0.0%) |
| 6-Person Households | 2 (1.0%) | 0 (0.0%) |
| 7+ Person Households | 4 (2.1%) | 0 (0.0%) |
| Total | 108 (56.0%) | 85 (44.0%) |
Female Fertility in Emerado
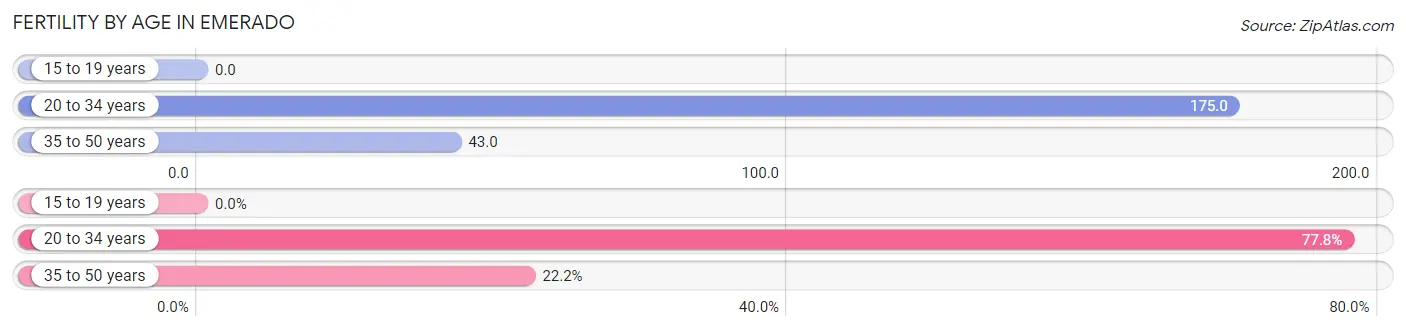
Fertility by Age in Emerado
Average fertility rate in Emerado is 98.0 births per 1,000 women. Women in the age bracket of 20 to 34 years have the highest fertility rate with 175.0 births per 1,000 women. Women in the age bracket of 20 to 34 years acount for 77.8% of all women with births.
| Age Bracket | Women with Births | Births / 1,000 Women |
| 15 to 19 years | 0 (0.0%) | 0.0 |
| 20 to 34 years | 7 (77.8%) | 175.0 |
| 35 to 50 years | 2 (22.2%) | 43.0 |
| Total | 9 (100.0%) | 98.0 |
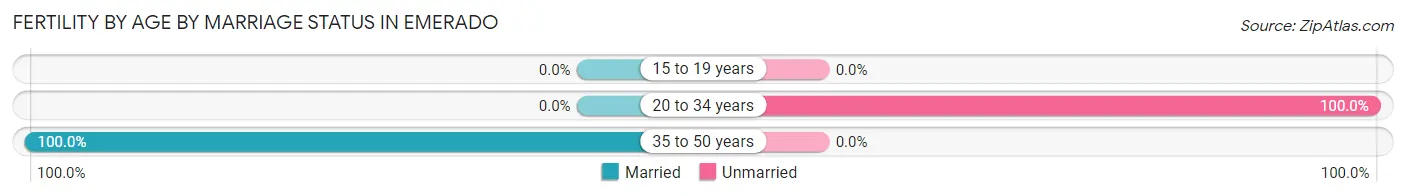
Fertility by Age by Marriage Status in Emerado
22.2% of women with births (9) in Emerado are married. The highest percentage of unmarried women with births falls into 20 to 34 years age bracket with 100.0% of them unmarried at the time of birth, while the lowest percentage of unmarried women with births belong to 35 to 50 years age bracket with 0.0% of them unmarried.
| Age Bracket | Married | Unmarried |
| 15 to 19 years | 0 (0.0%) | 0 (0.0%) |
| 20 to 34 years | 0 (0.0%) | 7 (100.0%) |
| 35 to 50 years | 2 (100.0%) | 0 (0.0%) |
| Total | 2 (22.2%) | 7 (77.8%) |
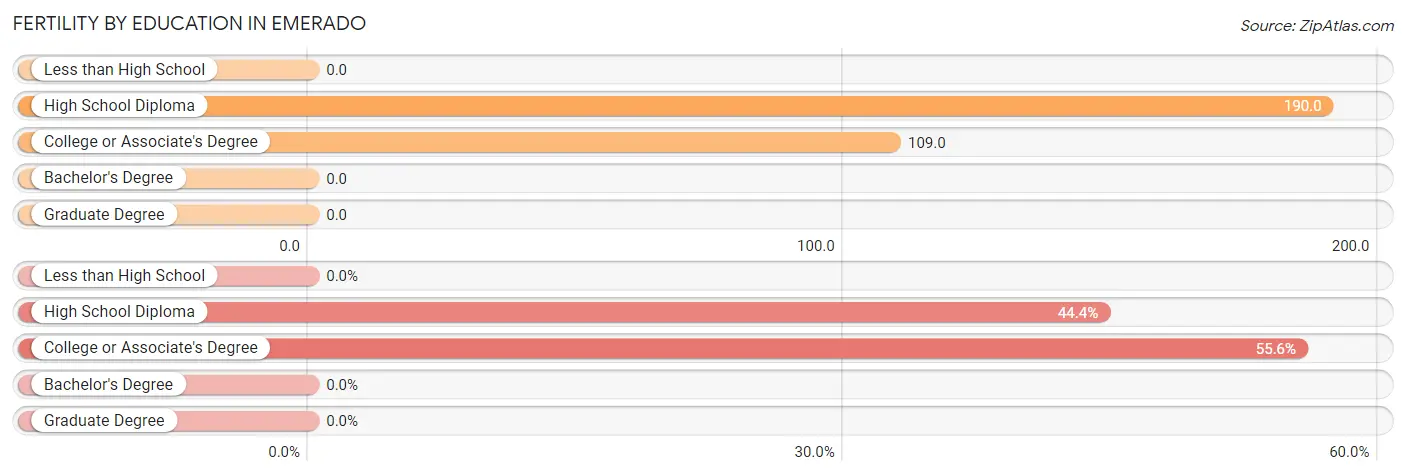
Fertility by Education in Emerado
| Educational Attainment | Women with Births | Births / 1,000 Women |
| Less than High School | 0 (0.0%) | 0.0 |
| High School Diploma | 4 (44.4%) | 190.0 |
| College or Associate's Degree | 5 (55.6%) | 109.0 |
| Bachelor's Degree | 0 (0.0%) | 0.0 |
| Graduate Degree | 0 (0.0%) | 0.0 |
| Total | 9 (100.0%) | 98.0 |
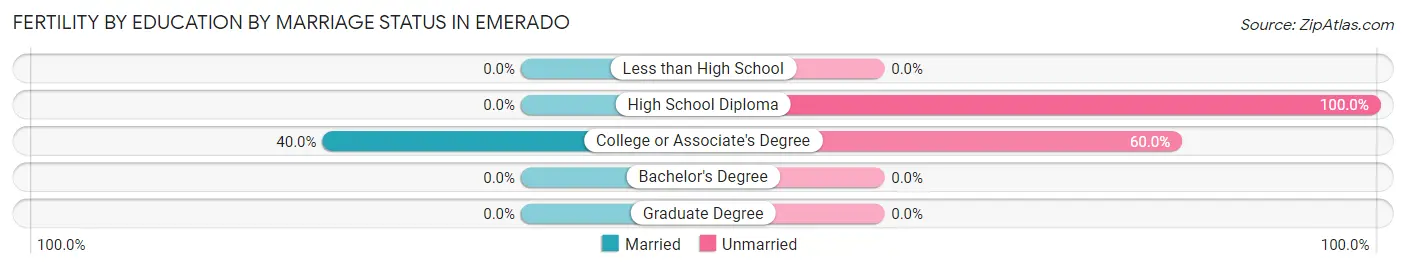
Fertility by Education by Marriage Status in Emerado
77.8% of women with births in Emerado are unmarried. Women with the educational attainment of college or associate's degree are most likely to be married with 40.0% of them married at childbirth, while women with the educational attainment of high school diploma are least likely to be married with 100.0% of them unmarried at childbirth.
| Educational Attainment | Married | Unmarried |
| Less than High School | 0 (0.0%) | 0 (0.0%) |
| High School Diploma | 0 (0.0%) | 4 (100.0%) |
| College or Associate's Degree | 2 (40.0%) | 3 (60.0%) |
| Bachelor's Degree | 0 (0.0%) | 0 (0.0%) |
| Graduate Degree | 0 (0.0%) | 0 (0.0%) |
| Total | 2 (22.2%) | 7 (77.8%) |
Income in Emerado
Income Overview in Emerado
Per Capita Income in Emerado is $31,916, while median incomes of families and households are $93,750 and $64,271 respectively.
| Characteristic | Number | Measure |
| Per Capita Income | 416 | $31,916 |
| Median Family Income | 108 | $93,750 |
| Mean Family Income | 108 | $88,252 |
| Median Household Income | 193 | $64,271 |
| Mean Household Income | 193 | $73,730 |
| Income Deficit | 108 | $0 |
| Wage / Income Gap (%) | 416 | 18.40% |
| Wage / Income Gap ($) | 416 | 81.60¢ per $1 |
| Gini / Inequality Index | 416 | 0.33 |
Earnings by Sex in Emerado
Average Earnings in Emerado are $44,375, $50,938 for men and $41,563 for women, a difference of 18.4%.
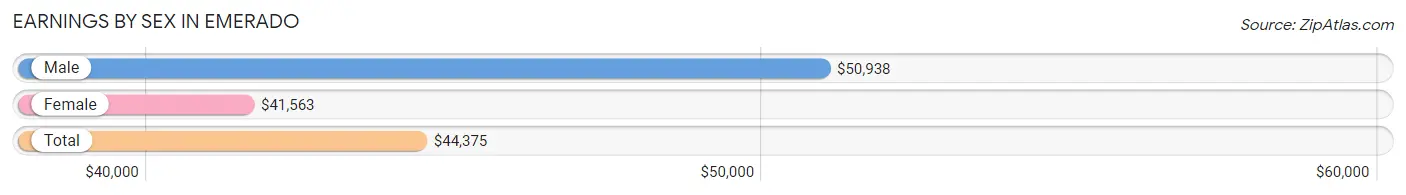
| Sex | Number | Average Earnings |
| Male | 123 (54.4%) | $50,938 |
| Female | 103 (45.6%) | $41,563 |
| Total | 226 (100.0%) | $44,375 |
Earnings by Sex by Income Bracket in Emerado
The most common earnings brackets in Emerado are $55,000 to $64,999 for men (26 | 21.1%) and $65,000 to $74,999 for women (15 | 14.6%).
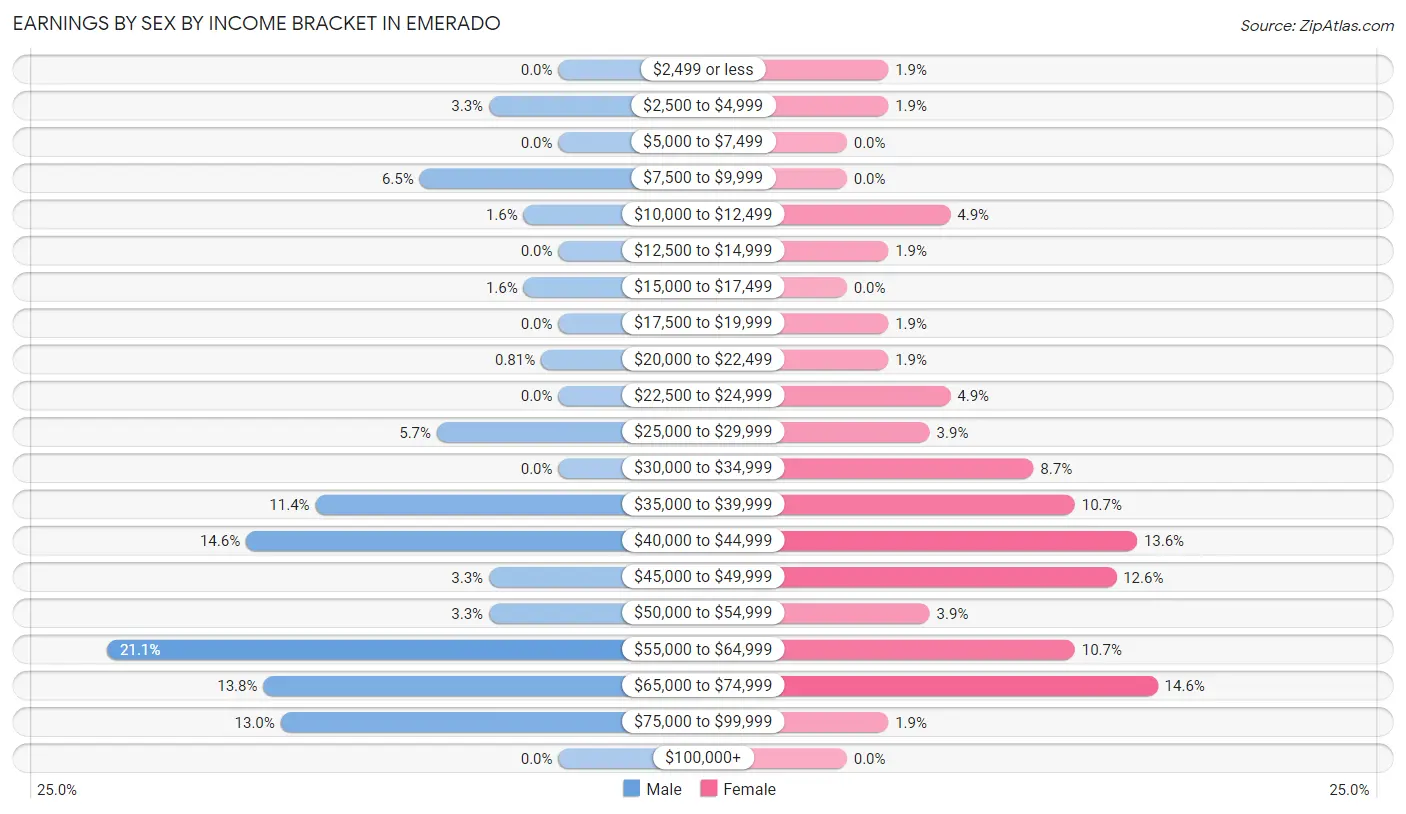
| Income | Male | Female |
| $2,499 or less | 0 (0.0%) | 2 (1.9%) |
| $2,500 to $4,999 | 4 (3.3%) | 2 (1.9%) |
| $5,000 to $7,499 | 0 (0.0%) | 0 (0.0%) |
| $7,500 to $9,999 | 8 (6.5%) | 0 (0.0%) |
| $10,000 to $12,499 | 2 (1.6%) | 5 (4.9%) |
| $12,500 to $14,999 | 0 (0.0%) | 2 (1.9%) |
| $15,000 to $17,499 | 2 (1.6%) | 0 (0.0%) |
| $17,500 to $19,999 | 0 (0.0%) | 2 (1.9%) |
| $20,000 to $22,499 | 1 (0.8%) | 2 (1.9%) |
| $22,500 to $24,999 | 0 (0.0%) | 5 (4.9%) |
| $25,000 to $29,999 | 7 (5.7%) | 4 (3.9%) |
| $30,000 to $34,999 | 0 (0.0%) | 9 (8.7%) |
| $35,000 to $39,999 | 14 (11.4%) | 11 (10.7%) |
| $40,000 to $44,999 | 18 (14.6%) | 14 (13.6%) |
| $45,000 to $49,999 | 4 (3.3%) | 13 (12.6%) |
| $50,000 to $54,999 | 4 (3.3%) | 4 (3.9%) |
| $55,000 to $64,999 | 26 (21.1%) | 11 (10.7%) |
| $65,000 to $74,999 | 17 (13.8%) | 15 (14.6%) |
| $75,000 to $99,999 | 16 (13.0%) | 2 (1.9%) |
| $100,000+ | 0 (0.0%) | 0 (0.0%) |
| Total | 123 (100.0%) | 103 (100.0%) |
Earnings by Sex by Educational Attainment in Emerado
Average earnings in Emerado are $60,625 for men and $42,188 for women, a difference of 30.4%. Men with an educational attainment of college or associate's degree enjoy the highest average annual earnings of $70,833, while those with bachelor's degree education earn the least with $41,458. Women with an educational attainment of graduate degree earn the most with the average annual earnings of $66,250, while those with college or associate's degree education have the smallest earnings of $40,156.
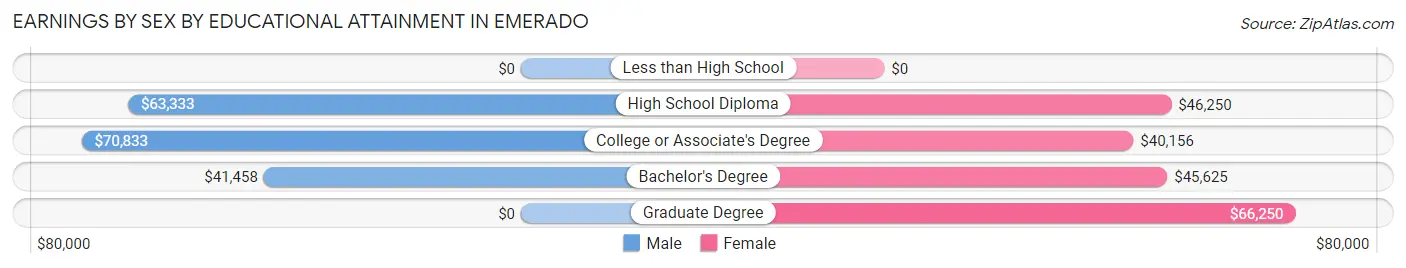
| Educational Attainment | Male Income | Female Income |
| Less than High School | - | - |
| High School Diploma | $63,333 | $46,250 |
| College or Associate's Degree | $70,833 | $40,156 |
| Bachelor's Degree | $41,458 | $45,625 |
| Graduate Degree | - | - |
| Total | $60,625 | $42,188 |
Family Income in Emerado
Family Income Brackets in Emerado
According to the Emerado family income data, there are 43 families falling into the $100,000 to $149,999 income range, which is the most common income bracket and makes up 39.8% of all families.
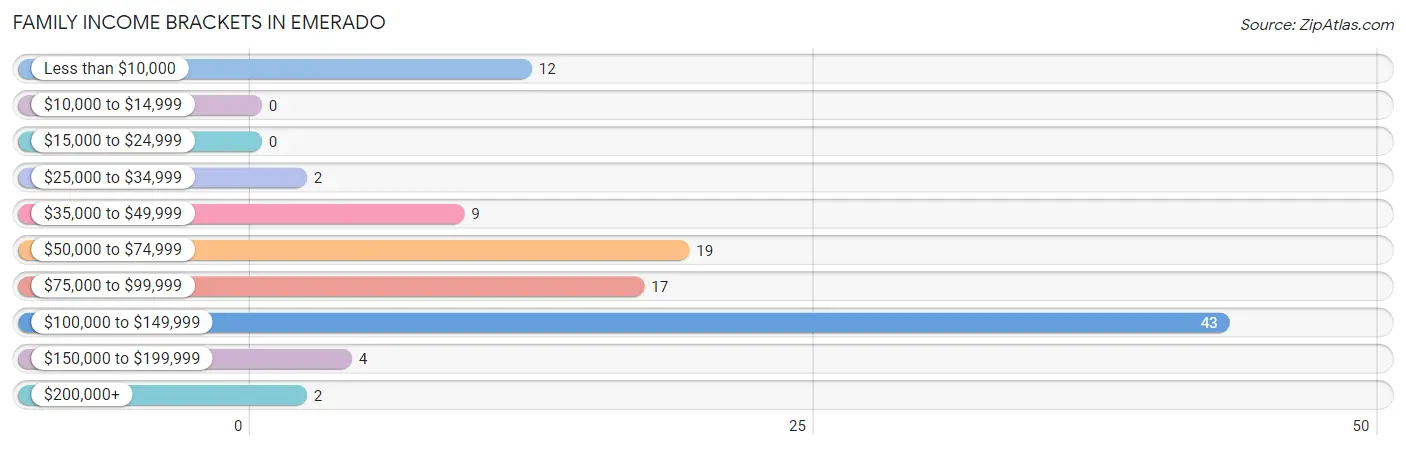
| Income Bracket | # Families | % Families |
| Less than $10,000 | 12 | 11.1% |
| $10,000 to $14,999 | 0 | 0.0% |
| $15,000 to $24,999 | 0 | 0.0% |
| $25,000 to $34,999 | 2 | 1.9% |
| $35,000 to $49,999 | 9 | 8.3% |
| $50,000 to $74,999 | 19 | 17.6% |
| $75,000 to $99,999 | 17 | 15.7% |
| $100,000 to $149,999 | 43 | 39.8% |
| $150,000 to $199,999 | 4 | 3.7% |
| $200,000+ | 2 | 1.9% |
Family Income by Famaliy Size in Emerado
2-person families (60 | 55.6%) account for the highest median family income in Emerado with $115,682 per family, while 2-person families (60 | 55.6%) have the highest median income of $57,841 per family member.
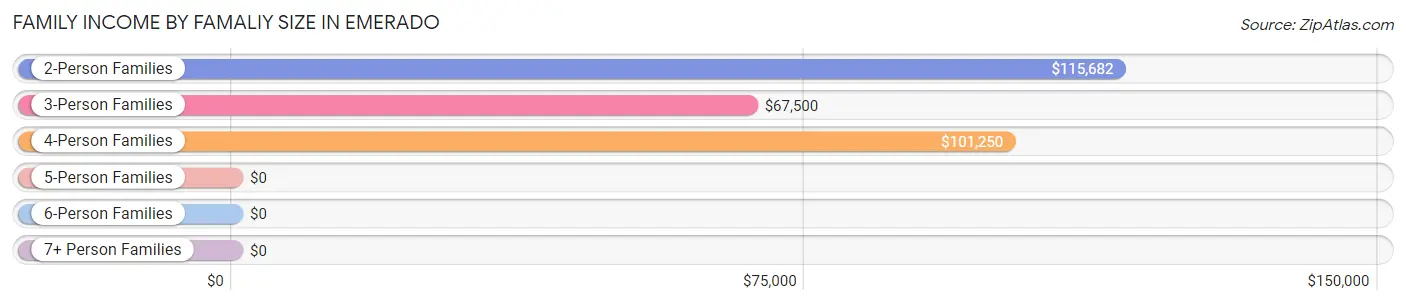
| Income Bracket | # Families | Median Income |
| 2-Person Families | 60 (55.6%) | $115,682 |
| 3-Person Families | 32 (29.6%) | $67,500 |
| 4-Person Families | 6 (5.6%) | $101,250 |
| 5-Person Families | 6 (5.6%) | $0 |
| 6-Person Families | 0 (0.0%) | $0 |
| 7+ Person Families | 4 (3.7%) | $0 |
| Total | 108 (100.0%) | $93,750 |
Family Income by Number of Earners in Emerado
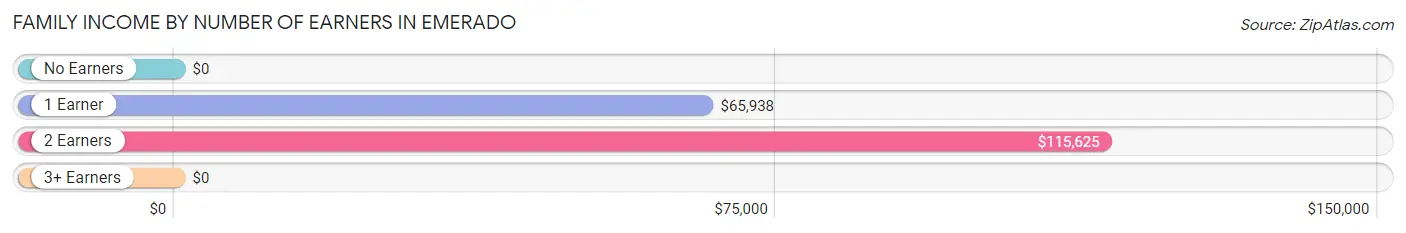
| Number of Earners | # Families | Median Income |
| No Earners | 26 (24.1%) | $0 |
| 1 Earner | 37 (34.3%) | $65,938 |
| 2 Earners | 41 (38.0%) | $115,625 |
| 3+ Earners | 4 (3.7%) | $0 |
| Total | 108 (100.0%) | $93,750 |
Household Income in Emerado
Household Income Brackets in Emerado
With 50 households falling in the category, the $100,000 to $149,999 income range is the most frequent in Emerado, accounting for 25.9% of all households. In contrast, only 2 households (1.0%) fall into the $200,000+ income bracket, making it the least populous group.
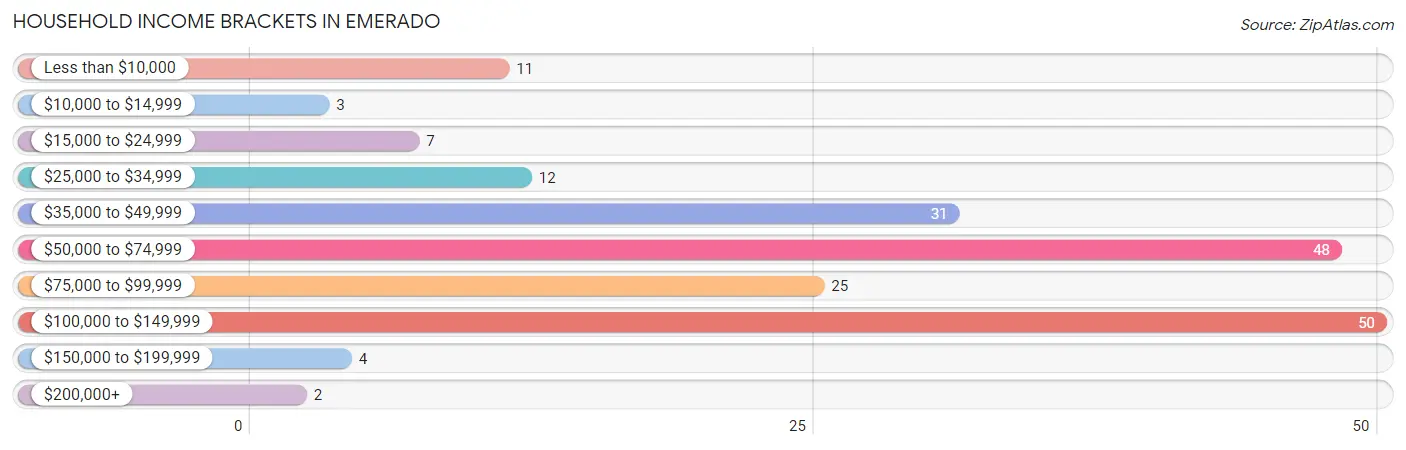
| Income Bracket | # Households | % Households |
| Less than $10,000 | 11 | 5.7% |
| $10,000 to $14,999 | 3 | 1.6% |
| $15,000 to $24,999 | 7 | 3.6% |
| $25,000 to $34,999 | 12 | 6.2% |
| $35,000 to $49,999 | 31 | 16.1% |
| $50,000 to $74,999 | 48 | 24.9% |
| $75,000 to $99,999 | 25 | 13.0% |
| $100,000 to $149,999 | 50 | 25.9% |
| $150,000 to $199,999 | 4 | 2.1% |
| $200,000+ | 2 | 1.0% |
Household Income by Householder Age in Emerado
The median household income in Emerado is $64,271, with the highest median household income of $76,250 found in the 15 to 24 years age bracket for the primary householder. A total of 22 households (11.4%) fall into this category. Meanwhile, the 65+ years age bracket for the primary householder has the lowest median household income of $0, with 44 households (22.8%) in this group.
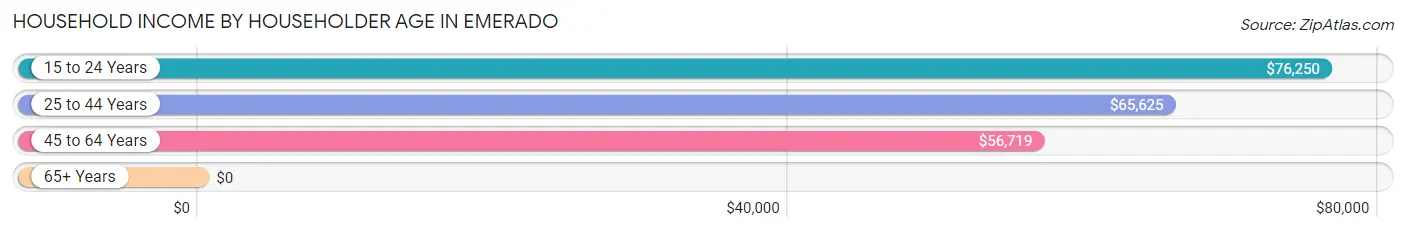
| Income Bracket | # Households | Median Income |
| 15 to 24 Years | 22 (11.4%) | $76,250 |
| 25 to 44 Years | 76 (39.4%) | $65,625 |
| 45 to 64 Years | 51 (26.4%) | $56,719 |
| 65+ Years | 44 (22.8%) | $0 |
| Total | 193 (100.0%) | $64,271 |
Poverty in Emerado
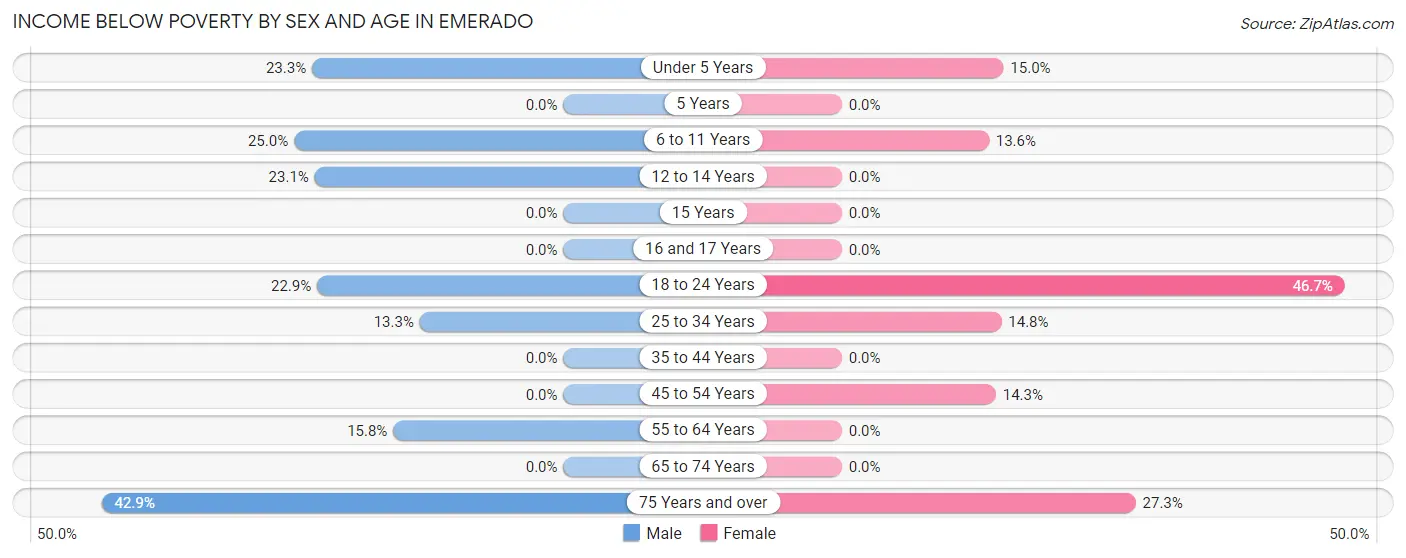
Income Below Poverty by Sex and Age in Emerado
With 13.7% poverty level for males and 12.7% for females among the residents of Emerado, 75 year old and over males and 18 to 24 year old females are the most vulnerable to poverty, with 3 males (42.9%) and 7 females (46.7%) in their respective age groups living below the poverty level.
| Age Bracket | Male | Female |
| Under 5 Years | 7 (23.3%) | 3 (15.0%) |
| 5 Years | 0 (0.0%) | 0 (0.0%) |
| 6 to 11 Years | 1 (25.0%) | 3 (13.6%) |
| 12 to 14 Years | 3 (23.1%) | 0 (0.0%) |
| 15 Years | 0 (0.0%) | 0 (0.0%) |
| 16 and 17 Years | 0 (0.0%) | 0 (0.0%) |
| 18 to 24 Years | 8 (22.9%) | 7 (46.7%) |
| 25 to 34 Years | 4 (13.3%) | 4 (14.8%) |
| 35 to 44 Years | 0 (0.0%) | 0 (0.0%) |
| 45 to 54 Years | 0 (0.0%) | 3 (14.3%) |
| 55 to 64 Years | 3 (15.8%) | 0 (0.0%) |
| 65 to 74 Years | 0 (0.0%) | 0 (0.0%) |
| 75 Years and over | 3 (42.9%) | 6 (27.3%) |
| Total | 29 (13.7%) | 26 (12.7%) |
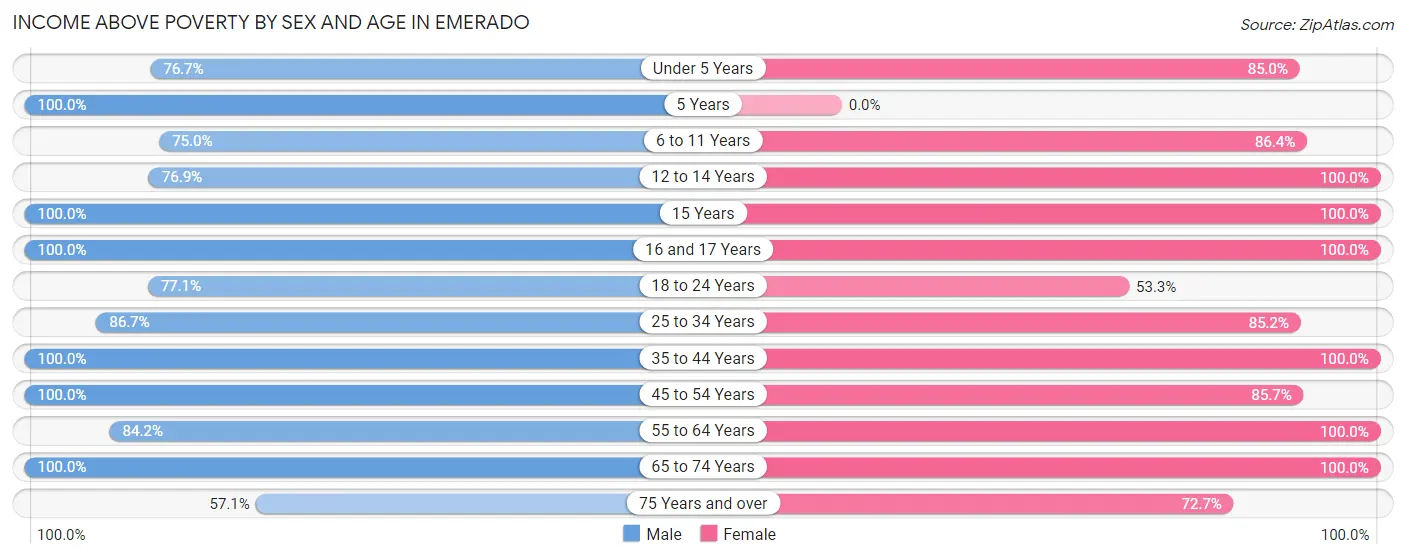
Income Above Poverty by Sex and Age in Emerado
According to the poverty statistics in Emerado, males aged 5 years and females aged 12 to 14 years are the age groups that are most secure financially, with 100.0% of males and 100.0% of females in these age groups living above the poverty line.
| Age Bracket | Male | Female |
| Under 5 Years | 23 (76.7%) | 17 (85.0%) |
| 5 Years | 2 (100.0%) | 0 (0.0%) |
| 6 to 11 Years | 3 (75.0%) | 19 (86.4%) |
| 12 to 14 Years | 10 (76.9%) | 18 (100.0%) |
| 15 Years | 3 (100.0%) | 2 (100.0%) |
| 16 and 17 Years | 2 (100.0%) | 2 (100.0%) |
| 18 to 24 Years | 27 (77.1%) | 8 (53.3%) |
| 25 to 34 Years | 26 (86.7%) | 23 (85.2%) |
| 35 to 44 Years | 31 (100.0%) | 32 (100.0%) |
| 45 to 54 Years | 6 (100.0%) | 18 (85.7%) |
| 55 to 64 Years | 16 (84.2%) | 22 (100.0%) |
| 65 to 74 Years | 29 (100.0%) | 2 (100.0%) |
| 75 Years and over | 4 (57.1%) | 16 (72.7%) |
| Total | 182 (86.3%) | 179 (87.3%) |
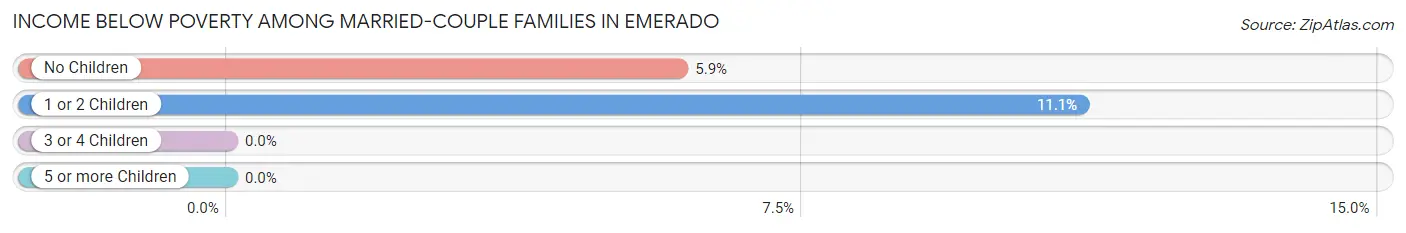
Income Below Poverty Among Married-Couple Families in Emerado
The poverty statistics for married-couple families in Emerado show that 6.7% or 5 of the total 75 families live below the poverty line. Families with 1 or 2 children have the highest poverty rate of 11.1%, comprising of 2 families. On the other hand, families with 3 or 4 children have the lowest poverty rate of 0.0%, which includes 0 families.
| Children | Above Poverty | Below Poverty |
| No Children | 48 (94.1%) | 3 (5.9%) |
| 1 or 2 Children | 16 (88.9%) | 2 (11.1%) |
| 3 or 4 Children | 2 (100.0%) | 0 (0.0%) |
| 5 or more Children | 4 (100.0%) | 0 (0.0%) |
| Total | 70 (93.3%) | 5 (6.7%) |
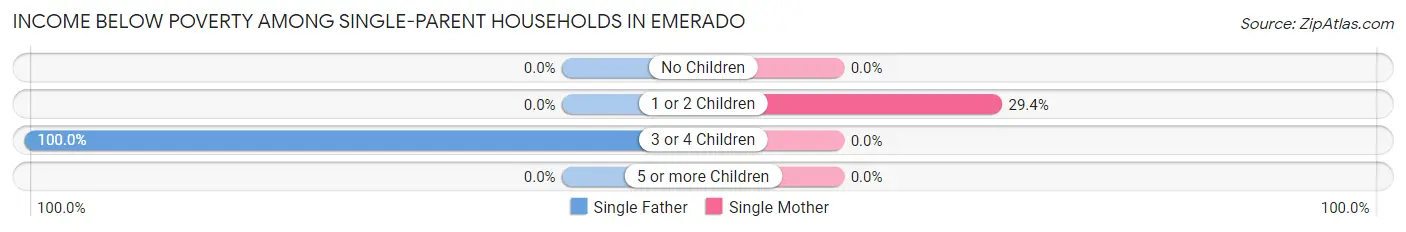
Income Below Poverty Among Single-Parent Households in Emerado
According to the poverty data in Emerado, 14.3% or 2 single-father households and 26.3% or 5 single-mother households are living below the poverty line. Among single-father households, those with 3 or 4 children have the highest poverty rate, with 2 households (100.0%) experiencing poverty. Likewise, among single-mother households, those with 1 or 2 children have the highest poverty rate, with 5 households (29.4%) falling below the poverty line.
| Children | Single Father | Single Mother |
| No Children | 0 (0.0%) | 0 (0.0%) |
| 1 or 2 Children | 0 (0.0%) | 5 (29.4%) |
| 3 or 4 Children | 2 (100.0%) | 0 (0.0%) |
| 5 or more Children | 0 (0.0%) | 0 (0.0%) |
| Total | 2 (14.3%) | 5 (26.3%) |
Income Below Poverty Among Married-Couple vs Single-Parent Households in Emerado
The poverty data for Emerado shows that 5 of the married-couple family households (6.7%) and 7 of the single-parent households (21.2%) are living below the poverty level. Within the married-couple family households, those with 1 or 2 children have the highest poverty rate, with 2 households (11.1%) falling below the poverty line. Among the single-parent households, those with 3 or 4 children have the highest poverty rate, with 2 household (100.0%) living below poverty.
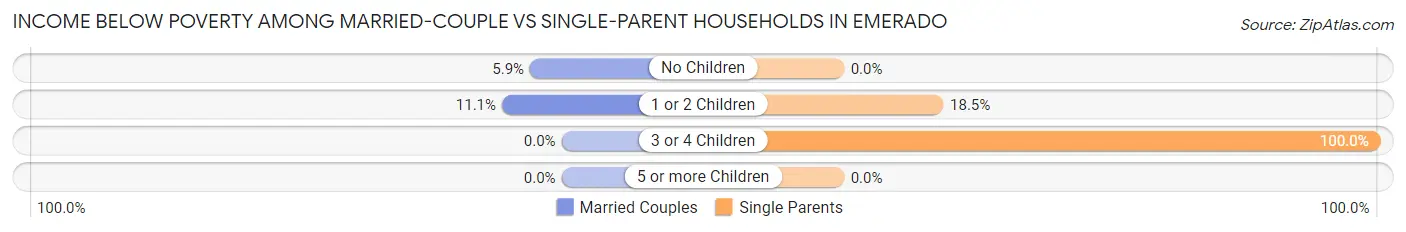
| Children | Married-Couple Families | Single-Parent Households |
| No Children | 3 (5.9%) | 0 (0.0%) |
| 1 or 2 Children | 2 (11.1%) | 5 (18.5%) |
| 3 or 4 Children | 0 (0.0%) | 2 (100.0%) |
| 5 or more Children | 0 (0.0%) | 0 (0.0%) |
| Total | 5 (6.7%) | 7 (21.2%) |
Employment Characteristics in Emerado
Employment by Class of Employer in Emerado
Among the 212 employed individuals in Emerado, private company employees (152 | 71.7%), federal government employees (18 | 8.5%), and not-for-profit organizations (16 | 7.5%) make up the most common classes of employment.
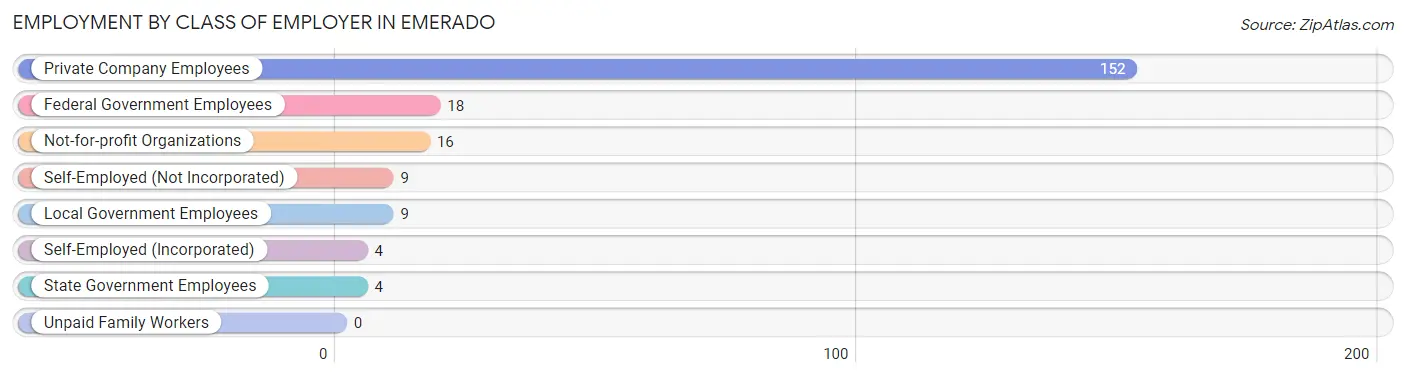
| Employer Class | # Employees | % Employees |
| Private Company Employees | 152 | 71.7% |
| Self-Employed (Incorporated) | 4 | 1.9% |
| Self-Employed (Not Incorporated) | 9 | 4.3% |
| Not-for-profit Organizations | 16 | 7.5% |
| Local Government Employees | 9 | 4.3% |
| State Government Employees | 4 | 1.9% |
| Federal Government Employees | 18 | 8.5% |
| Unpaid Family Workers | 0 | 0.0% |
| Total | 212 | 100.0% |
Employment Status by Age in Emerado
According to the labor force statistics for Emerado, out of the total population over 16 years of age (302), 72.5% or 219 individuals are in the labor force, with 3.3% or 7 of them unemployed. The age group with the highest labor force participation rate is 45 to 54 years, with 100.0% or 27 individuals in the labor force. Within the labor force, the 30 to 34 years age range has the highest percentage of unemployed individuals, with 28.6% or 4 of them being unemployed.
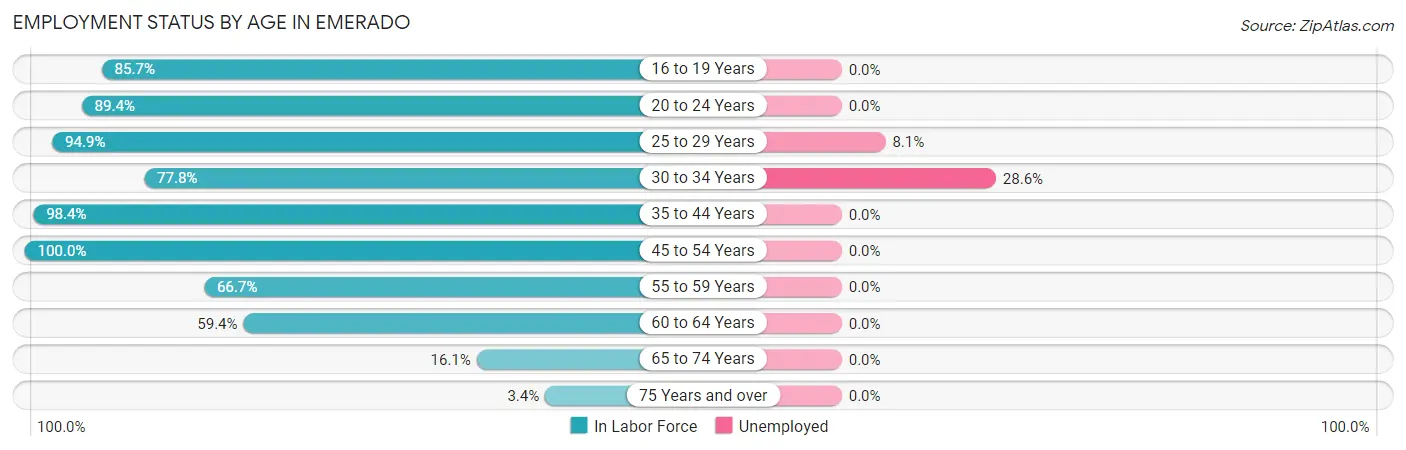
| Age Bracket | In Labor Force | Unemployed |
| 16 to 19 Years | 6 (85.7%) | 0 (0.0%) |
| 20 to 24 Years | 42 (89.4%) | 0 (0.0%) |
| 25 to 29 Years | 37 (94.9%) | 3 (8.1%) |
| 30 to 34 Years | 14 (77.8%) | 4 (28.6%) |
| 35 to 44 Years | 62 (98.4%) | 0 (0.0%) |
| 45 to 54 Years | 27 (100.0%) | 0 (0.0%) |
| 55 to 59 Years | 6 (66.7%) | 0 (0.0%) |
| 60 to 64 Years | 19 (59.4%) | 0 (0.0%) |
| 65 to 74 Years | 5 (16.1%) | 0 (0.0%) |
| 75 Years and over | 1 (3.4%) | 0 (0.0%) |
| Total | 219 (72.5%) | 7 (3.3%) |
Employment Status by Educational Attainment in Emerado
According to labor force statistics for Emerado, 87.8% of individuals (165) out of the total population between 25 and 64 years of age (188) are in the labor force, with 4.2% or 7 of them being unemployed. The group with the highest labor force participation rate are those with the educational attainment of high school diploma, with 92.6% or 50 individuals in the labor force. Within the labor force, individuals with college / associate degree education have the highest percentage of unemployment, with 7.1% or 5 of them being unemployed.
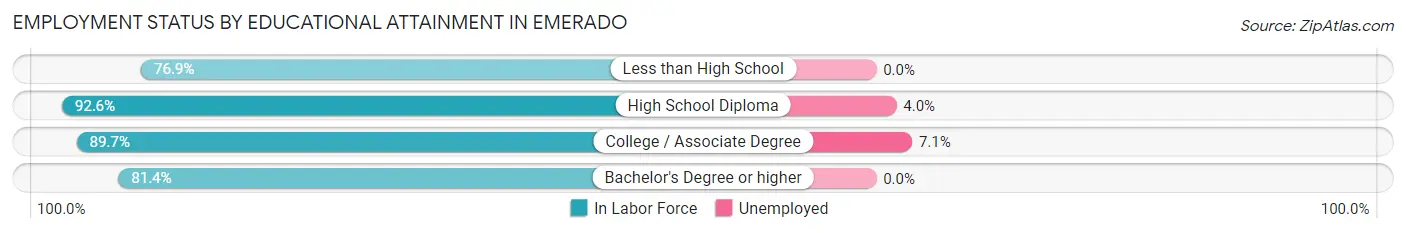
| Educational Attainment | In Labor Force | Unemployed |
| Less than High School | 10 (76.9%) | 0 (0.0%) |
| High School Diploma | 50 (92.6%) | 2 (4.0%) |
| College / Associate Degree | 70 (89.7%) | 6 (7.1%) |
| Bachelor's Degree or higher | 35 (81.4%) | 0 (0.0%) |
| Total | 165 (87.8%) | 8 (4.2%) |
Employment Occupations by Sex in Emerado
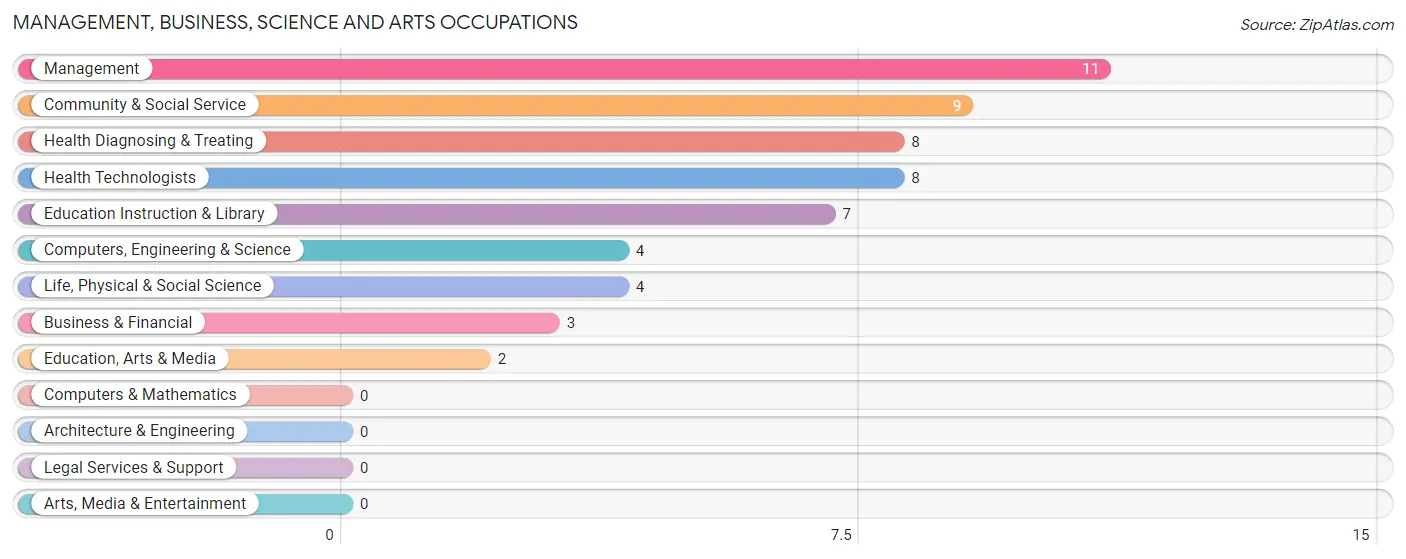
Management, Business, Science and Arts Occupations
The most common Management, Business, Science and Arts occupations in Emerado are Management (11 | 5.3%), Community & Social Service (9 | 4.3%), Health Diagnosing & Treating (8 | 3.8%), Health Technologists (8 | 3.8%), and Education Instruction & Library (7 | 3.4%).
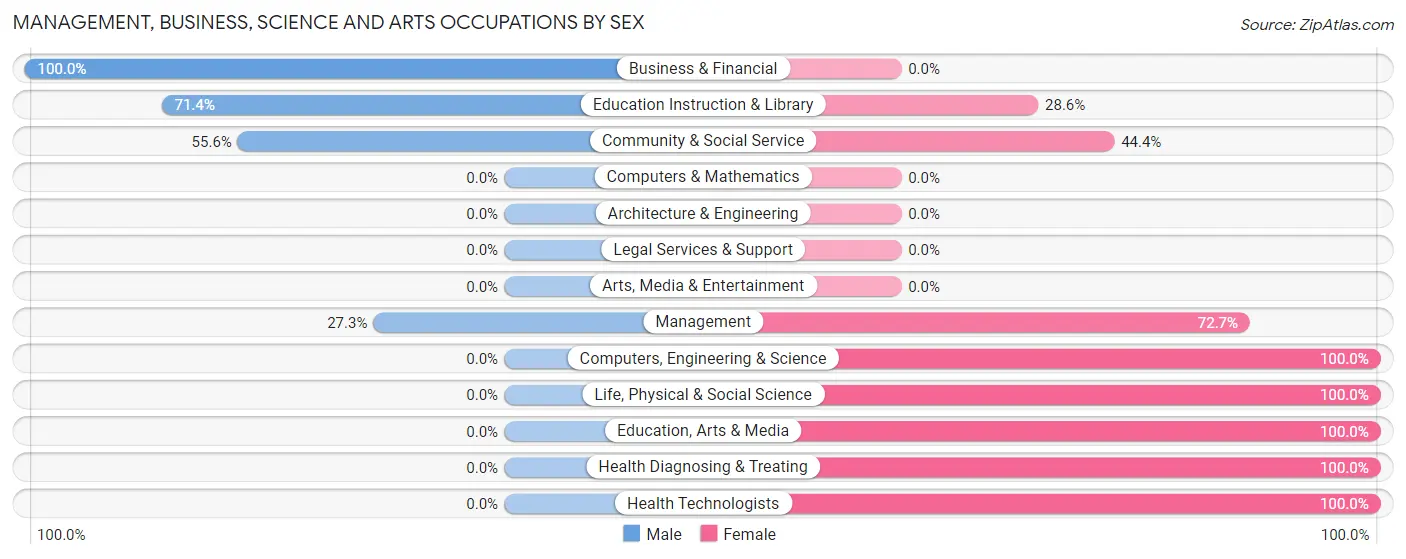
Management, Business, Science and Arts Occupations by Sex
Within the Management, Business, Science and Arts occupations in Emerado, the most male-oriented occupations are Business & Financial (100.0%), Education Instruction & Library (71.4%), and Community & Social Service (55.6%), while the most female-oriented occupations are Computers, Engineering & Science (100.0%), Life, Physical & Social Science (100.0%), and Education, Arts & Media (100.0%).
| Occupation | Male | Female |
| Management | 3 (27.3%) | 8 (72.7%) |
| Business & Financial | 3 (100.0%) | 0 (0.0%) |
| Computers, Engineering & Science | 0 (0.0%) | 4 (100.0%) |
| Computers & Mathematics | 0 (0.0%) | 0 (0.0%) |
| Architecture & Engineering | 0 (0.0%) | 0 (0.0%) |
| Life, Physical & Social Science | 0 (0.0%) | 4 (100.0%) |
| Community & Social Service | 5 (55.6%) | 4 (44.4%) |
| Education, Arts & Media | 0 (0.0%) | 2 (100.0%) |
| Legal Services & Support | 0 (0.0%) | 0 (0.0%) |
| Education Instruction & Library | 5 (71.4%) | 2 (28.6%) |
| Arts, Media & Entertainment | 0 (0.0%) | 0 (0.0%) |
| Health Diagnosing & Treating | 0 (0.0%) | 8 (100.0%) |
| Health Technologists | 0 (0.0%) | 8 (100.0%) |
| Total (Category) | 11 (31.4%) | 24 (68.6%) |
| Total (Overall) | 105 (50.5%) | 103 (49.5%) |
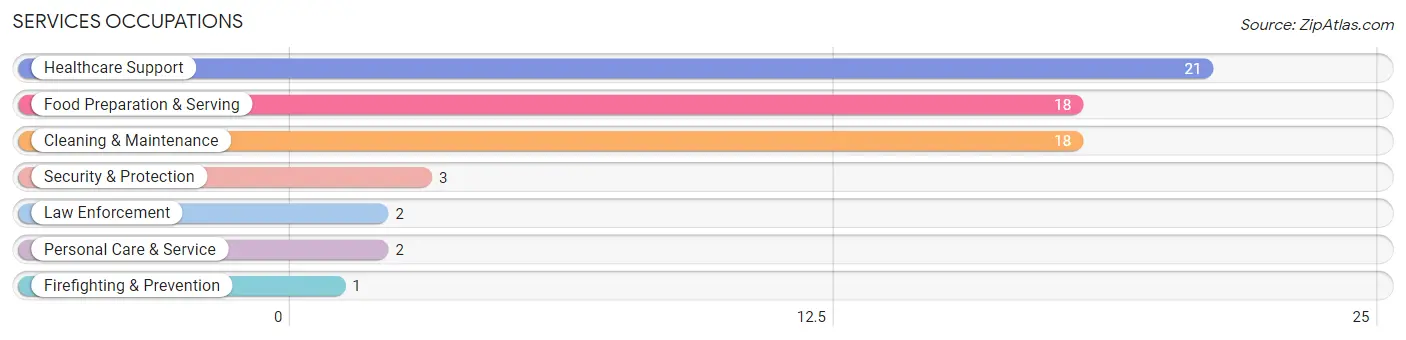
Services Occupations
The most common Services occupations in Emerado are Healthcare Support (21 | 10.1%), Food Preparation & Serving (18 | 8.6%), Cleaning & Maintenance (18 | 8.6%), Security & Protection (3 | 1.4%), and Law Enforcement (2 | 1.0%).
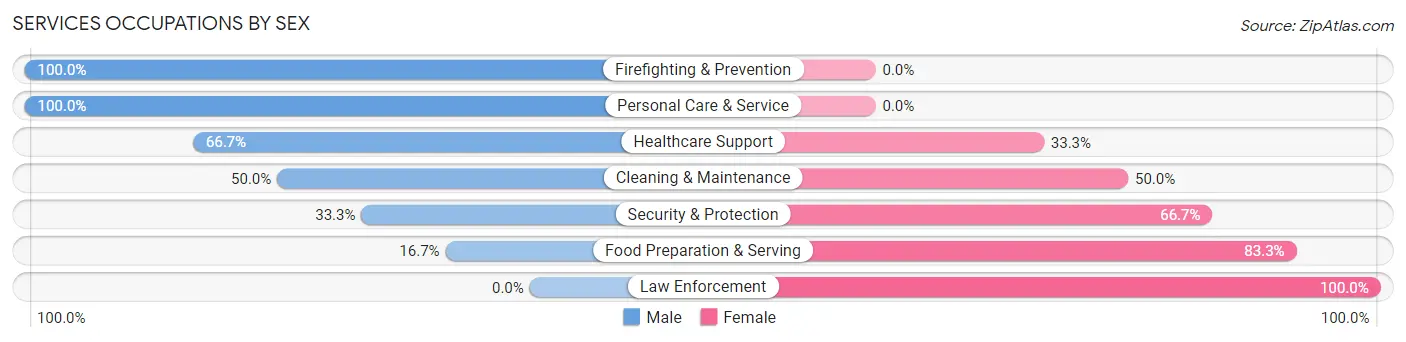
Services Occupations by Sex
Within the Services occupations in Emerado, the most male-oriented occupations are Firefighting & Prevention (100.0%), Personal Care & Service (100.0%), and Healthcare Support (66.7%), while the most female-oriented occupations are Law Enforcement (100.0%), Food Preparation & Serving (83.3%), and Security & Protection (66.7%).
| Occupation | Male | Female |
| Healthcare Support | 14 (66.7%) | 7 (33.3%) |
| Security & Protection | 1 (33.3%) | 2 (66.7%) |
| Firefighting & Prevention | 1 (100.0%) | 0 (0.0%) |
| Law Enforcement | 0 (0.0%) | 2 (100.0%) |
| Food Preparation & Serving | 3 (16.7%) | 15 (83.3%) |
| Cleaning & Maintenance | 9 (50.0%) | 9 (50.0%) |
| Personal Care & Service | 2 (100.0%) | 0 (0.0%) |
| Total (Category) | 29 (46.8%) | 33 (53.2%) |
| Total (Overall) | 105 (50.5%) | 103 (49.5%) |
Sales and Office Occupations
The most common Sales and Office occupations in Emerado are Sales & Related (28 | 13.5%), and Office & Administration (28 | 13.5%).

Sales and Office Occupations by Sex
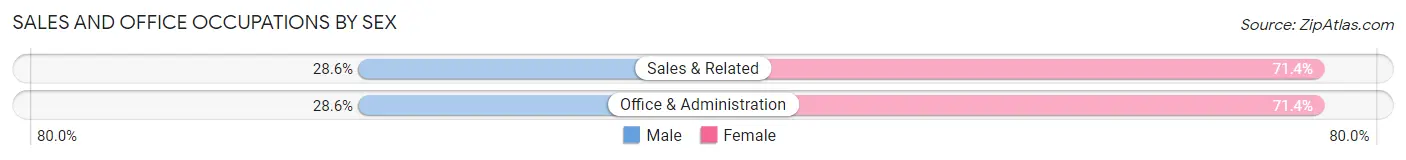
| Occupation | Male | Female |
| Sales & Related | 8 (28.6%) | 20 (71.4%) |
| Office & Administration | 8 (28.6%) | 20 (71.4%) |
| Total (Category) | 16 (28.6%) | 40 (71.4%) |
| Total (Overall) | 105 (50.5%) | 103 (49.5%) |
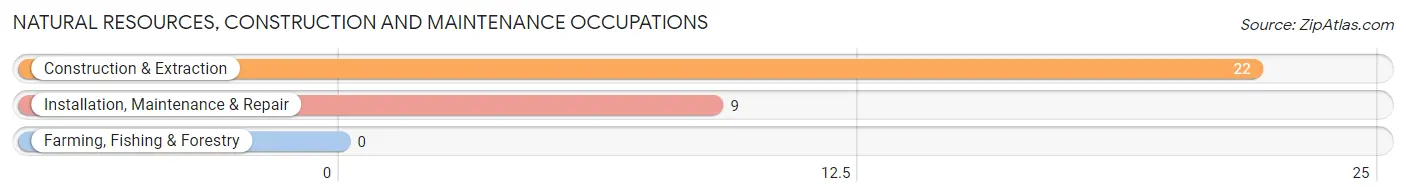
Natural Resources, Construction and Maintenance Occupations
The most common Natural Resources, Construction and Maintenance occupations in Emerado are Construction & Extraction (22 | 10.6%), and Installation, Maintenance & Repair (9 | 4.3%).
Natural Resources, Construction and Maintenance Occupations by Sex
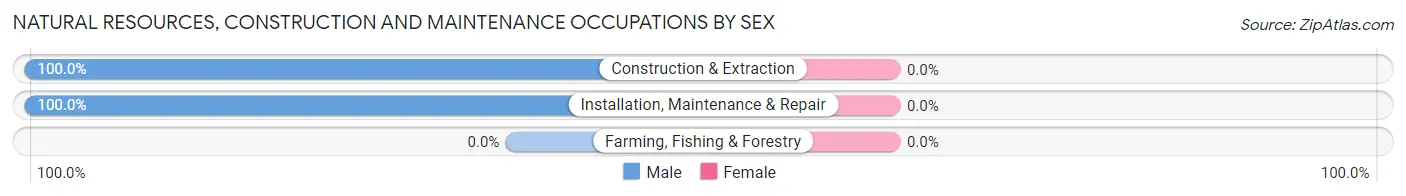
| Occupation | Male | Female |
| Farming, Fishing & Forestry | 0 (0.0%) | 0 (0.0%) |
| Construction & Extraction | 22 (100.0%) | 0 (0.0%) |
| Installation, Maintenance & Repair | 9 (100.0%) | 0 (0.0%) |
| Total (Category) | 31 (100.0%) | 0 (0.0%) |
| Total (Overall) | 105 (50.5%) | 103 (49.5%) |
Production, Transportation and Moving Occupations
The most common Production, Transportation and Moving occupations in Emerado are Production (14 | 6.7%), Transportation (8 | 3.8%), and Material Moving (2 | 1.0%).
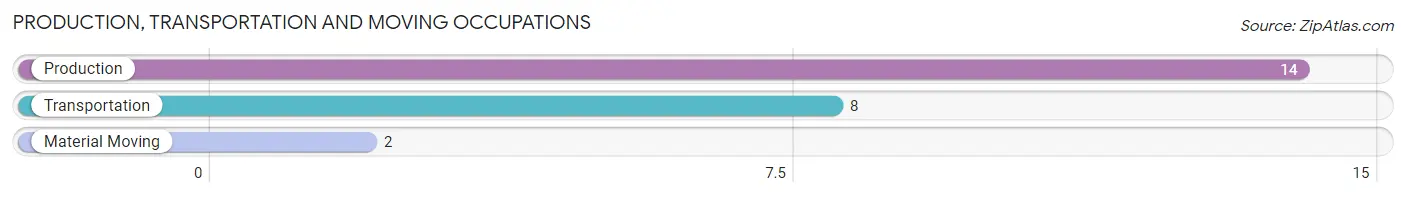
Production, Transportation and Moving Occupations by Sex
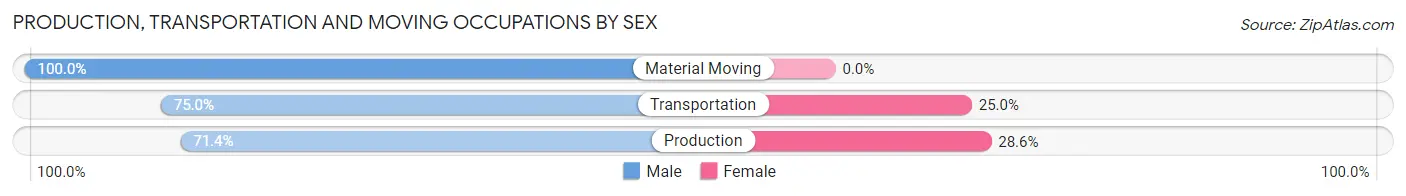
| Occupation | Male | Female |
| Production | 10 (71.4%) | 4 (28.6%) |
| Transportation | 6 (75.0%) | 2 (25.0%) |
| Material Moving | 2 (100.0%) | 0 (0.0%) |
| Total (Category) | 18 (75.0%) | 6 (25.0%) |
| Total (Overall) | 105 (50.5%) | 103 (49.5%) |
Employment Industries by Sex in Emerado
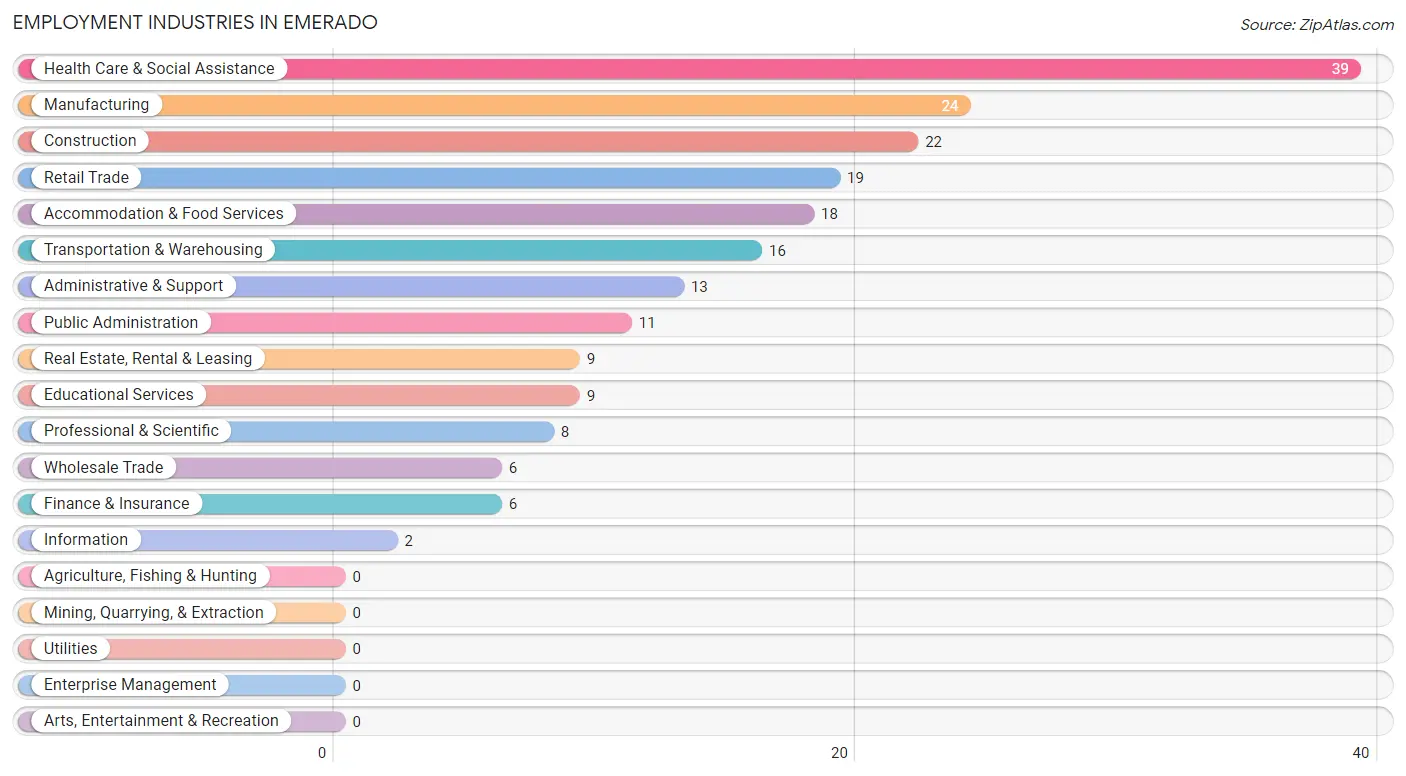
Employment Industries in Emerado
The major employment industries in Emerado include Health Care & Social Assistance (39 | 18.8%), Manufacturing (24 | 11.5%), Construction (22 | 10.6%), Retail Trade (19 | 9.1%), and Accommodation & Food Services (18 | 8.6%).
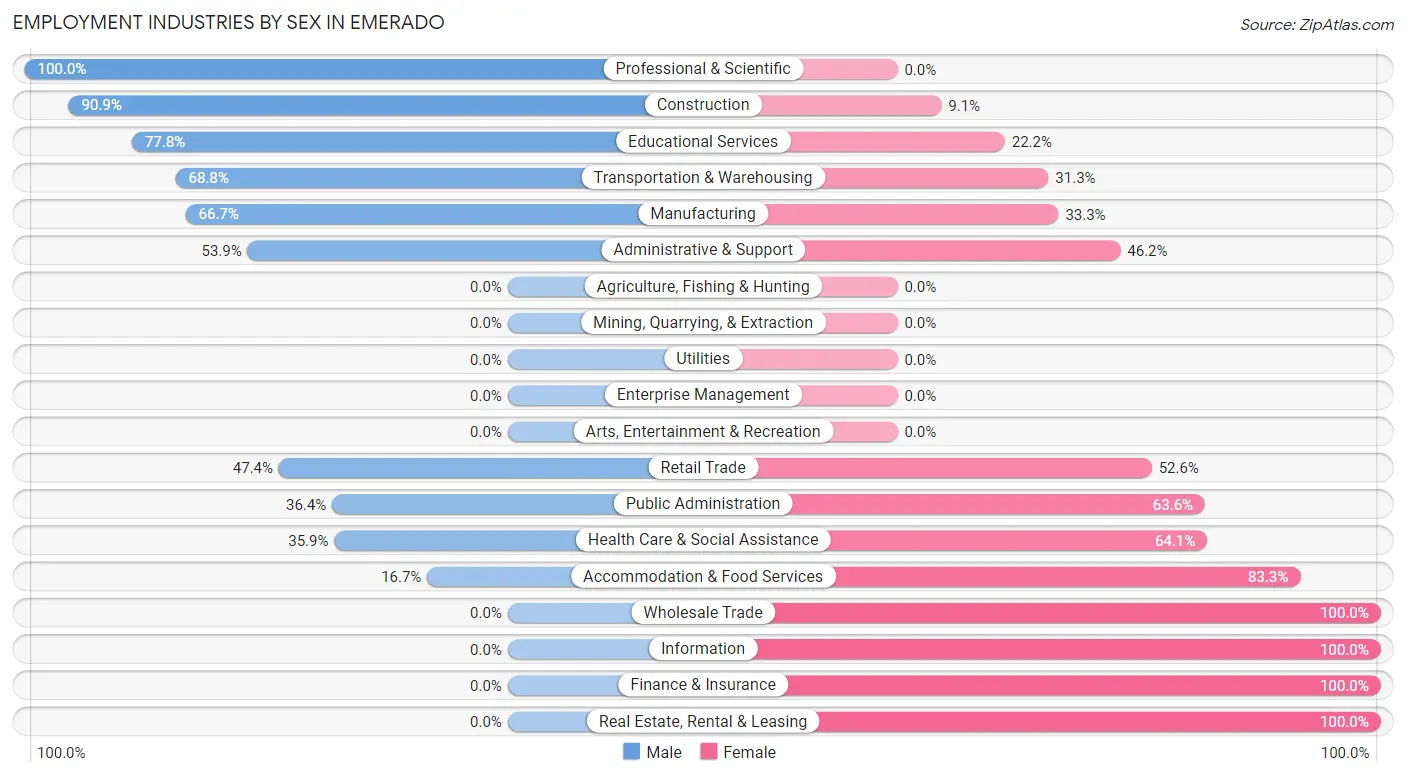
Employment Industries by Sex in Emerado
The Emerado industries that see more men than women are Professional & Scientific (100.0%), Construction (90.9%), and Educational Services (77.8%), whereas the industries that tend to have a higher number of women are Wholesale Trade (100.0%), Information (100.0%), and Finance & Insurance (100.0%).
| Industry | Male | Female |
| Agriculture, Fishing & Hunting | 0 (0.0%) | 0 (0.0%) |
| Mining, Quarrying, & Extraction | 0 (0.0%) | 0 (0.0%) |
| Construction | 20 (90.9%) | 2 (9.1%) |
| Manufacturing | 16 (66.7%) | 8 (33.3%) |
| Wholesale Trade | 0 (0.0%) | 6 (100.0%) |
| Retail Trade | 9 (47.4%) | 10 (52.6%) |
| Transportation & Warehousing | 11 (68.8%) | 5 (31.2%) |
| Utilities | 0 (0.0%) | 0 (0.0%) |
| Information | 0 (0.0%) | 2 (100.0%) |
| Finance & Insurance | 0 (0.0%) | 6 (100.0%) |
| Real Estate, Rental & Leasing | 0 (0.0%) | 9 (100.0%) |
| Professional & Scientific | 8 (100.0%) | 0 (0.0%) |
| Enterprise Management | 0 (0.0%) | 0 (0.0%) |
| Administrative & Support | 7 (53.8%) | 6 (46.2%) |
| Educational Services | 7 (77.8%) | 2 (22.2%) |
| Health Care & Social Assistance | 14 (35.9%) | 25 (64.1%) |
| Arts, Entertainment & Recreation | 0 (0.0%) | 0 (0.0%) |
| Accommodation & Food Services | 3 (16.7%) | 15 (83.3%) |
| Public Administration | 4 (36.4%) | 7 (63.6%) |
| Total | 105 (50.5%) | 103 (49.5%) |
Education in Emerado
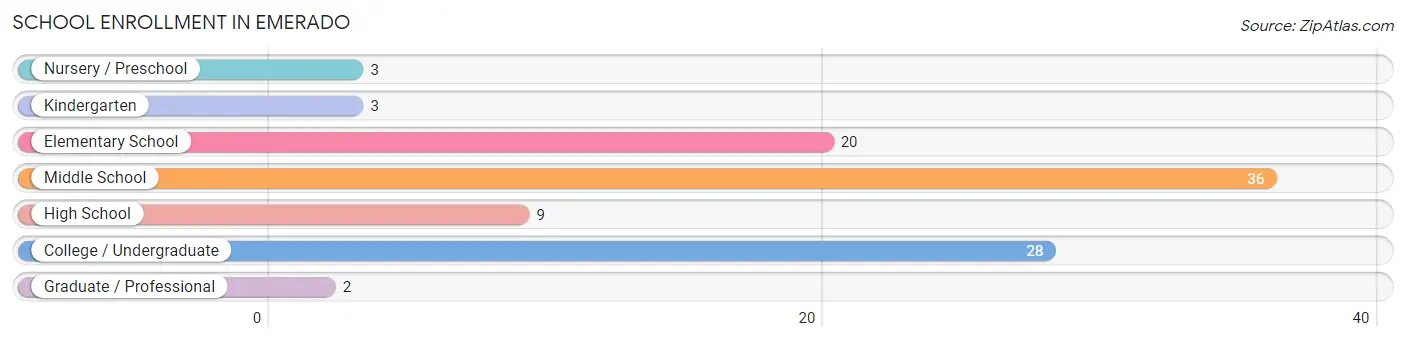
School Enrollment in Emerado
The most common levels of schooling among the 101 students in Emerado are middle school (36 | 35.6%), college / undergraduate (28 | 27.7%), and elementary school (20 | 19.8%).
| School Level | # Students | % Students |
| Nursery / Preschool | 3 | 3.0% |
| Kindergarten | 3 | 3.0% |
| Elementary School | 20 | 19.8% |
| Middle School | 36 | 35.6% |
| High School | 9 | 8.9% |
| College / Undergraduate | 28 | 27.7% |
| Graduate / Professional | 2 | 2.0% |
| Total | 101 | 100.0% |
School Enrollment by Age by Funding Source in Emerado
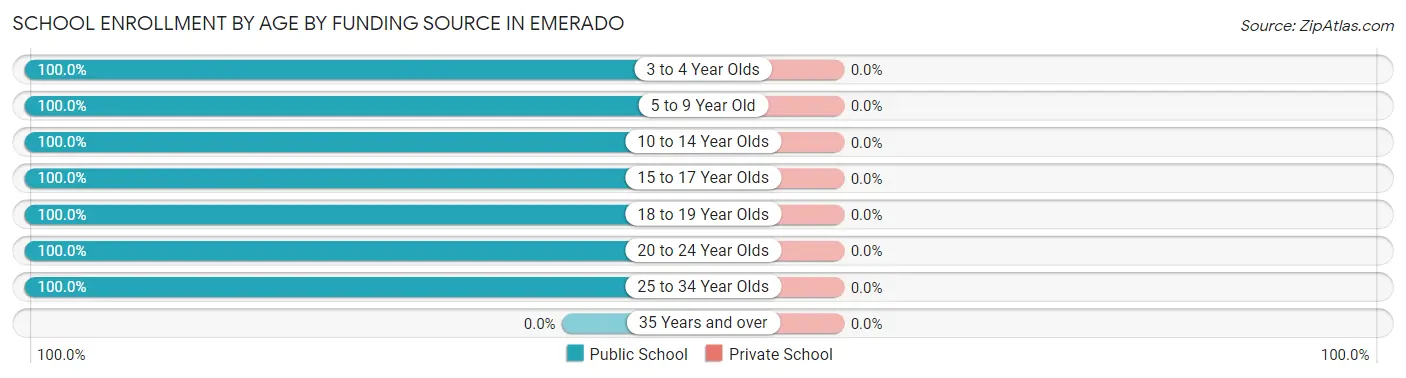
| Age Bracket | Public School | Private School |
| 3 to 4 Year Olds | 3 (100.0%) | 0 (0.0%) |
| 5 to 9 Year Old | 16 (100.0%) | 0 (0.0%) |
| 10 to 14 Year Olds | 43 (100.0%) | 0 (0.0%) |
| 15 to 17 Year Olds | 9 (100.0%) | 0 (0.0%) |
| 18 to 19 Year Olds | 2 (100.0%) | 0 (0.0%) |
| 20 to 24 Year Olds | 26 (100.0%) | 0 (0.0%) |
| 25 to 34 Year Olds | 2 (100.0%) | 0 (0.0%) |
| 35 Years and over | 0 (0.0%) | 0 (0.0%) |
| Total | 101 (100.0%) | 0 (0.0%) |
Educational Attainment by Field of Study in Emerado
Arts & humanities (24 | 40.0%), business (13 | 21.7%), social sciences (6 | 10.0%), bio, nature & agricultural (5 | 8.3%), and psychology (4 | 6.7%) are the most common fields of study among 60 individuals in Emerado who have obtained a bachelor's degree or higher.
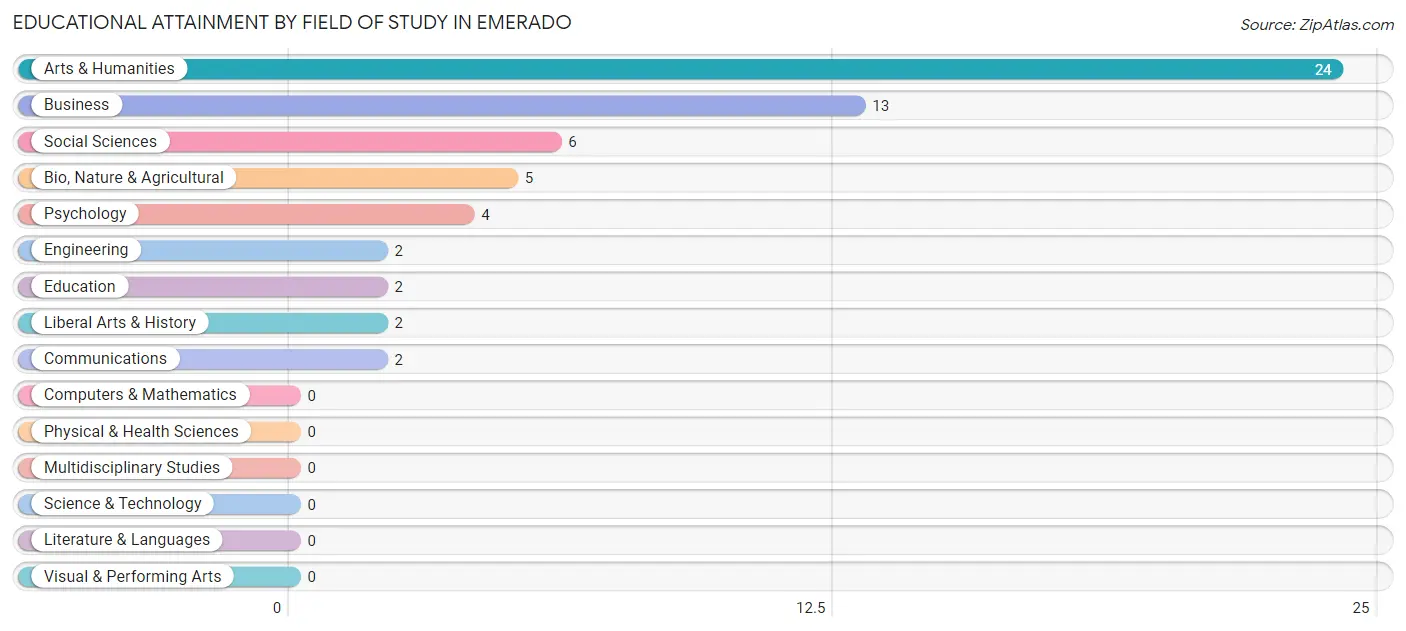
| Field of Study | # Graduates | % Graduates |
| Computers & Mathematics | 0 | 0.0% |
| Bio, Nature & Agricultural | 5 | 8.3% |
| Physical & Health Sciences | 0 | 0.0% |
| Psychology | 4 | 6.7% |
| Social Sciences | 6 | 10.0% |
| Engineering | 2 | 3.3% |
| Multidisciplinary Studies | 0 | 0.0% |
| Science & Technology | 0 | 0.0% |
| Business | 13 | 21.7% |
| Education | 2 | 3.3% |
| Literature & Languages | 0 | 0.0% |
| Liberal Arts & History | 2 | 3.3% |
| Visual & Performing Arts | 0 | 0.0% |
| Communications | 2 | 3.3% |
| Arts & Humanities | 24 | 40.0% |
| Total | 60 | 100.0% |
Transportation & Commute in Emerado
Vehicle Availability by Sex in Emerado
The most prevalent vehicle ownership categories in Emerado are males with 2 vehicles (47, accounting for 43.1%) and females with 2 vehicles (44, making up 45.6%).
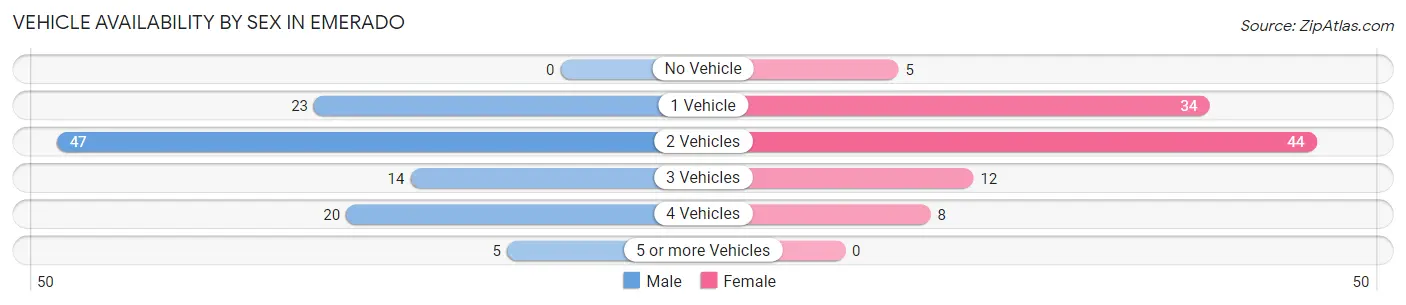
| Vehicles Available | Male | Female |
| No Vehicle | 0 (0.0%) | 5 (4.9%) |
| 1 Vehicle | 23 (21.1%) | 34 (33.0%) |
| 2 Vehicles | 47 (43.1%) | 44 (42.7%) |
| 3 Vehicles | 14 (12.8%) | 12 (11.7%) |
| 4 Vehicles | 20 (18.3%) | 8 (7.8%) |
| 5 or more Vehicles | 5 (4.6%) | 0 (0.0%) |
| Total | 109 (100.0%) | 103 (100.0%) |
Commute Time in Emerado
The most frequently occuring commute durations in Emerado are 15 to 19 minutes (42 commuters, 20.6%), 5 to 9 minutes (40 commuters, 19.6%), and 20 to 24 minutes (34 commuters, 16.7%).
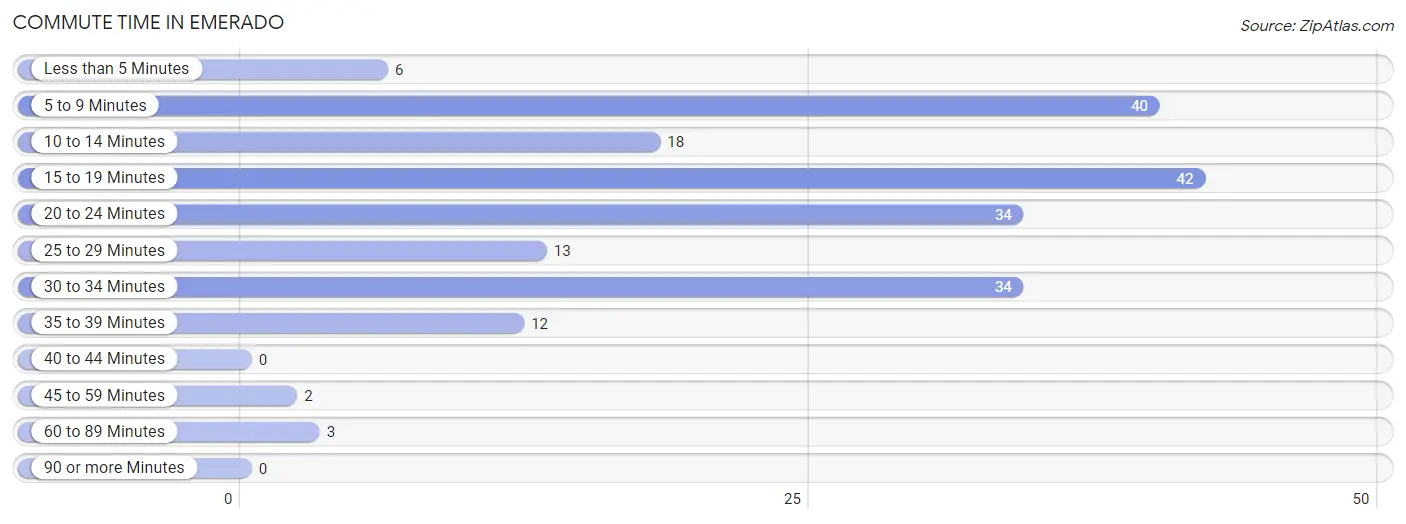
| Commute Time | # Commuters | % Commuters |
| Less than 5 Minutes | 6 | 2.9% |
| 5 to 9 Minutes | 40 | 19.6% |
| 10 to 14 Minutes | 18 | 8.8% |
| 15 to 19 Minutes | 42 | 20.6% |
| 20 to 24 Minutes | 34 | 16.7% |
| 25 to 29 Minutes | 13 | 6.4% |
| 30 to 34 Minutes | 34 | 16.7% |
| 35 to 39 Minutes | 12 | 5.9% |
| 40 to 44 Minutes | 0 | 0.0% |
| 45 to 59 Minutes | 2 | 1.0% |
| 60 to 89 Minutes | 3 | 1.5% |
| 90 or more Minutes | 0 | 0.0% |
Commute Time by Sex in Emerado
The most common commute times in Emerado are 15 to 19 minutes (31 commuters, 30.1%) for males and 30 to 34 minutes (31 commuters, 30.7%) for females.
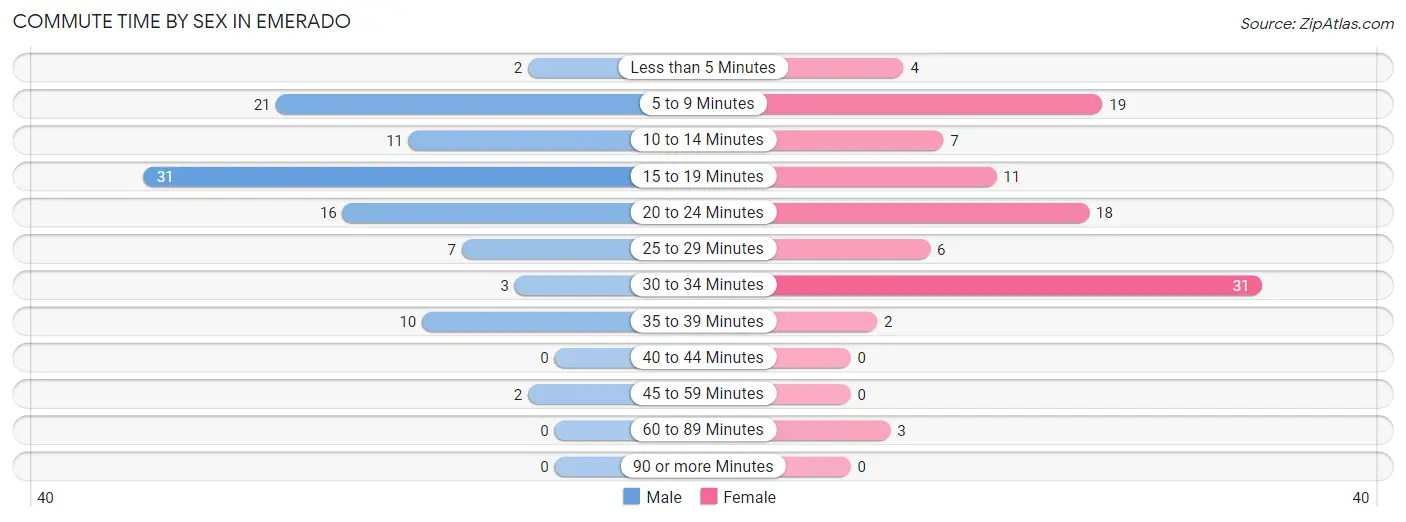
| Commute Time | Male | Female |
| Less than 5 Minutes | 2 (1.9%) | 4 (4.0%) |
| 5 to 9 Minutes | 21 (20.4%) | 19 (18.8%) |
| 10 to 14 Minutes | 11 (10.7%) | 7 (6.9%) |
| 15 to 19 Minutes | 31 (30.1%) | 11 (10.9%) |
| 20 to 24 Minutes | 16 (15.5%) | 18 (17.8%) |
| 25 to 29 Minutes | 7 (6.8%) | 6 (5.9%) |
| 30 to 34 Minutes | 3 (2.9%) | 31 (30.7%) |
| 35 to 39 Minutes | 10 (9.7%) | 2 (2.0%) |
| 40 to 44 Minutes | 0 (0.0%) | 0 (0.0%) |
| 45 to 59 Minutes | 2 (1.9%) | 0 (0.0%) |
| 60 to 89 Minutes | 0 (0.0%) | 3 (3.0%) |
| 90 or more Minutes | 0 (0.0%) | 0 (0.0%) |
Time of Departure to Work by Sex in Emerado
The most frequent times of departure to work in Emerado are 6:30 AM to 6:59 AM (29, 28.2%) for males and 7:00 AM to 7:29 AM (23, 22.8%) for females.
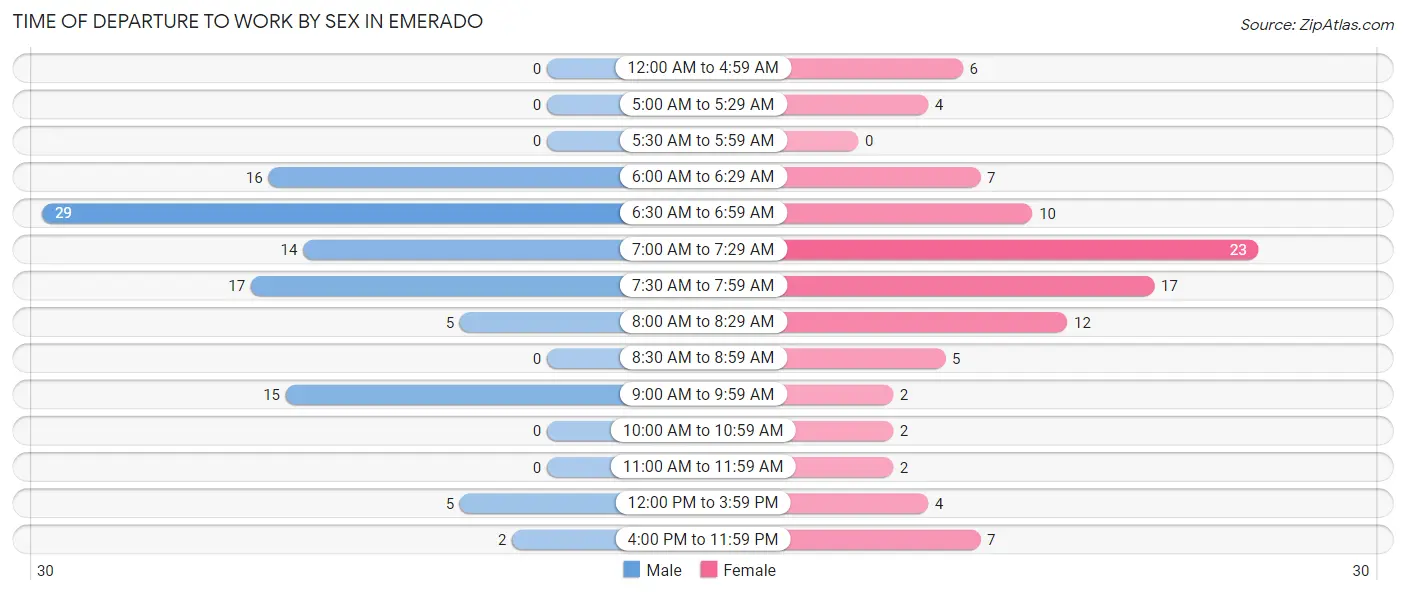
| Time of Departure | Male | Female |
| 12:00 AM to 4:59 AM | 0 (0.0%) | 6 (5.9%) |
| 5:00 AM to 5:29 AM | 0 (0.0%) | 4 (4.0%) |
| 5:30 AM to 5:59 AM | 0 (0.0%) | 0 (0.0%) |
| 6:00 AM to 6:29 AM | 16 (15.5%) | 7 (6.9%) |
| 6:30 AM to 6:59 AM | 29 (28.2%) | 10 (9.9%) |
| 7:00 AM to 7:29 AM | 14 (13.6%) | 23 (22.8%) |
| 7:30 AM to 7:59 AM | 17 (16.5%) | 17 (16.8%) |
| 8:00 AM to 8:29 AM | 5 (4.9%) | 12 (11.9%) |
| 8:30 AM to 8:59 AM | 0 (0.0%) | 5 (5.0%) |
| 9:00 AM to 9:59 AM | 15 (14.6%) | 2 (2.0%) |
| 10:00 AM to 10:59 AM | 0 (0.0%) | 2 (2.0%) |
| 11:00 AM to 11:59 AM | 0 (0.0%) | 2 (2.0%) |
| 12:00 PM to 3:59 PM | 5 (4.9%) | 4 (4.0%) |
| 4:00 PM to 11:59 PM | 2 (1.9%) | 7 (6.9%) |
| Total | 103 (100.0%) | 101 (100.0%) |
Housing Occupancy in Emerado
Occupancy by Ownership in Emerado
Of the total 193 dwellings in Emerado, owner-occupied units account for 110 (57.0%), while renter-occupied units make up 83 (43.0%).
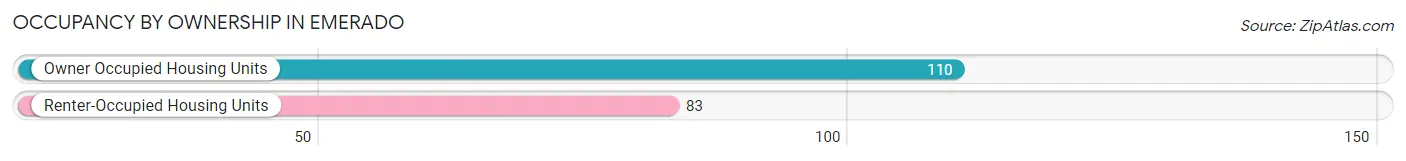
| Occupancy | # Housing Units | % Housing Units |
| Owner Occupied Housing Units | 110 | 57.0% |
| Renter-Occupied Housing Units | 83 | 43.0% |
| Total Occupied Housing Units | 193 | 100.0% |
Occupancy by Household Size in Emerado
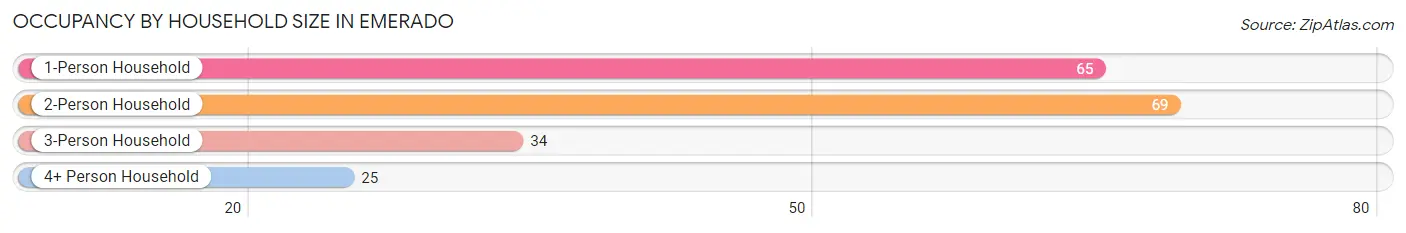
| Household Size | # Housing Units | % Housing Units |
| 1-Person Household | 65 | 33.7% |
| 2-Person Household | 69 | 35.7% |
| 3-Person Household | 34 | 17.6% |
| 4+ Person Household | 25 | 13.0% |
| Total Housing Units | 193 | 100.0% |
Occupancy by Ownership by Household Size in Emerado
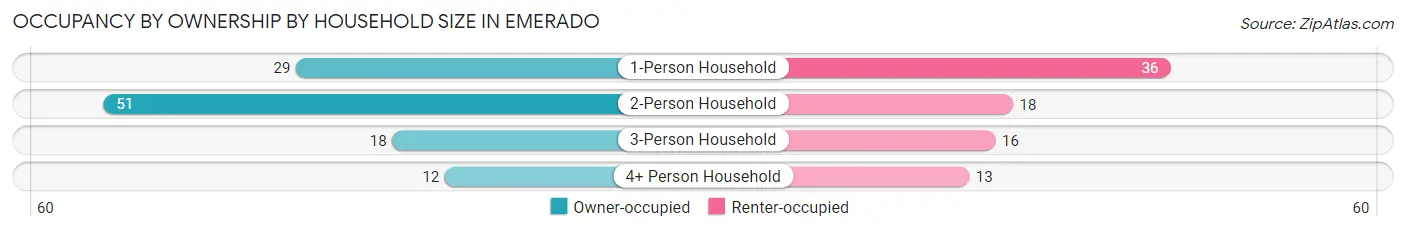
| Household Size | Owner-occupied | Renter-occupied |
| 1-Person Household | 29 (44.6%) | 36 (55.4%) |
| 2-Person Household | 51 (73.9%) | 18 (26.1%) |
| 3-Person Household | 18 (52.9%) | 16 (47.1%) |
| 4+ Person Household | 12 (48.0%) | 13 (52.0%) |
| Total Housing Units | 110 (57.0%) | 83 (43.0%) |
Occupancy by Educational Attainment in Emerado
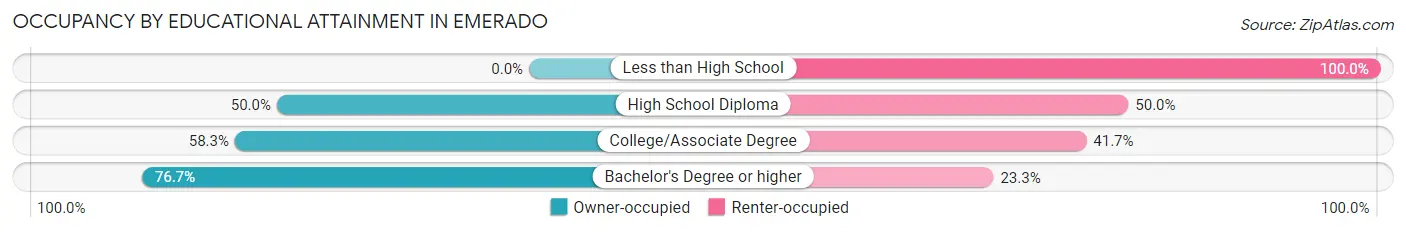
| Household Size | Owner-occupied | Renter-occupied |
| Less than High School | 0 (0.0%) | 10 (100.0%) |
| High School Diploma | 28 (50.0%) | 28 (50.0%) |
| College/Associate Degree | 49 (58.3%) | 35 (41.7%) |
| Bachelor's Degree or higher | 33 (76.7%) | 10 (23.3%) |
Occupancy by Age of Householder in Emerado
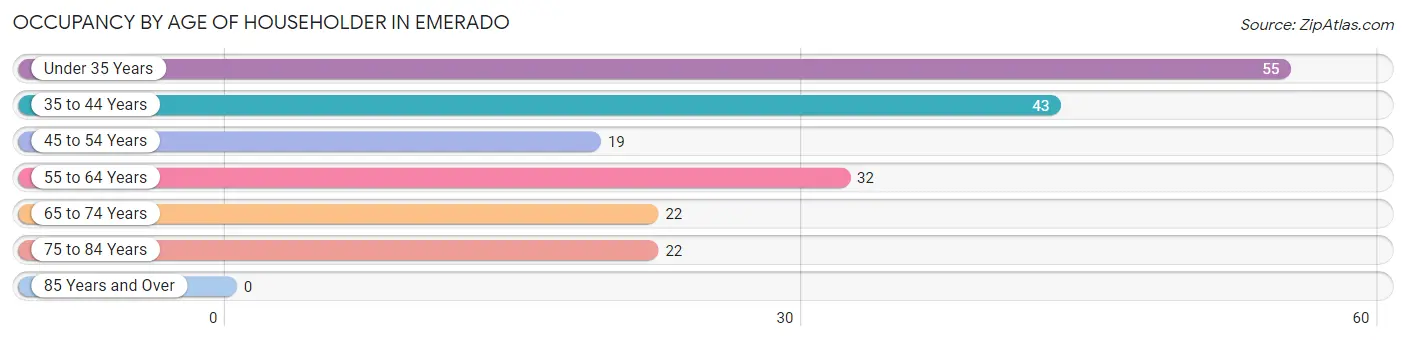
| Age Bracket | # Households | % Households |
| Under 35 Years | 55 | 28.5% |
| 35 to 44 Years | 43 | 22.3% |
| 45 to 54 Years | 19 | 9.8% |
| 55 to 64 Years | 32 | 16.6% |
| 65 to 74 Years | 22 | 11.4% |
| 75 to 84 Years | 22 | 11.4% |
| 85 Years and Over | 0 | 0.0% |
| Total | 193 | 100.0% |
Housing Finances in Emerado
Median Income by Occupancy in Emerado
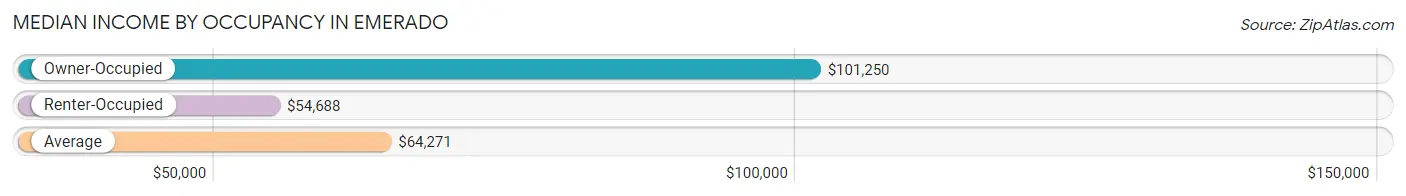
| Occupancy Type | # Households | Median Income |
| Owner-Occupied | 110 (57.0%) | $101,250 |
| Renter-Occupied | 83 (43.0%) | $54,688 |
| Average | 193 (100.0%) | $64,271 |
Occupancy by Householder Income Bracket in Emerado
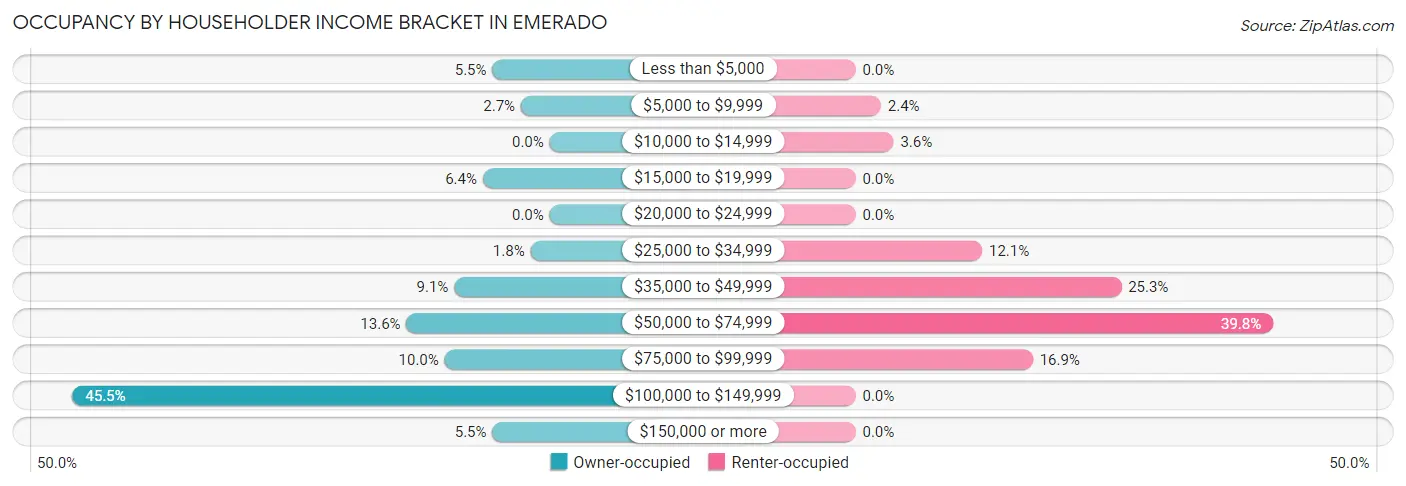
| Income Bracket | Owner-occupied | Renter-occupied |
| Less than $5,000 | 6 (5.4%) | 0 (0.0%) |
| $5,000 to $9,999 | 3 (2.7%) | 2 (2.4%) |
| $10,000 to $14,999 | 0 (0.0%) | 3 (3.6%) |
| $15,000 to $19,999 | 7 (6.4%) | 0 (0.0%) |
| $20,000 to $24,999 | 0 (0.0%) | 0 (0.0%) |
| $25,000 to $34,999 | 2 (1.8%) | 10 (12.0%) |
| $35,000 to $49,999 | 10 (9.1%) | 21 (25.3%) |
| $50,000 to $74,999 | 15 (13.6%) | 33 (39.8%) |
| $75,000 to $99,999 | 11 (10.0%) | 14 (16.9%) |
| $100,000 to $149,999 | 50 (45.5%) | 0 (0.0%) |
| $150,000 or more | 6 (5.4%) | 0 (0.0%) |
| Total | 110 (100.0%) | 83 (100.0%) |
Monthly Housing Cost Tiers in Emerado
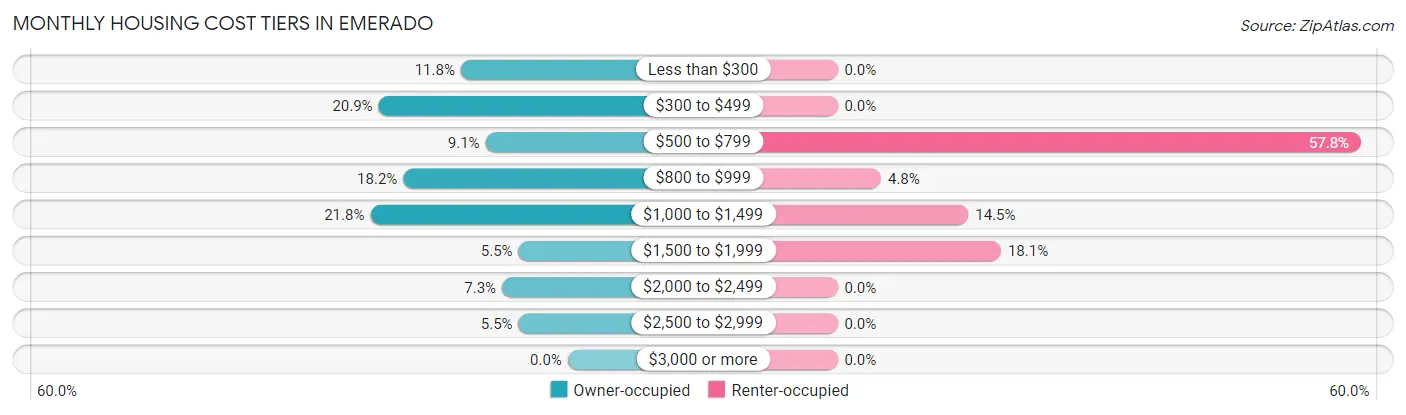
| Monthly Cost | Owner-occupied | Renter-occupied |
| Less than $300 | 13 (11.8%) | 0 (0.0%) |
| $300 to $499 | 23 (20.9%) | 0 (0.0%) |
| $500 to $799 | 10 (9.1%) | 48 (57.8%) |
| $800 to $999 | 20 (18.2%) | 4 (4.8%) |
| $1,000 to $1,499 | 24 (21.8%) | 12 (14.5%) |
| $1,500 to $1,999 | 6 (5.4%) | 15 (18.1%) |
| $2,000 to $2,499 | 8 (7.3%) | 0 (0.0%) |
| $2,500 to $2,999 | 6 (5.4%) | 0 (0.0%) |
| $3,000 or more | 0 (0.0%) | 0 (0.0%) |
| Total | 110 (100.0%) | 83 (100.0%) |
Physical Housing Characteristics in Emerado
Housing Structures in Emerado
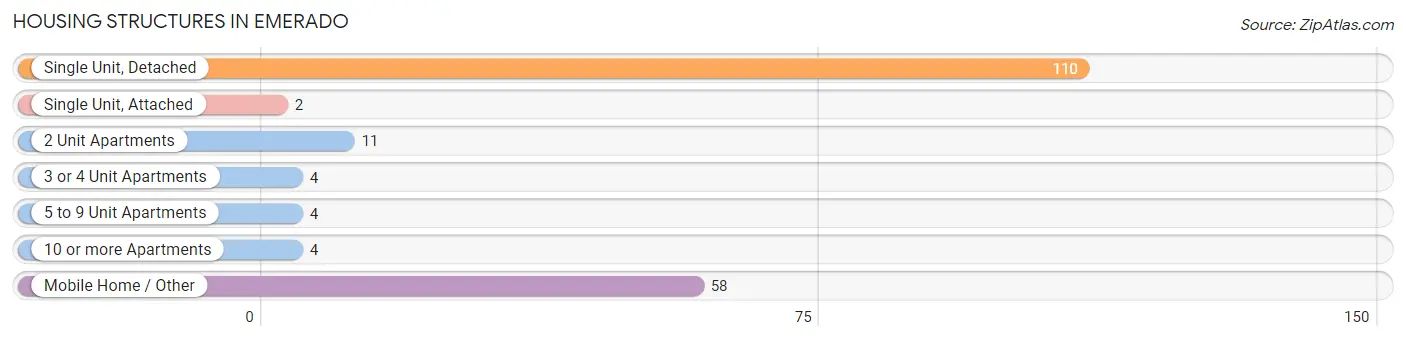
| Structure Type | # Housing Units | % Housing Units |
| Single Unit, Detached | 110 | 57.0% |
| Single Unit, Attached | 2 | 1.0% |
| 2 Unit Apartments | 11 | 5.7% |
| 3 or 4 Unit Apartments | 4 | 2.1% |
| 5 to 9 Unit Apartments | 4 | 2.1% |
| 10 or more Apartments | 4 | 2.1% |
| Mobile Home / Other | 58 | 30.0% |
| Total | 193 | 100.0% |
Housing Structures by Occupancy in Emerado
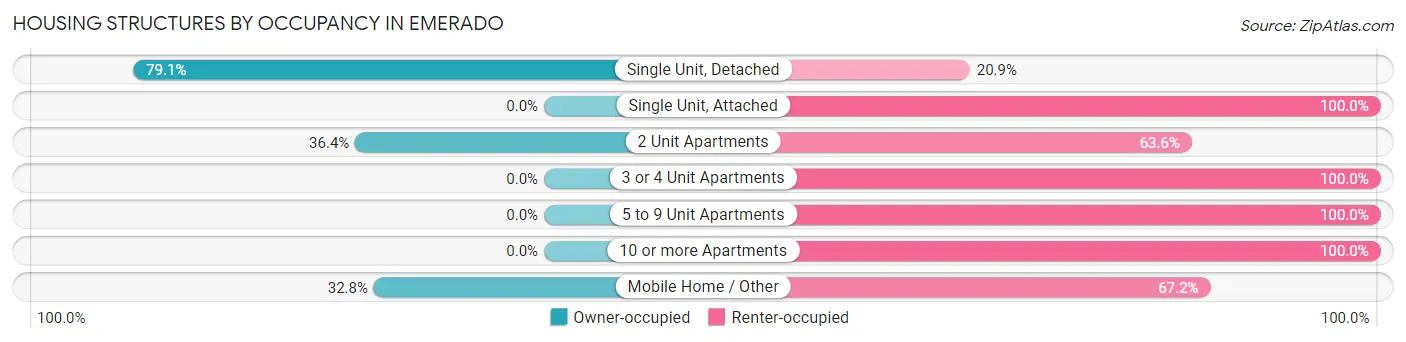
| Structure Type | Owner-occupied | Renter-occupied |
| Single Unit, Detached | 87 (79.1%) | 23 (20.9%) |
| Single Unit, Attached | 0 (0.0%) | 2 (100.0%) |
| 2 Unit Apartments | 4 (36.4%) | 7 (63.6%) |
| 3 or 4 Unit Apartments | 0 (0.0%) | 4 (100.0%) |
| 5 to 9 Unit Apartments | 0 (0.0%) | 4 (100.0%) |
| 10 or more Apartments | 0 (0.0%) | 4 (100.0%) |
| Mobile Home / Other | 19 (32.8%) | 39 (67.2%) |
| Total | 110 (57.0%) | 83 (43.0%) |
Housing Structures by Number of Rooms in Emerado
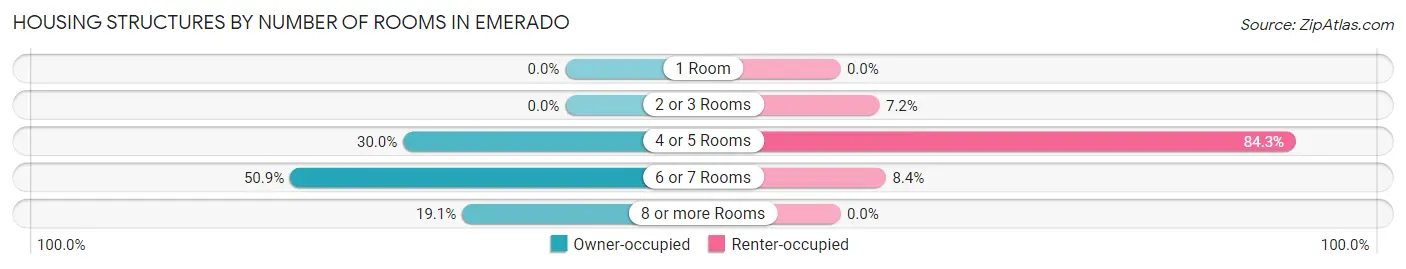
| Number of Rooms | Owner-occupied | Renter-occupied |
| 1 Room | 0 (0.0%) | 0 (0.0%) |
| 2 or 3 Rooms | 0 (0.0%) | 6 (7.2%) |
| 4 or 5 Rooms | 33 (30.0%) | 70 (84.3%) |
| 6 or 7 Rooms | 56 (50.9%) | 7 (8.4%) |
| 8 or more Rooms | 21 (19.1%) | 0 (0.0%) |
| Total | 110 (100.0%) | 83 (100.0%) |
Housing Structure by Heating Type in Emerado
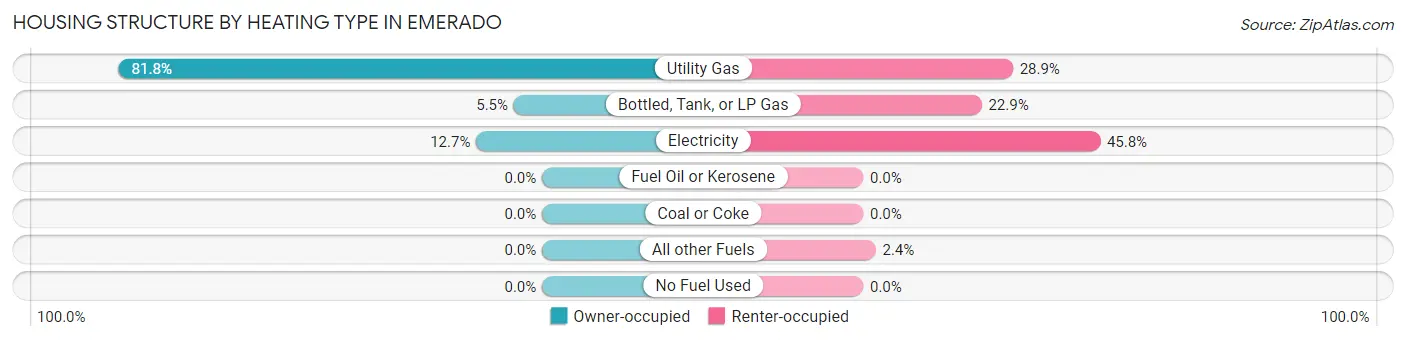
| Heating Type | Owner-occupied | Renter-occupied |
| Utility Gas | 90 (81.8%) | 24 (28.9%) |
| Bottled, Tank, or LP Gas | 6 (5.4%) | 19 (22.9%) |
| Electricity | 14 (12.7%) | 38 (45.8%) |
| Fuel Oil or Kerosene | 0 (0.0%) | 0 (0.0%) |
| Coal or Coke | 0 (0.0%) | 0 (0.0%) |
| All other Fuels | 0 (0.0%) | 2 (2.4%) |
| No Fuel Used | 0 (0.0%) | 0 (0.0%) |
| Total | 110 (100.0%) | 83 (100.0%) |
Household Vehicle Usage in Emerado
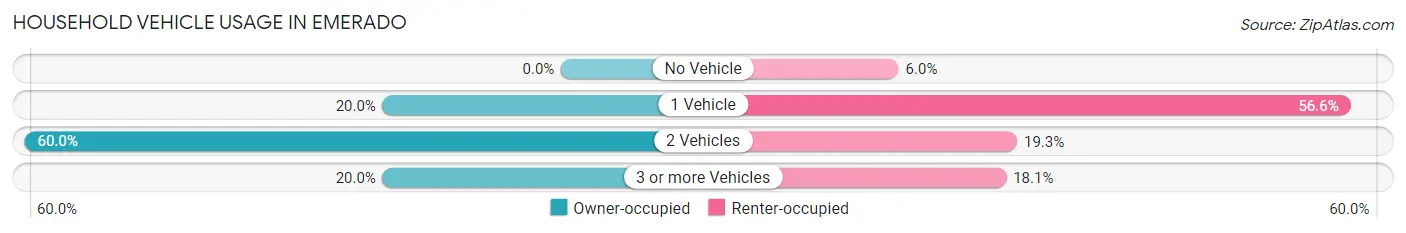
| Vehicles per Household | Owner-occupied | Renter-occupied |
| No Vehicle | 0 (0.0%) | 5 (6.0%) |
| 1 Vehicle | 22 (20.0%) | 47 (56.6%) |
| 2 Vehicles | 66 (60.0%) | 16 (19.3%) |
| 3 or more Vehicles | 22 (20.0%) | 15 (18.1%) |
| Total | 110 (100.0%) | 83 (100.0%) |
Real Estate & Mortgages in Emerado
Real Estate and Mortgage Overview in Emerado
| Characteristic | Without Mortgage | With Mortgage |
| Housing Units | 46 | 64 |
| Median Property Value | $187,500 | $135,700 |
| Median Household Income | $101,250 | $6 |
| Monthly Housing Costs | $443 | $0 |
| Real Estate Taxes | $1,264 | $3 |
Property Value by Mortgage Status in Emerado
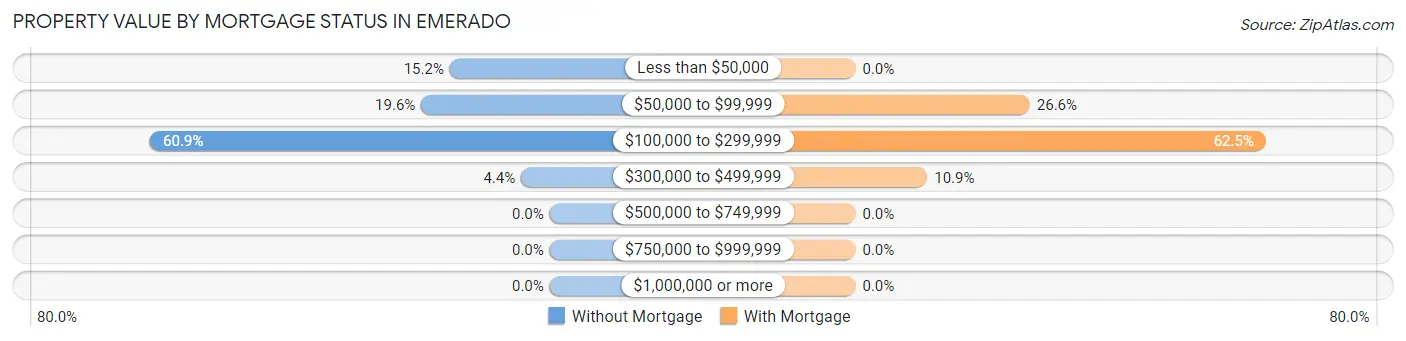
| Property Value | Without Mortgage | With Mortgage |
| Less than $50,000 | 7 (15.2%) | 0 (0.0%) |
| $50,000 to $99,999 | 9 (19.6%) | 17 (26.6%) |
| $100,000 to $299,999 | 28 (60.9%) | 40 (62.5%) |
| $300,000 to $499,999 | 2 (4.3%) | 7 (10.9%) |
| $500,000 to $749,999 | 0 (0.0%) | 0 (0.0%) |
| $750,000 to $999,999 | 0 (0.0%) | 0 (0.0%) |
| $1,000,000 or more | 0 (0.0%) | 0 (0.0%) |
| Total | 46 (100.0%) | 64 (100.0%) |
Household Income by Mortgage Status in Emerado
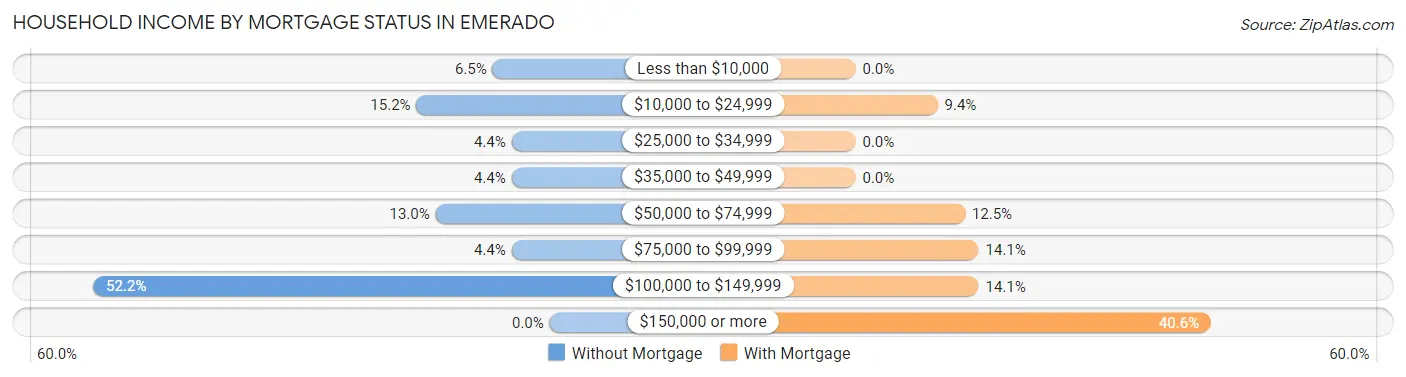
| Household Income | Without Mortgage | With Mortgage |
| Less than $10,000 | 3 (6.5%) | 0 (0.0%) |
| $10,000 to $24,999 | 7 (15.2%) | 6 (9.4%) |
| $25,000 to $34,999 | 2 (4.3%) | 0 (0.0%) |
| $35,000 to $49,999 | 2 (4.3%) | 0 (0.0%) |
| $50,000 to $74,999 | 6 (13.0%) | 8 (12.5%) |
| $75,000 to $99,999 | 2 (4.3%) | 9 (14.1%) |
| $100,000 to $149,999 | 24 (52.2%) | 9 (14.1%) |
| $150,000 or more | 0 (0.0%) | 26 (40.6%) |
| Total | 46 (100.0%) | 64 (100.0%) |
Property Value to Household Income Ratio in Emerado
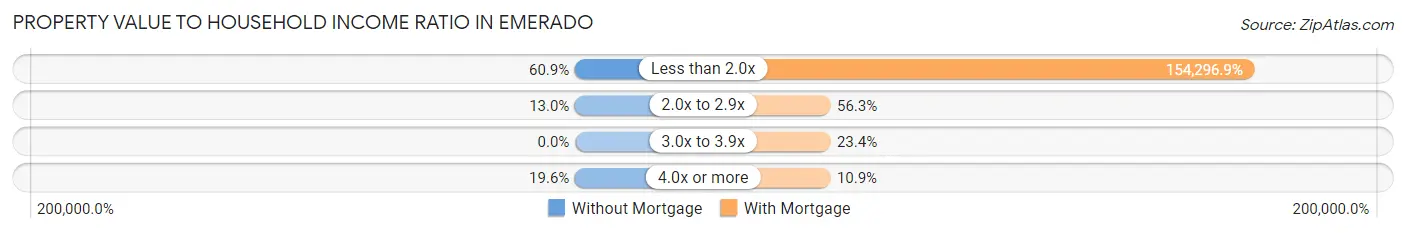
| Value-to-Income Ratio | Without Mortgage | With Mortgage |
| Less than 2.0x | 28 (60.9%) | 98,750 (154,296.9%) |
| 2.0x to 2.9x | 6 (13.0%) | 36 (56.2%) |
| 3.0x to 3.9x | 0 (0.0%) | 15 (23.4%) |
| 4.0x or more | 9 (19.6%) | 7 (10.9%) |
| Total | 46 (100.0%) | 64 (100.0%) |
Real Estate Taxes by Mortgage Status in Emerado
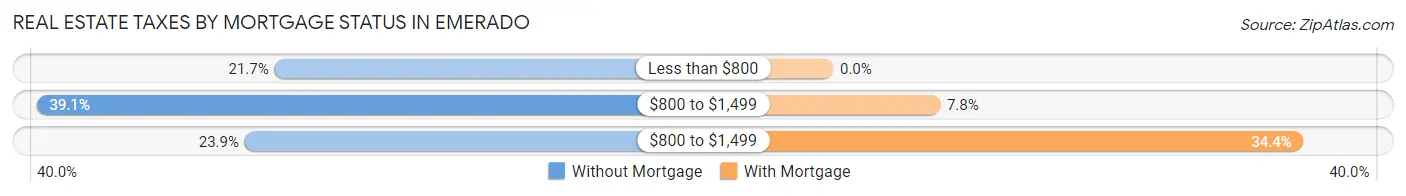
| Property Taxes | Without Mortgage | With Mortgage |
| Less than $800 | 10 (21.7%) | 0 (0.0%) |
| $800 to $1,499 | 18 (39.1%) | 5 (7.8%) |
| $800 to $1,499 | 11 (23.9%) | 22 (34.4%) |
| Total | 46 (100.0%) | 64 (100.0%) |
Health & Disability in Emerado
Health Insurance Coverage by Age in Emerado
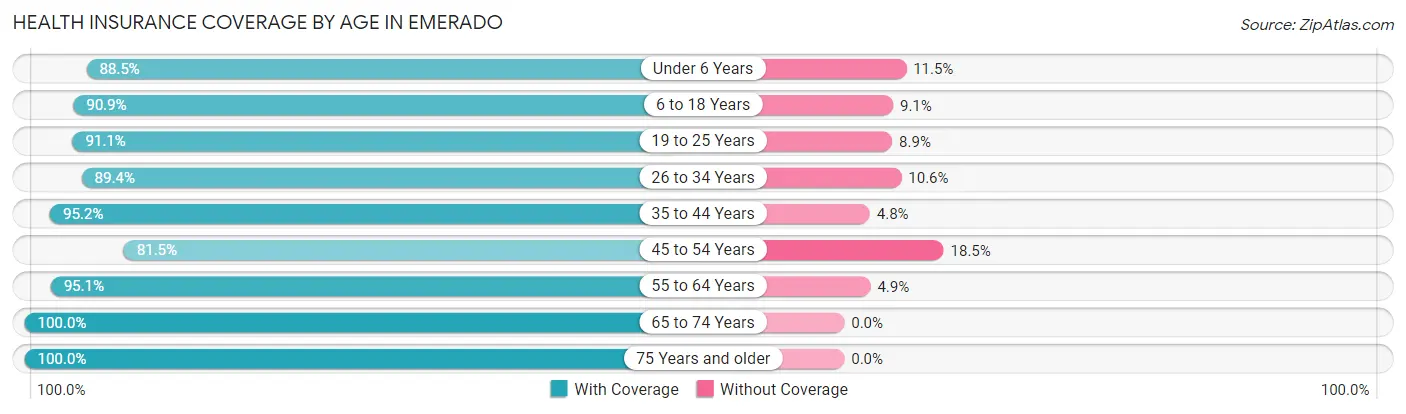
| Age Bracket | With Coverage | Without Coverage |
| Under 6 Years | 46 (88.5%) | 6 (11.5%) |
| 6 to 18 Years | 60 (90.9%) | 6 (9.1%) |
| 19 to 25 Years | 51 (91.1%) | 5 (8.9%) |
| 26 to 34 Years | 42 (89.4%) | 5 (10.6%) |
| 35 to 44 Years | 60 (95.2%) | 3 (4.8%) |
| 45 to 54 Years | 22 (81.5%) | 5 (18.5%) |
| 55 to 64 Years | 39 (95.1%) | 2 (4.9%) |
| 65 to 74 Years | 31 (100.0%) | 0 (0.0%) |
| 75 Years and older | 29 (100.0%) | 0 (0.0%) |
| Total | 380 (92.2%) | 32 (7.8%) |
Health Insurance Coverage by Citizenship Status in Emerado
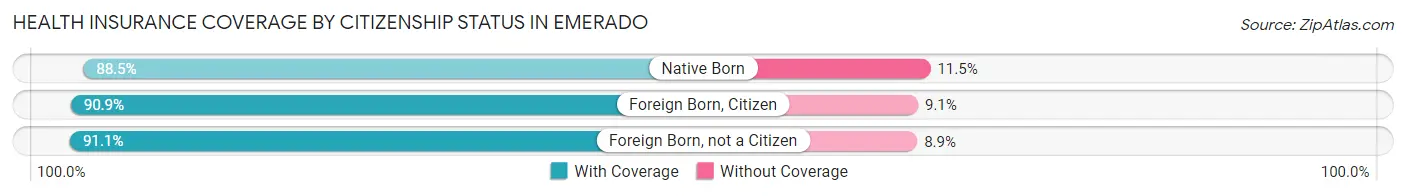
| Citizenship Status | With Coverage | Without Coverage |
| Native Born | 46 (88.5%) | 6 (11.5%) |
| Foreign Born, Citizen | 60 (90.9%) | 6 (9.1%) |
| Foreign Born, not a Citizen | 51 (91.1%) | 5 (8.9%) |
Health Insurance Coverage by Household Income in Emerado
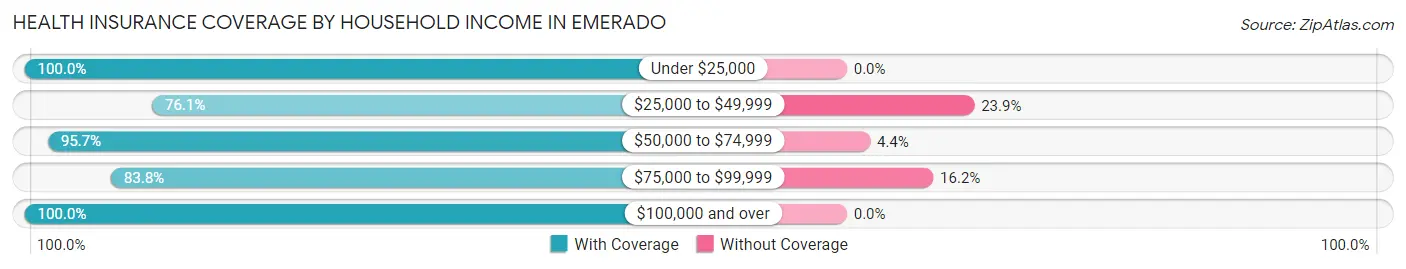
| Household Income | With Coverage | Without Coverage |
| Under $25,000 | 27 (100.0%) | 0 (0.0%) |
| $25,000 to $49,999 | 51 (76.1%) | 16 (23.9%) |
| $50,000 to $74,999 | 110 (95.7%) | 5 (4.3%) |
| $75,000 to $99,999 | 57 (83.8%) | 11 (16.2%) |
| $100,000 and over | 135 (100.0%) | 0 (0.0%) |
Public vs Private Health Insurance Coverage by Age in Emerado
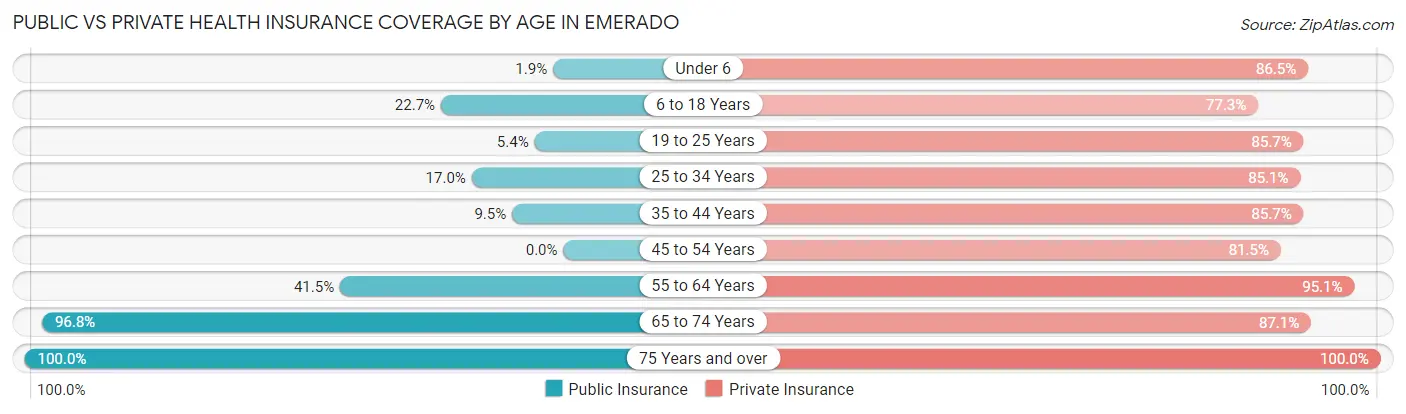
| Age Bracket | Public Insurance | Private Insurance |
| Under 6 | 1 (1.9%) | 45 (86.5%) |
| 6 to 18 Years | 15 (22.7%) | 51 (77.3%) |
| 19 to 25 Years | 3 (5.4%) | 48 (85.7%) |
| 25 to 34 Years | 8 (17.0%) | 40 (85.1%) |
| 35 to 44 Years | 6 (9.5%) | 54 (85.7%) |
| 45 to 54 Years | 0 (0.0%) | 22 (81.5%) |
| 55 to 64 Years | 17 (41.5%) | 39 (95.1%) |
| 65 to 74 Years | 30 (96.8%) | 27 (87.1%) |
| 75 Years and over | 29 (100.0%) | 29 (100.0%) |
| Total | 109 (26.5%) | 355 (86.2%) |
Disability Status by Sex by Age in Emerado
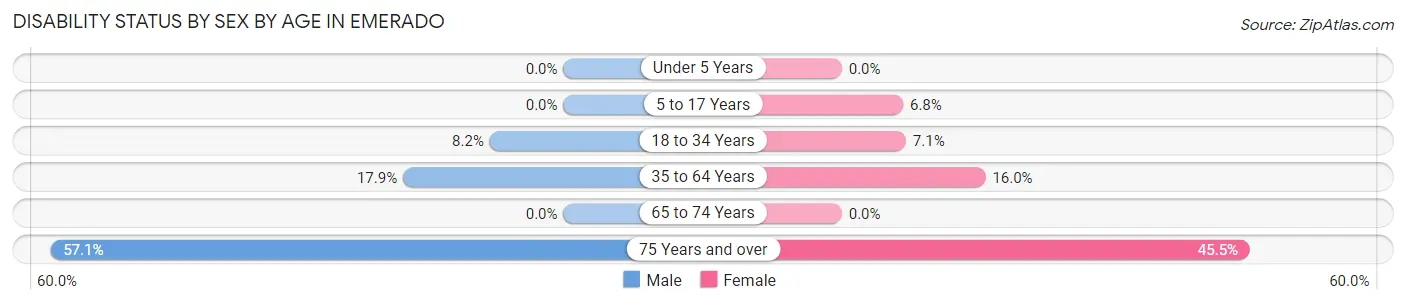
| Age Bracket | Male | Female |
| Under 5 Years | 0 (0.0%) | 0 (0.0%) |
| 5 to 17 Years | 0 (0.0%) | 3 (6.8%) |
| 18 to 34 Years | 5 (8.2%) | 3 (7.1%) |
| 35 to 64 Years | 10 (17.9%) | 12 (16.0%) |
| 65 to 74 Years | 0 (0.0%) | 0 (0.0%) |
| 75 Years and over | 4 (57.1%) | 10 (45.5%) |
Disability Class by Sex by Age in Emerado
Disability Class: Hearing Difficulty
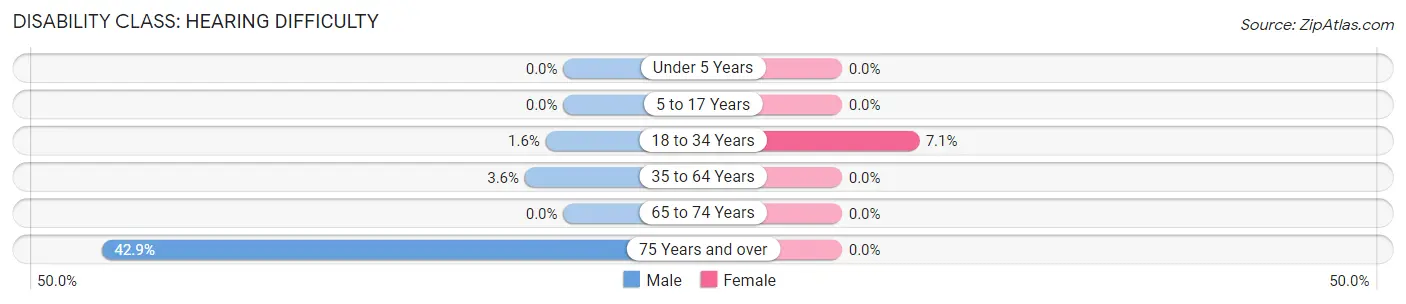
| Age Bracket | Male | Female |
| Under 5 Years | 0 (0.0%) | 0 (0.0%) |
| 5 to 17 Years | 0 (0.0%) | 0 (0.0%) |
| 18 to 34 Years | 1 (1.6%) | 3 (7.1%) |
| 35 to 64 Years | 2 (3.6%) | 0 (0.0%) |
| 65 to 74 Years | 0 (0.0%) | 0 (0.0%) |
| 75 Years and over | 3 (42.9%) | 0 (0.0%) |
Disability Class: Vision Difficulty
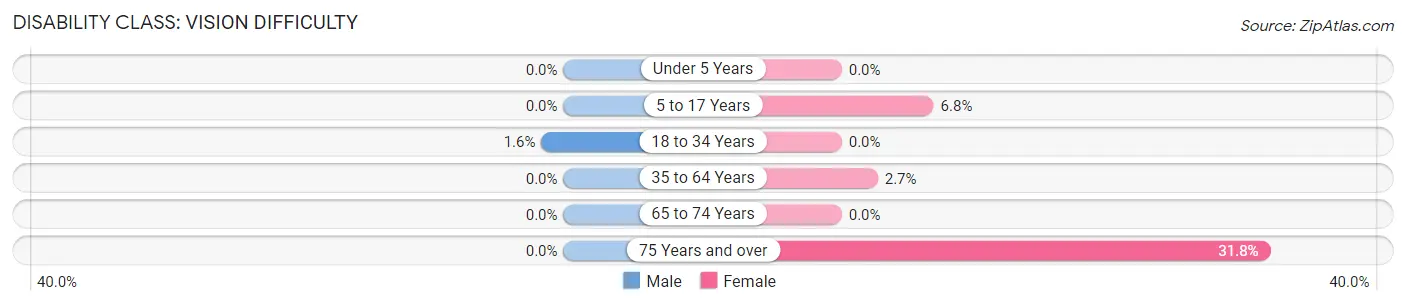
| Age Bracket | Male | Female |
| Under 5 Years | 0 (0.0%) | 0 (0.0%) |
| 5 to 17 Years | 0 (0.0%) | 3 (6.8%) |
| 18 to 34 Years | 1 (1.6%) | 0 (0.0%) |
| 35 to 64 Years | 0 (0.0%) | 2 (2.7%) |
| 65 to 74 Years | 0 (0.0%) | 0 (0.0%) |
| 75 Years and over | 0 (0.0%) | 7 (31.8%) |
Disability Class: Cognitive Difficulty
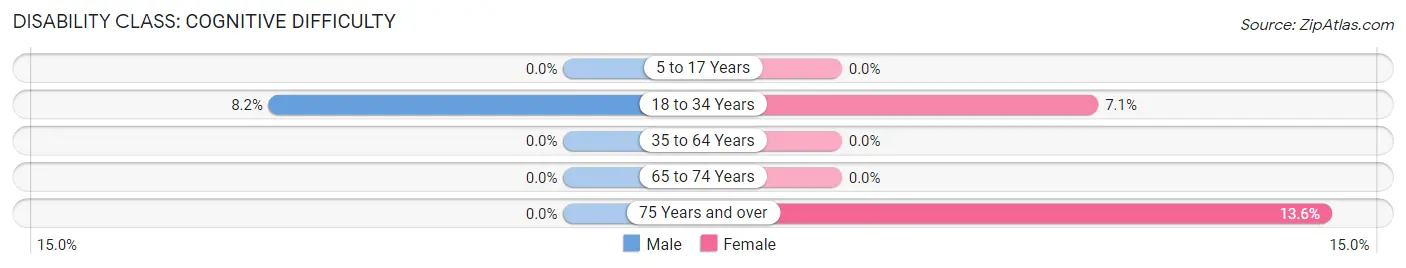
| Age Bracket | Male | Female |
| 5 to 17 Years | 0 (0.0%) | 0 (0.0%) |
| 18 to 34 Years | 5 (8.2%) | 3 (7.1%) |
| 35 to 64 Years | 0 (0.0%) | 0 (0.0%) |
| 65 to 74 Years | 0 (0.0%) | 0 (0.0%) |
| 75 Years and over | 0 (0.0%) | 3 (13.6%) |
Disability Class: Ambulatory Difficulty
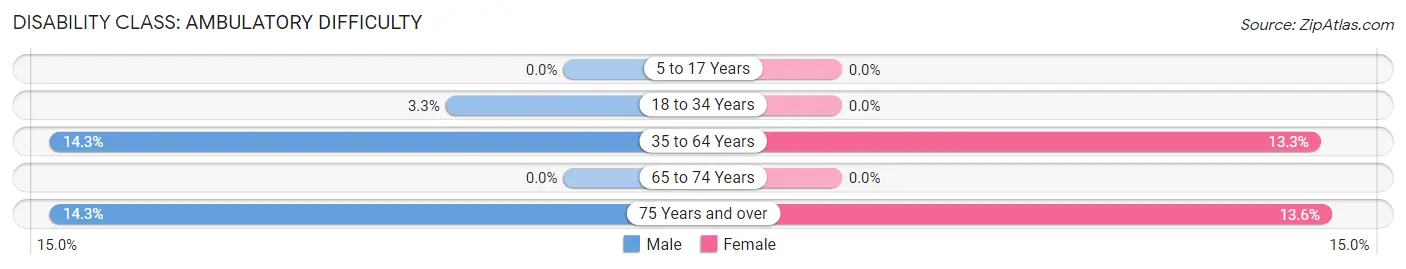
| Age Bracket | Male | Female |
| 5 to 17 Years | 0 (0.0%) | 0 (0.0%) |
| 18 to 34 Years | 2 (3.3%) | 0 (0.0%) |
| 35 to 64 Years | 8 (14.3%) | 10 (13.3%) |
| 65 to 74 Years | 0 (0.0%) | 0 (0.0%) |
| 75 Years and over | 1 (14.3%) | 3 (13.6%) |
Disability Class: Self-Care Difficulty
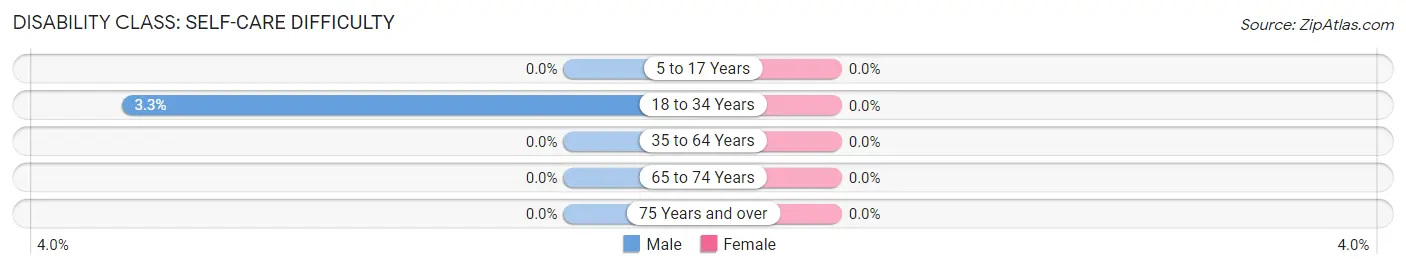
| Age Bracket | Male | Female |
| 5 to 17 Years | 0 (0.0%) | 0 (0.0%) |
| 18 to 34 Years | 2 (3.3%) | 0 (0.0%) |
| 35 to 64 Years | 0 (0.0%) | 0 (0.0%) |
| 65 to 74 Years | 0 (0.0%) | 0 (0.0%) |
| 75 Years and over | 0 (0.0%) | 0 (0.0%) |
Technology Access in Emerado
Computing Device Access in Emerado
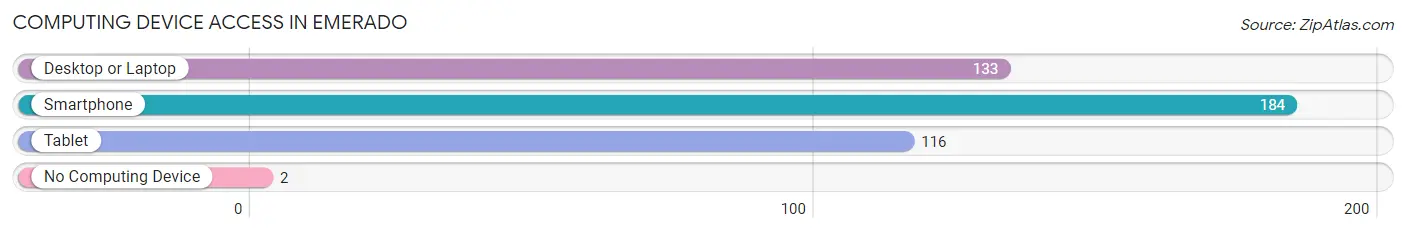
| Device Type | # Households | % Households |
| Desktop or Laptop | 133 | 68.9% |
| Smartphone | 184 | 95.3% |
| Tablet | 116 | 60.1% |
| No Computing Device | 2 | 1.0% |
| Total | 193 | 100.0% |
Internet Access in Emerado
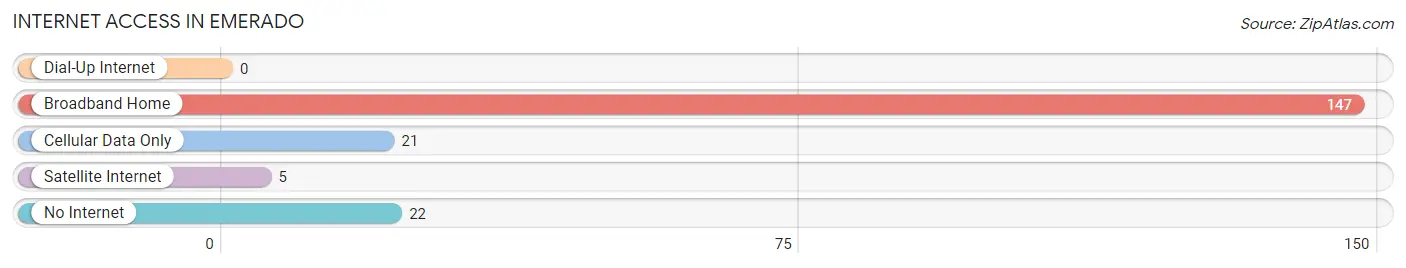
| Internet Type | # Households | % Households |
| Dial-Up Internet | 0 | 0.0% |
| Broadband Home | 147 | 76.2% |
| Cellular Data Only | 21 | 10.9% |
| Satellite Internet | 5 | 2.6% |
| No Internet | 22 | 11.4% |
| Total | 193 | 100.0% |
Emerado Summary
Emando, North Dakota is a small town located in the northeastern corner of the state. It is situated in the Red River Valley, which is a major agricultural region in the state. The town has a population of just over 500 people and is the county seat of Grand Forks County.
The town was founded in 1881 by a group of settlers from Norway. The settlers named the town after the Norwegian word for “emerald”, which was the color of the soil in the area. The town was originally a farming community, but it has since become a center for oil and gas production.
Geographically, Emando is located in the Red River Valley, which is a flat, fertile plain that stretches from the Canadian border to the Minnesota border. The valley is bordered by the Red River of the North to the east and the Pembina River to the west. The town is situated on the banks of the Red River, which is a major tributary of the Mississippi River.
The climate in Emando is typical of the northern Great Plains. Summers are hot and humid, while winters are cold and dry. The average annual temperature is around 45 degrees Fahrenheit. The town receives an average of 24 inches of precipitation each year, most of which falls in the form of snow.
The economy of Emando is largely based on agriculture and oil and gas production. The town is home to several large farms, which produce a variety of crops, including wheat, corn, soybeans, and sunflowers. The town is also home to several oil and gas companies, which produce natural gas and crude oil.
The demographics of Emando are largely white. According to the 2010 census, the town had a population of 514 people, of which 97.3% were white. The median household income was $41,250, and the median age was 44.7 years.
Emando is a small town with a rich history and a bright future. It is a great place to live and work, and it offers a variety of activities and attractions for visitors and residents alike. The town is home to several parks, museums, and other attractions, and it is a great place to explore the natural beauty of the Red River Valley.
Common Questions
What is the Total Population of Emerado?
Total Population of Emerado is 416.
What is the Total Male Population of Emerado?
Total Male Population of Emerado is 211.
What is the Total Female Population of Emerado?
Total Female Population of Emerado is 205.
What is the Ratio of Males per 100 Females in Emerado?
There are 102.93 Males per 100 Females in Emerado.
What is the Ratio of Females per 100 Males in Emerado?
There are 97.16 Females per 100 Males in Emerado.
What is the Median Population Age in Emerado?
Median Population Age in Emerado is 31.5 Years.
What is the Average Family Size in Emerado
Average Family Size in Emerado is 2.7 People.
What is the Average Household Size in Emerado
Average Household Size in Emerado is 2.2 People.
What is Per Capita Income in Emerado?
Per Capita income in Emerado is $31,916.
What is the Median Family Income in Emerado?
Median Family Income in Emerado is $93,750.
What is the Median Household income in Emerado?
Median Household Income in Emerado is $64,271.
What is Income or Wage Gap in Emerado?
Income or Wage Gap in Emerado is 18.4%.
Women in Emerado earn 81.6 cents for every dollar earned by a man.
What is Inequality or Gini Index in Emerado?
Inequality or Gini Index in Emerado is 0.33.
How Large is the Labor Force in Emerado?
There are 219 People in the Labor Forcein in Emerado.
What is the Percentage of People in the Labor Force in Emerado?
72.5% of People are in the Labor Force in Emerado.
What is the Unemployment Rate in Emerado?
Unemployment Rate in Emerado is 3.3%.