Ray, ND
Ray Map
Ray Overview
768
TOTAL POPULATION
380
MALE POPULATION
388
FEMALE POPULATION
97.94
MALES / 100 FEMALES
102.11
FEMALES / 100 MALES
32.4
MEDIAN AGE
3.1
AVG FAMILY SIZE
2.5
AVG HOUSEHOLD SIZE
$45,421
PER CAPITA INCOME
$68,375
AVG FAMILY INCOME
$65,208
AVG HOUSEHOLD INCOME
72.0%
WAGE / INCOME GAP [ % ]
28.0¢/ $1
WAGE / INCOME GAP [ $ ]
0.49
INEQUALITY / GINI INDEX
386
LABOR FORCE [ PEOPLE ]
72.7%
PERCENT IN LABOR FORCE
0.3%
UNEMPLOYMENT RATE
Ray Zip Codes
Ray Area Codes
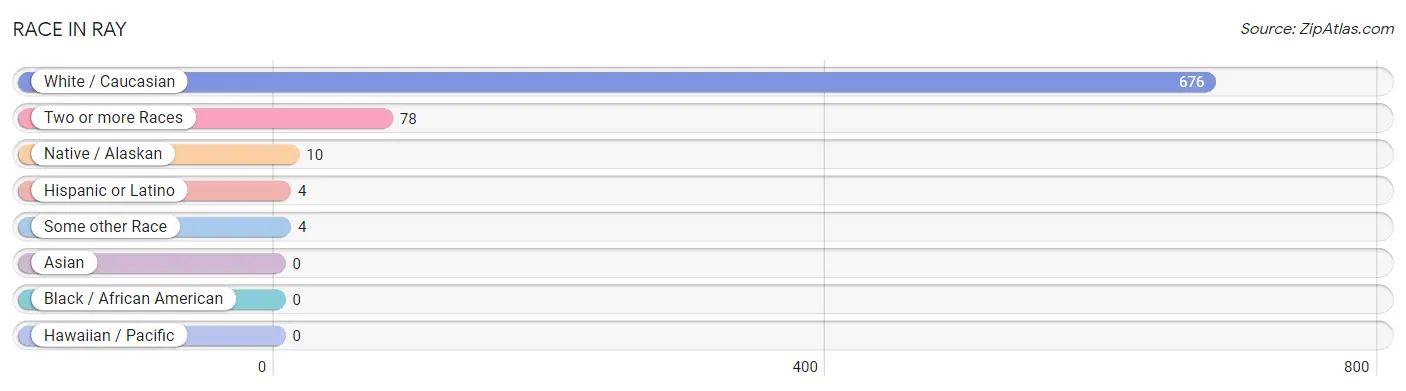
Race in Ray
The most populous races in Ray are White / Caucasian (676 | 88.0%), Two or more Races (78 | 10.2%), and Native / Alaskan (10 | 1.3%).
| Race | # Population | % Population |
| Asian | 0 | 0.0% |
| Black / African American | 0 | 0.0% |
| Hawaiian / Pacific | 0 | 0.0% |
| Hispanic or Latino | 4 | 0.5% |
| Native / Alaskan | 10 | 1.3% |
| White / Caucasian | 676 | 88.0% |
| Two or more Races | 78 | 10.2% |
| Some other Race | 4 | 0.5% |
| Total | 768 | 100.0% |
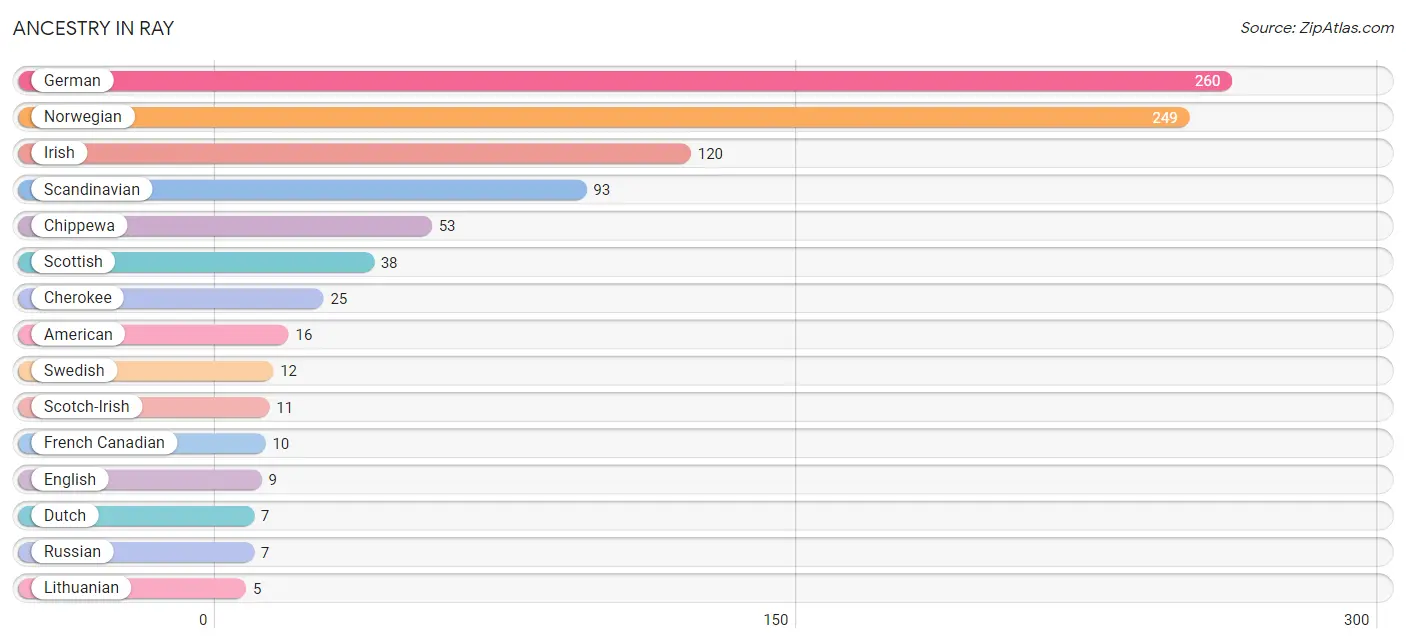
Ancestry in Ray
The most populous ancestries reported in Ray are German (260 | 33.9%), Norwegian (249 | 32.4%), Irish (120 | 15.6%), Scandinavian (93 | 12.1%), and Chippewa (53 | 6.9%), together accounting for 100.9% of all Ray residents.
| Ancestry | # Population | % Population |
| American | 16 | 2.1% |
| Cherokee | 25 | 3.3% |
| Chippewa | 53 | 6.9% |
| Czech | 3 | 0.4% |
| Dutch | 7 | 0.9% |
| English | 9 | 1.2% |
| French | 3 | 0.4% |
| French Canadian | 10 | 1.3% |
| German | 260 | 33.9% |
| Irish | 120 | 15.6% |
| Lithuanian | 5 | 0.6% |
| Mexican | 4 | 0.5% |
| Norwegian | 249 | 32.4% |
| Polish | 2 | 0.3% |
| Russian | 7 | 0.9% |
| Scandinavian | 93 | 12.1% |
| Scotch-Irish | 11 | 1.4% |
| Scottish | 38 | 5.0% |
| Swedish | 12 | 1.6% | View All 19 Rows |
Immigrants in Ray

| Immigration Origin | # Population | % Population | View All 0 Rows |
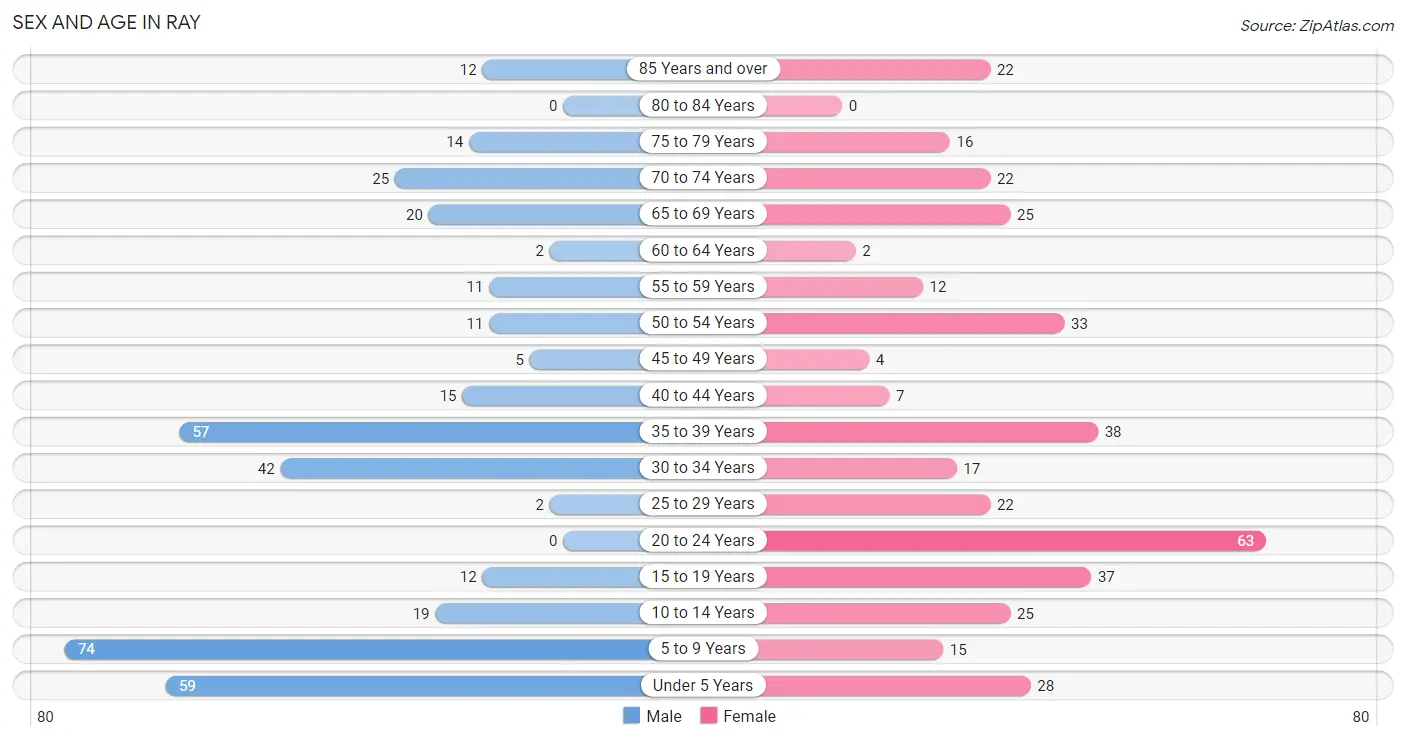
Sex and Age in Ray
Sex and Age in Ray
The most populous age groups in Ray are 5 to 9 Years (74 | 19.5%) for men and 20 to 24 Years (63 | 16.2%) for women.
| Age Bracket | Male | Female |
| Under 5 Years | 59 (15.5%) | 28 (7.2%) |
| 5 to 9 Years | 74 (19.5%) | 15 (3.9%) |
| 10 to 14 Years | 19 (5.0%) | 25 (6.4%) |
| 15 to 19 Years | 12 (3.2%) | 37 (9.5%) |
| 20 to 24 Years | 0 (0.0%) | 63 (16.2%) |
| 25 to 29 Years | 2 (0.5%) | 22 (5.7%) |
| 30 to 34 Years | 42 (11.1%) | 17 (4.4%) |
| 35 to 39 Years | 57 (15.0%) | 38 (9.8%) |
| 40 to 44 Years | 15 (4.0%) | 7 (1.8%) |
| 45 to 49 Years | 5 (1.3%) | 4 (1.0%) |
| 50 to 54 Years | 11 (2.9%) | 33 (8.5%) |
| 55 to 59 Years | 11 (2.9%) | 12 (3.1%) |
| 60 to 64 Years | 2 (0.5%) | 2 (0.5%) |
| 65 to 69 Years | 20 (5.3%) | 25 (6.4%) |
| 70 to 74 Years | 25 (6.6%) | 22 (5.7%) |
| 75 to 79 Years | 14 (3.7%) | 16 (4.1%) |
| 80 to 84 Years | 0 (0.0%) | 0 (0.0%) |
| 85 Years and over | 12 (3.2%) | 22 (5.7%) |
| Total | 380 (100.0%) | 388 (100.0%) |
Families and Households in Ray
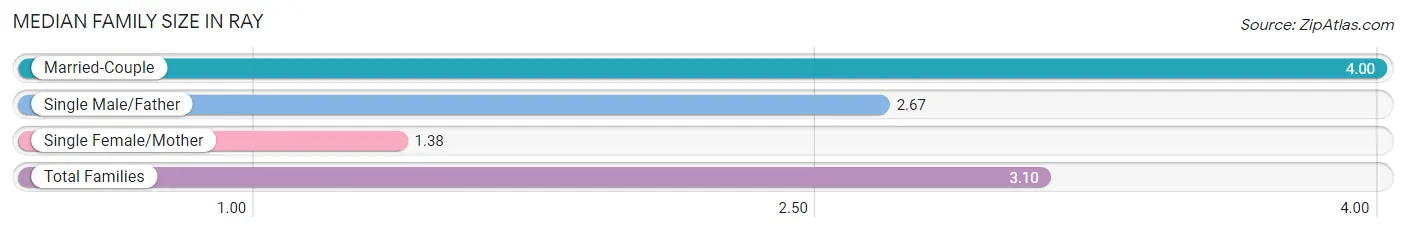
Median Family Size in Ray
The median family size in Ray is 3.10 persons per family, with married-couple families (131 | 62.1%) accounting for the largest median family size of 4 persons per family. On the other hand, single female/mother families (65 | 30.8%) represent the smallest median family size with 1.38 persons per family.
| Family Type | # Families | Family Size |
| Married-Couple | 131 (62.1%) | 4.00 |
| Single Male/Father | 15 (7.1%) | 2.67 |
| Single Female/Mother | 65 (30.8%) | 1.38 |
| Total Families | 211 (100.0%) | 3.10 |
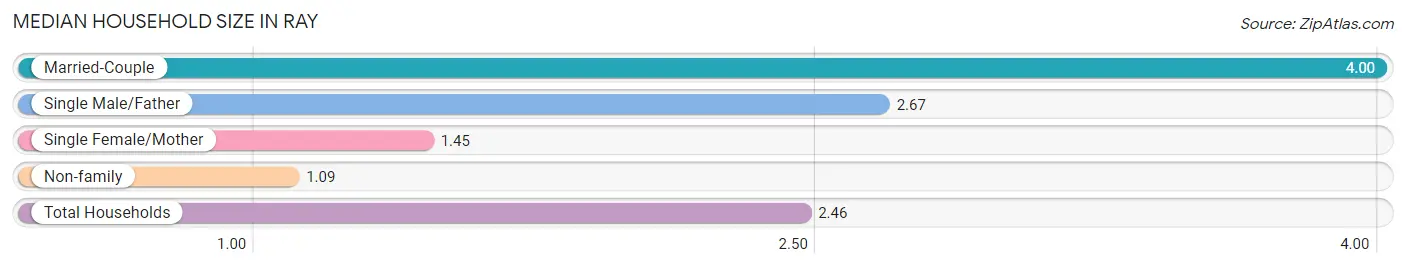
Median Household Size in Ray
The median household size in Ray is 2.46 persons per household, with married-couple households (131 | 42.0%) accounting for the largest median household size of 4 persons per household. non-family households (101 | 32.4%) represent the smallest median household size with 1.09 persons per household.
| Household Type | # Households | Household Size |
| Married-Couple | 131 (42.0%) | 4.00 |
| Single Male/Father | 15 (4.8%) | 2.67 |
| Single Female/Mother | 65 (20.8%) | 1.45 |
| Non-family | 101 (32.4%) | 1.09 |
| Total Households | 312 (100.0%) | 2.46 |
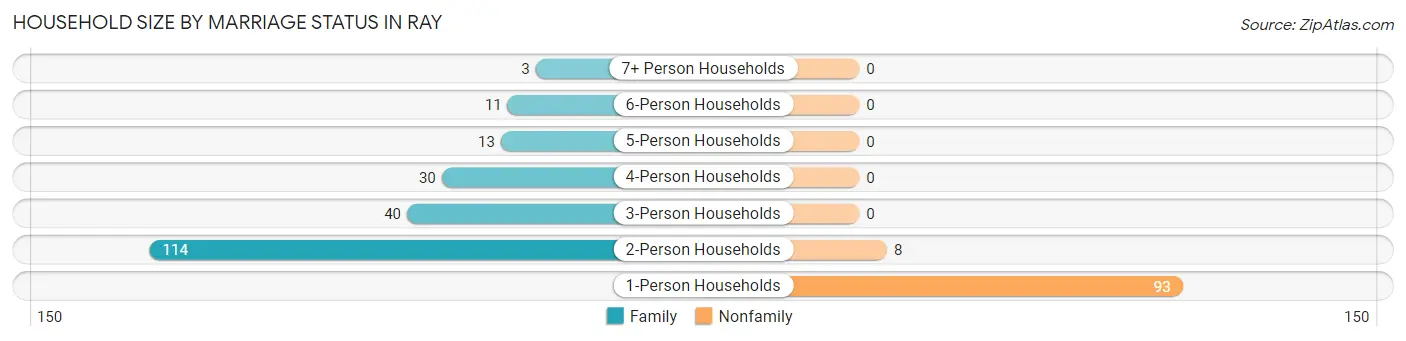
Household Size by Marriage Status in Ray
Out of a total of 312 households in Ray, 211 (67.6%) are family households, while 101 (32.4%) are nonfamily households. The most numerous type of family households are 2-person households, comprising 114, and the most common type of nonfamily households are 1-person households, comprising 93.
| Household Size | Family Households | Nonfamily Households |
| 1-Person Households | - | 93 (29.8%) |
| 2-Person Households | 114 (36.5%) | 8 (2.6%) |
| 3-Person Households | 40 (12.8%) | 0 (0.0%) |
| 4-Person Households | 30 (9.6%) | 0 (0.0%) |
| 5-Person Households | 13 (4.2%) | 0 (0.0%) |
| 6-Person Households | 11 (3.5%) | 0 (0.0%) |
| 7+ Person Households | 3 (1.0%) | 0 (0.0%) |
| Total | 211 (67.6%) | 101 (32.4%) |
Female Fertility in Ray
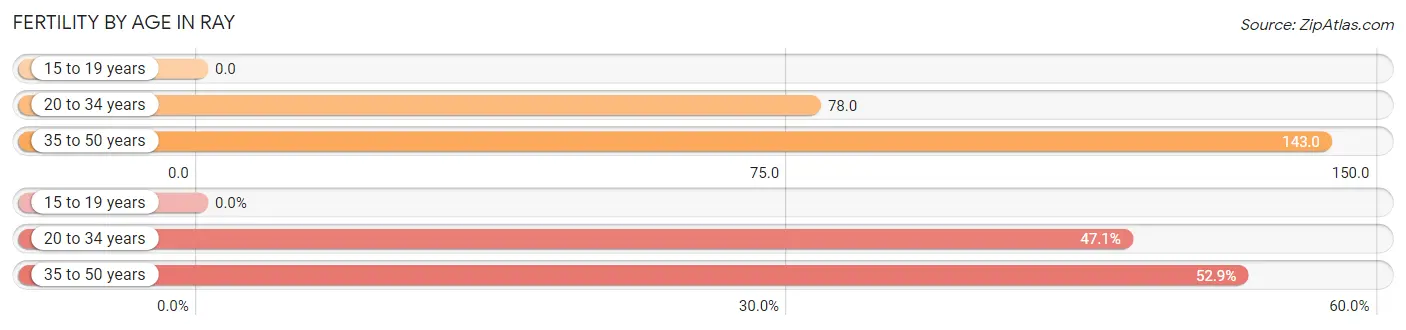
Fertility by Age in Ray
Average fertility rate in Ray is 84.0 births per 1,000 women. Women in the age bracket of 35 to 50 years have the highest fertility rate with 143.0 births per 1,000 women. Women in the age bracket of 35 to 50 years acount for 52.9% of all women with births.
| Age Bracket | Women with Births | Births / 1,000 Women |
| 15 to 19 years | 0 (0.0%) | 0.0 |
| 20 to 34 years | 8 (47.1%) | 78.0 |
| 35 to 50 years | 9 (52.9%) | 143.0 |
| Total | 17 (100.0%) | 84.0 |
Fertility by Age by Marriage Status in Ray
64.7% of women with births (17) in Ray are married. The highest percentage of unmarried women with births falls into 20 to 34 years age bracket with 75.0% of them unmarried at the time of birth, while the lowest percentage of unmarried women with births belong to 35 to 50 years age bracket with 0.0% of them unmarried.
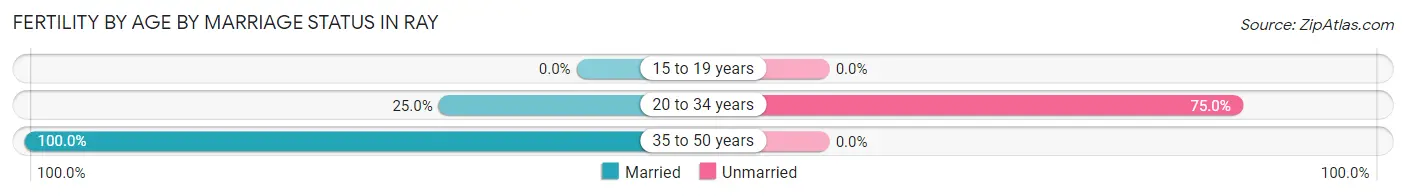
| Age Bracket | Married | Unmarried |
| 15 to 19 years | 0 (0.0%) | 0 (0.0%) |
| 20 to 34 years | 2 (25.0%) | 6 (75.0%) |
| 35 to 50 years | 9 (100.0%) | 0 (0.0%) |
| Total | 11 (64.7%) | 6 (35.3%) |
Fertility by Education in Ray
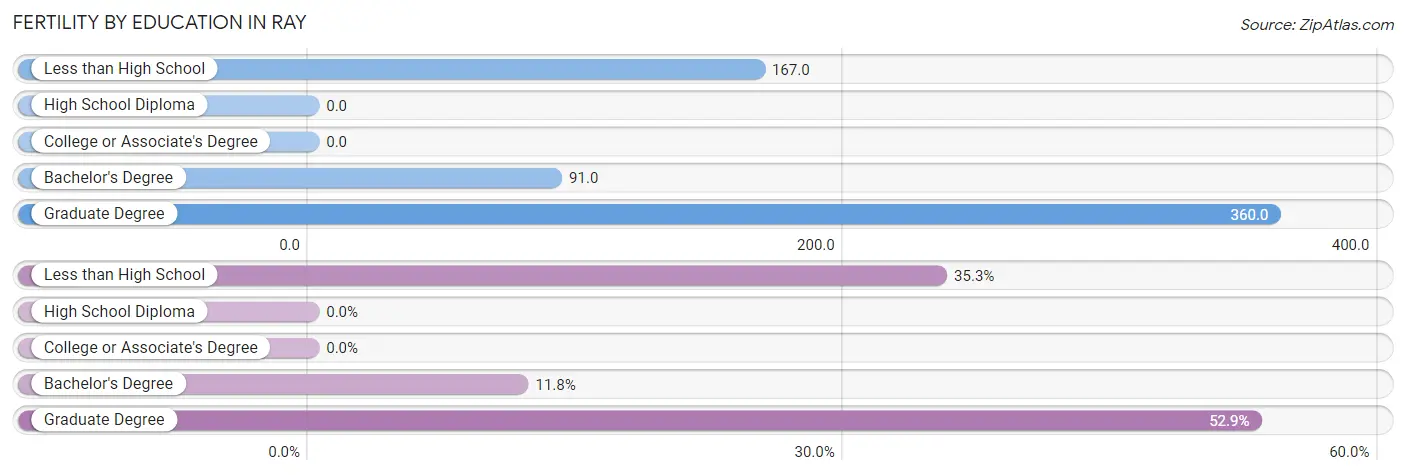
| Educational Attainment | Women with Births | Births / 1,000 Women |
| Less than High School | 6 (35.3%) | 167.0 |
| High School Diploma | 0 (0.0%) | 0.0 |
| College or Associate's Degree | 0 (0.0%) | 0.0 |
| Bachelor's Degree | 2 (11.8%) | 91.0 |
| Graduate Degree | 9 (52.9%) | 360.0 |
| Total | 17 (100.0%) | 84.0 |
Fertility by Education by Marriage Status in Ray
35.3% of women with births in Ray are unmarried. Women with the educational attainment of bachelor's degree are most likely to be married with 100.0% of them married at childbirth, while women with the educational attainment of less than high school are least likely to be married with 100.0% of them unmarried at childbirth.
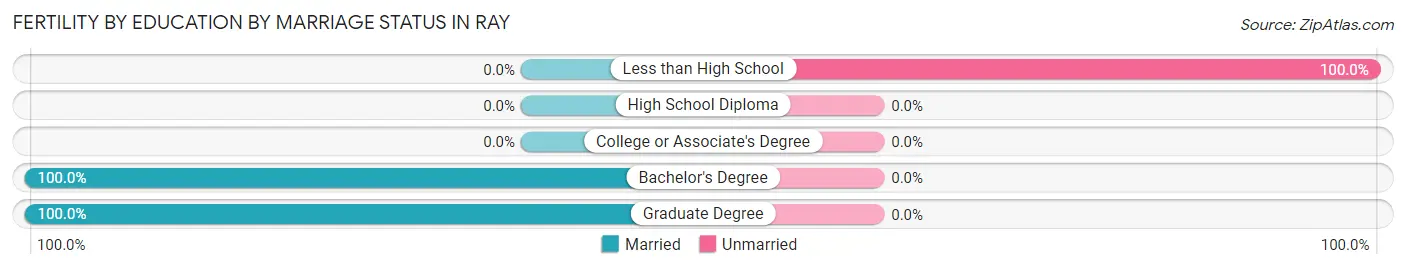
| Educational Attainment | Married | Unmarried |
| Less than High School | 0 (0.0%) | 6 (100.0%) |
| High School Diploma | 0 (0.0%) | 0 (0.0%) |
| College or Associate's Degree | 0 (0.0%) | 0 (0.0%) |
| Bachelor's Degree | 2 (100.0%) | 0 (0.0%) |
| Graduate Degree | 9 (100.0%) | 0 (0.0%) |
| Total | 11 (64.7%) | 6 (35.3%) |
Income in Ray
Income Overview in Ray
Per Capita Income in Ray is $45,421, while median incomes of families and households are $68,375 and $65,208 respectively.
| Characteristic | Number | Measure |
| Per Capita Income | 768 | $45,421 |
| Median Family Income | 211 | $68,375 |
| Mean Family Income | 211 | $112,716 |
| Median Household Income | 312 | $65,208 |
| Mean Household Income | 312 | $94,179 |
| Income Deficit | 211 | $0 |
| Wage / Income Gap (%) | 768 | 72.04% |
| Wage / Income Gap ($) | 768 | 27.96¢ per $1 |
| Gini / Inequality Index | 768 | 0.49 |
Earnings by Sex in Ray
Average Earnings in Ray are $44,750, $103,750 for men and $29,009 for women, a difference of 72.0%.
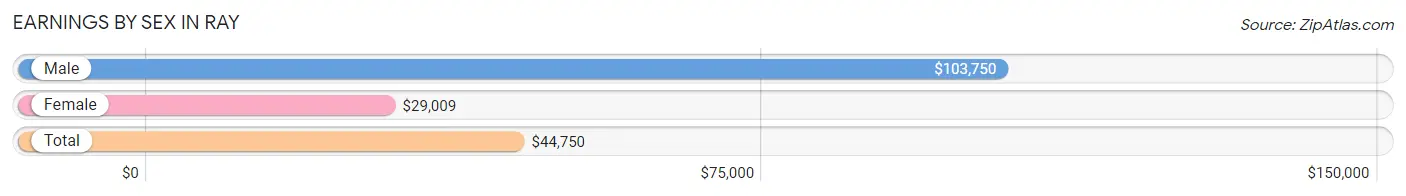
| Sex | Number | Average Earnings |
| Male | 166 (41.3%) | $103,750 |
| Female | 236 (58.7%) | $29,009 |
| Total | 402 (100.0%) | $44,750 |
Earnings by Sex by Income Bracket in Ray
The most common earnings brackets in Ray are $100,000+ for men (83 | 50.0%) and $25,000 to $29,999 for women (63 | 26.7%).
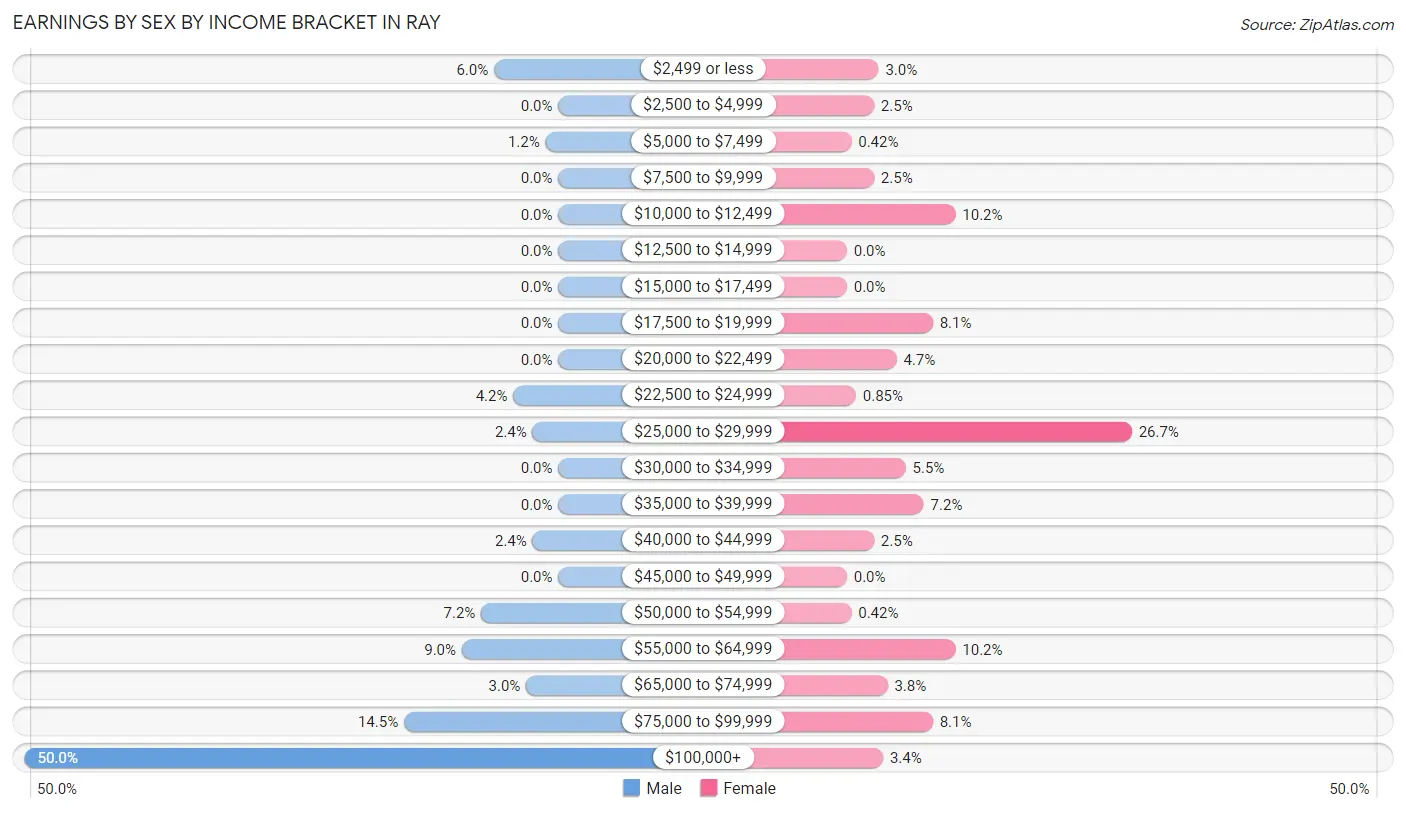
| Income | Male | Female |
| $2,499 or less | 10 (6.0%) | 7 (3.0%) |
| $2,500 to $4,999 | 0 (0.0%) | 6 (2.5%) |
| $5,000 to $7,499 | 2 (1.2%) | 1 (0.4%) |
| $7,500 to $9,999 | 0 (0.0%) | 6 (2.5%) |
| $10,000 to $12,499 | 0 (0.0%) | 24 (10.2%) |
| $12,500 to $14,999 | 0 (0.0%) | 0 (0.0%) |
| $15,000 to $17,499 | 0 (0.0%) | 0 (0.0%) |
| $17,500 to $19,999 | 0 (0.0%) | 19 (8.1%) |
| $20,000 to $22,499 | 0 (0.0%) | 11 (4.7%) |
| $22,500 to $24,999 | 7 (4.2%) | 2 (0.9%) |
| $25,000 to $29,999 | 4 (2.4%) | 63 (26.7%) |
| $30,000 to $34,999 | 0 (0.0%) | 13 (5.5%) |
| $35,000 to $39,999 | 0 (0.0%) | 17 (7.2%) |
| $40,000 to $44,999 | 4 (2.4%) | 6 (2.5%) |
| $45,000 to $49,999 | 0 (0.0%) | 0 (0.0%) |
| $50,000 to $54,999 | 12 (7.2%) | 1 (0.4%) |
| $55,000 to $64,999 | 15 (9.0%) | 24 (10.2%) |
| $65,000 to $74,999 | 5 (3.0%) | 9 (3.8%) |
| $75,000 to $99,999 | 24 (14.5%) | 19 (8.1%) |
| $100,000+ | 83 (50.0%) | 8 (3.4%) |
| Total | 166 (100.0%) | 236 (100.0%) |
Earnings by Sex by Educational Attainment in Ray
Average earnings in Ray are $110,938 for men and $31,250 for women, a difference of 71.8%. Men with an educational attainment of bachelor's degree enjoy the highest average annual earnings of $250,001, while those with high school diploma education earn the least with $71,667. Women with an educational attainment of bachelor's degree earn the most with the average annual earnings of $67,143, while those with high school diploma education have the smallest earnings of $21,023.
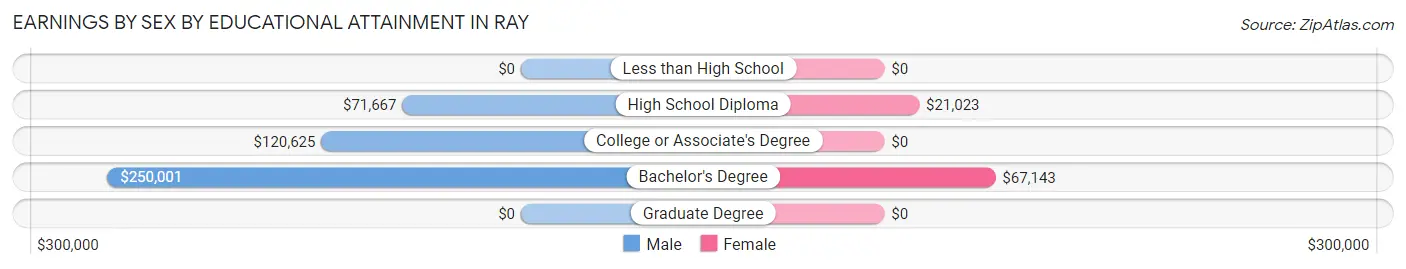
| Educational Attainment | Male Income | Female Income |
| Less than High School | - | - |
| High School Diploma | $71,667 | $21,023 |
| College or Associate's Degree | $120,625 | $0 |
| Bachelor's Degree | $250,001 | $67,143 |
| Graduate Degree | - | - |
| Total | $110,938 | $31,250 |
Family Income in Ray
Family Income Brackets in Ray
According to the Ray family income data, there are 53 families falling into the $25,000 to $34,999 income range, which is the most common income bracket and makes up 25.1% of all families.
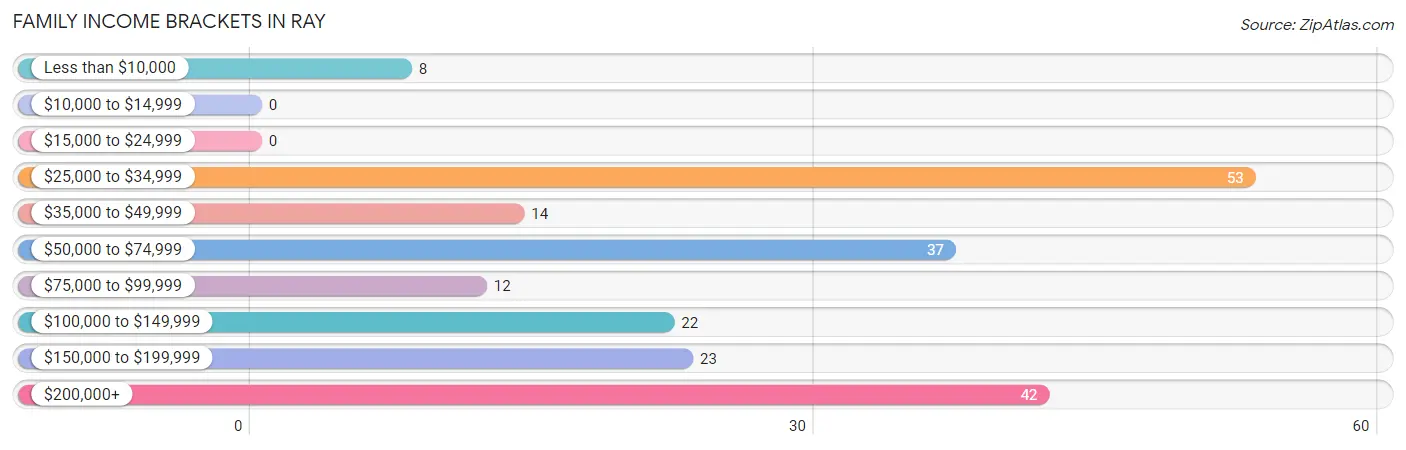
| Income Bracket | # Families | % Families |
| Less than $10,000 | 8 | 3.8% |
| $10,000 to $14,999 | 0 | 0.0% |
| $15,000 to $24,999 | 0 | 0.0% |
| $25,000 to $34,999 | 53 | 25.1% |
| $35,000 to $49,999 | 14 | 6.6% |
| $50,000 to $74,999 | 37 | 17.5% |
| $75,000 to $99,999 | 12 | 5.7% |
| $100,000 to $149,999 | 22 | 10.4% |
| $150,000 to $199,999 | 23 | 10.9% |
| $200,000+ | 42 | 19.9% |
Family Income by Famaliy Size in Ray
4-person families (30 | 14.2%) account for the highest median family income in Ray with $250,001 per family, while 4-person families (30 | 14.2%) have the highest median income of $62,500 per family member.
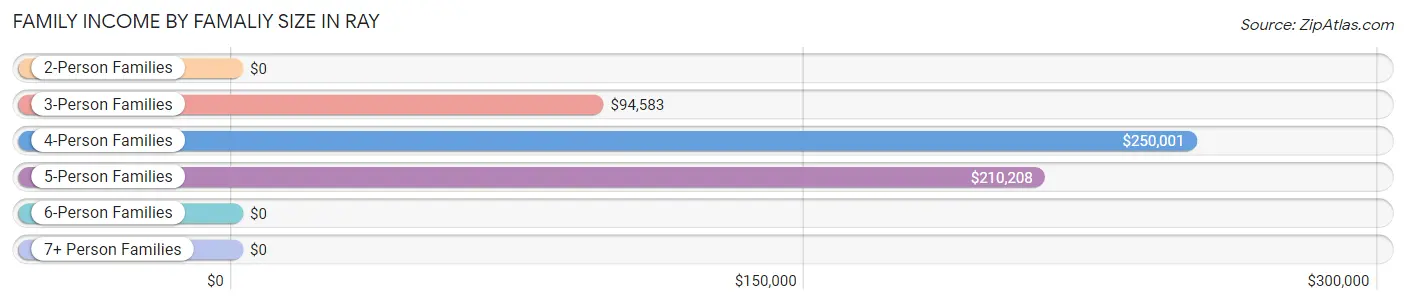
| Income Bracket | # Families | Median Income |
| 2-Person Families | 120 (56.9%) | $0 |
| 3-Person Families | 34 (16.1%) | $94,583 |
| 4-Person Families | 30 (14.2%) | $250,001 |
| 5-Person Families | 13 (6.2%) | $210,208 |
| 6-Person Families | 11 (5.2%) | $0 |
| 7+ Person Families | 3 (1.4%) | $0 |
| Total | 211 (100.0%) | $68,375 |
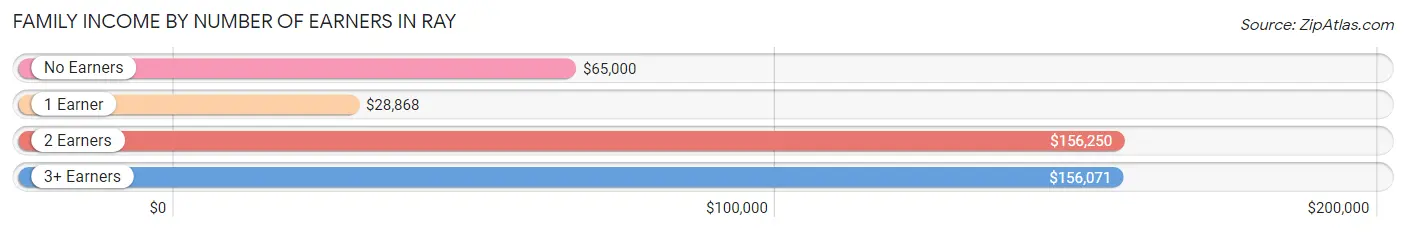
Family Income by Number of Earners in Ray
The median family income in Ray is $68,375, with families comprising 2 earners (89) having the highest median family income of $156,250, while families with 1 earner (74) have the lowest median family income of $28,868, accounting for 42.2% and 35.1% of families, respectively.
| Number of Earners | # Families | Median Income |
| No Earners | 34 (16.1%) | $65,000 |
| 1 Earner | 74 (35.1%) | $28,868 |
| 2 Earners | 89 (42.2%) | $156,250 |
| 3+ Earners | 14 (6.6%) | $156,071 |
| Total | 211 (100.0%) | $68,375 |
Household Income in Ray
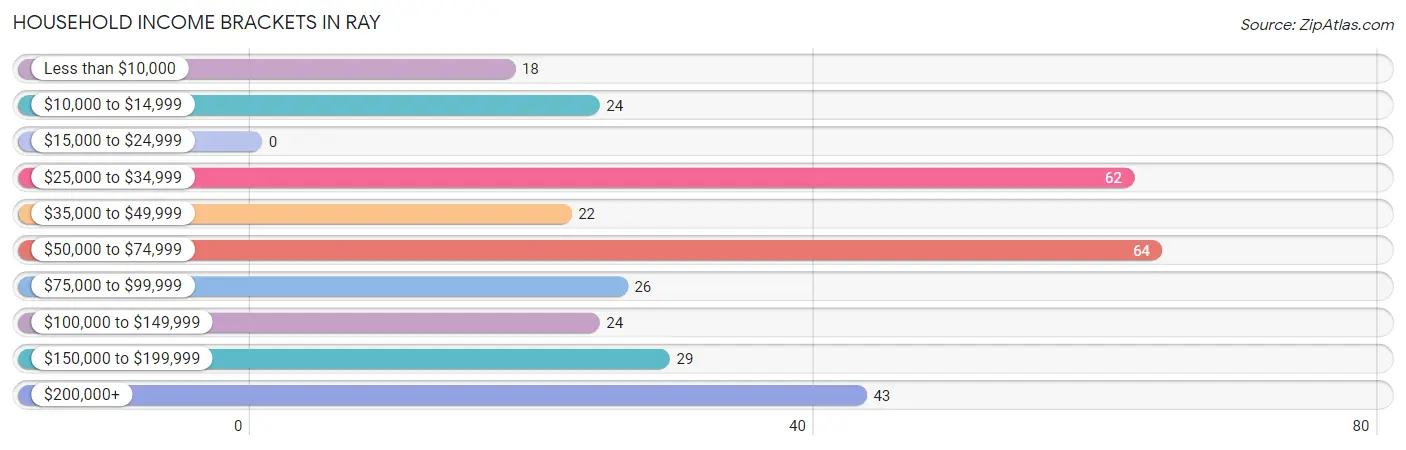
Household Income Brackets in Ray
With 64 households falling in the category, the $50,000 to $74,999 income range is the most frequent in Ray, accounting for 20.5% of all households.
| Income Bracket | # Households | % Households |
| Less than $10,000 | 18 | 5.8% |
| $10,000 to $14,999 | 24 | 7.7% |
| $15,000 to $24,999 | 0 | 0.0% |
| $25,000 to $34,999 | 62 | 19.9% |
| $35,000 to $49,999 | 22 | 7.1% |
| $50,000 to $74,999 | 64 | 20.5% |
| $75,000 to $99,999 | 26 | 8.3% |
| $100,000 to $149,999 | 24 | 7.7% |
| $150,000 to $199,999 | 29 | 9.3% |
| $200,000+ | 43 | 13.8% |
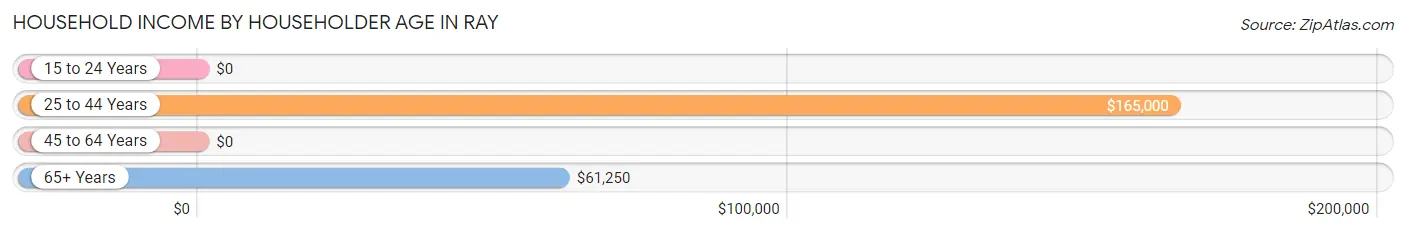
Household Income by Householder Age in Ray
The median household income in Ray is $65,208, with the highest median household income of $165,000 found in the 25 to 44 years age bracket for the primary householder. A total of 96 households (30.8%) fall into this category. Meanwhile, the 15 to 24 years age bracket for the primary householder has the lowest median household income of $0, with 56 households (17.9%) in this group.
| Income Bracket | # Households | Median Income |
| 15 to 24 Years | 56 (17.9%) | $0 |
| 25 to 44 Years | 96 (30.8%) | $165,000 |
| 45 to 64 Years | 50 (16.0%) | $0 |
| 65+ Years | 110 (35.3%) | $61,250 |
| Total | 312 (100.0%) | $65,208 |
Poverty in Ray
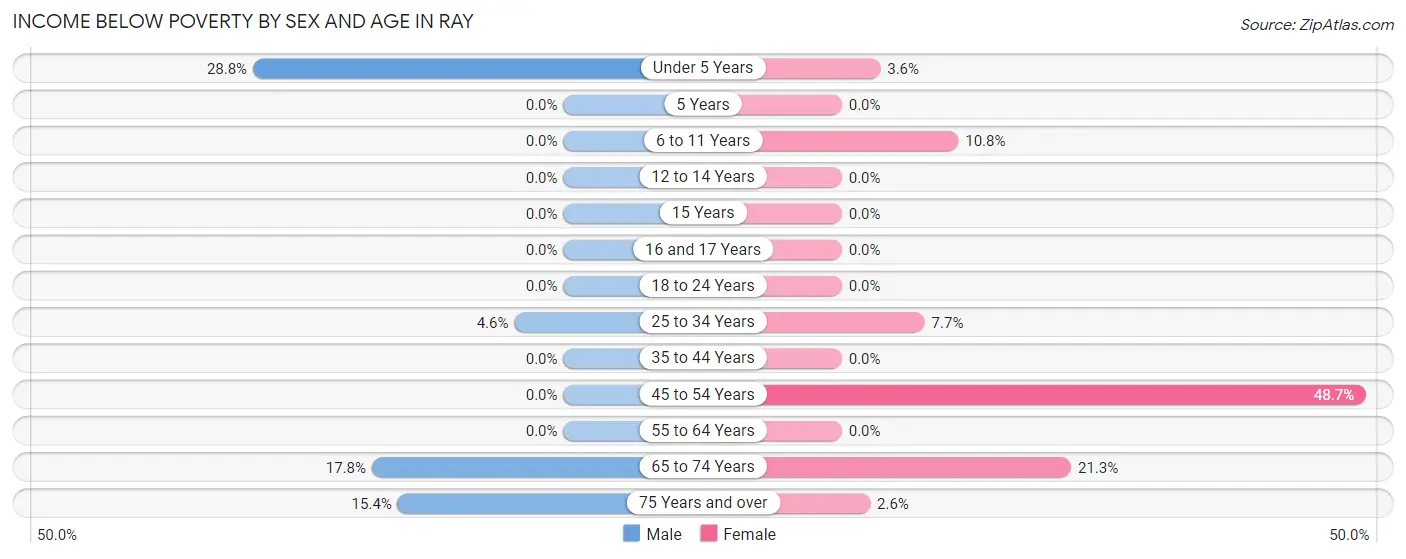
Income Below Poverty by Sex and Age in Ray
With 8.2% poverty level for males and 9.5% for females among the residents of Ray, under 5 year old males and 45 to 54 year old females are the most vulnerable to poverty, with 17 males (28.8%) and 18 females (48.6%) in their respective age groups living below the poverty level.
| Age Bracket | Male | Female |
| Under 5 Years | 17 (28.8%) | 1 (3.6%) |
| 5 Years | 0 (0.0%) | 0 (0.0%) |
| 6 to 11 Years | 0 (0.0%) | 4 (10.8%) |
| 12 to 14 Years | 0 (0.0%) | 0 (0.0%) |
| 15 Years | 0 (0.0%) | 0 (0.0%) |
| 16 and 17 Years | 0 (0.0%) | 0 (0.0%) |
| 18 to 24 Years | 0 (0.0%) | 0 (0.0%) |
| 25 to 34 Years | 2 (4.5%) | 3 (7.7%) |
| 35 to 44 Years | 0 (0.0%) | 0 (0.0%) |
| 45 to 54 Years | 0 (0.0%) | 18 (48.6%) |
| 55 to 64 Years | 0 (0.0%) | 0 (0.0%) |
| 65 to 74 Years | 8 (17.8%) | 10 (21.3%) |
| 75 Years and over | 4 (15.4%) | 1 (2.6%) |
| Total | 31 (8.2%) | 37 (9.5%) |
Income Above Poverty by Sex and Age in Ray
According to the poverty statistics in Ray, males aged 5 years and females aged 5 years are the age groups that are most secure financially, with 100.0% of males and 100.0% of females in these age groups living above the poverty line.
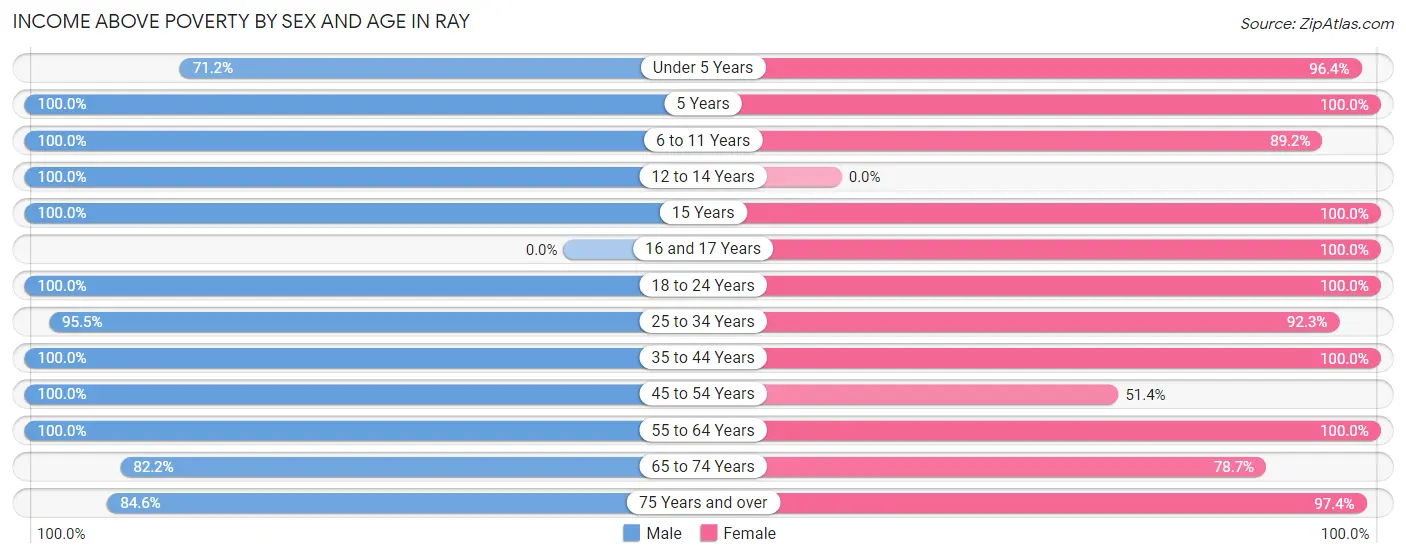
| Age Bracket | Male | Female |
| Under 5 Years | 42 (71.2%) | 27 (96.4%) |
| 5 Years | 24 (100.0%) | 3 (100.0%) |
| 6 to 11 Years | 57 (100.0%) | 33 (89.2%) |
| 12 to 14 Years | 12 (100.0%) | 0 (0.0%) |
| 15 Years | 6 (100.0%) | 11 (100.0%) |
| 16 and 17 Years | 0 (0.0%) | 19 (100.0%) |
| 18 to 24 Years | 6 (100.0%) | 70 (100.0%) |
| 25 to 34 Years | 42 (95.5%) | 36 (92.3%) |
| 35 to 44 Years | 72 (100.0%) | 45 (100.0%) |
| 45 to 54 Years | 16 (100.0%) | 19 (51.3%) |
| 55 to 64 Years | 13 (100.0%) | 14 (100.0%) |
| 65 to 74 Years | 37 (82.2%) | 37 (78.7%) |
| 75 Years and over | 22 (84.6%) | 37 (97.4%) |
| Total | 349 (91.8%) | 351 (90.5%) |
Income Below Poverty Among Married-Couple Families in Ray
The poverty statistics for married-couple families in Ray show that 1.5% or 2 of the total 131 families live below the poverty line. Families with 3 or 4 children have the highest poverty rate of 8.3%, comprising of 2 families. On the other hand, families with no children have the lowest poverty rate of 0.0%, which includes 0 families.
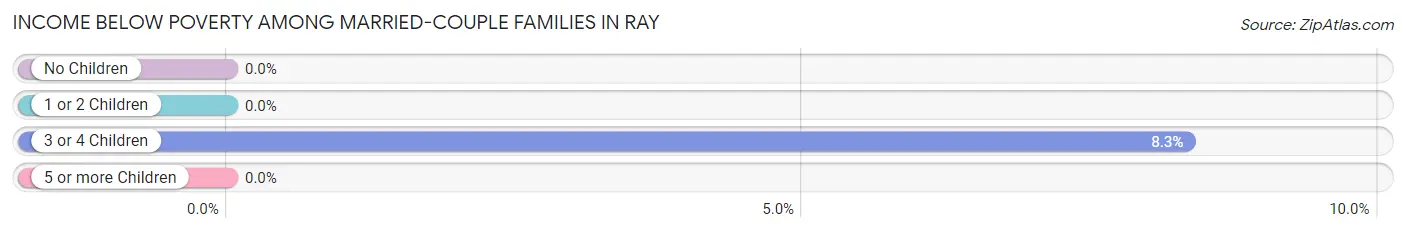
| Children | Above Poverty | Below Poverty |
| No Children | 56 (100.0%) | 0 (0.0%) |
| 1 or 2 Children | 48 (100.0%) | 0 (0.0%) |
| 3 or 4 Children | 22 (91.7%) | 2 (8.3%) |
| 5 or more Children | 3 (100.0%) | 0 (0.0%) |
| Total | 129 (98.5%) | 2 (1.5%) |
Income Below Poverty Among Single-Parent Households in Ray
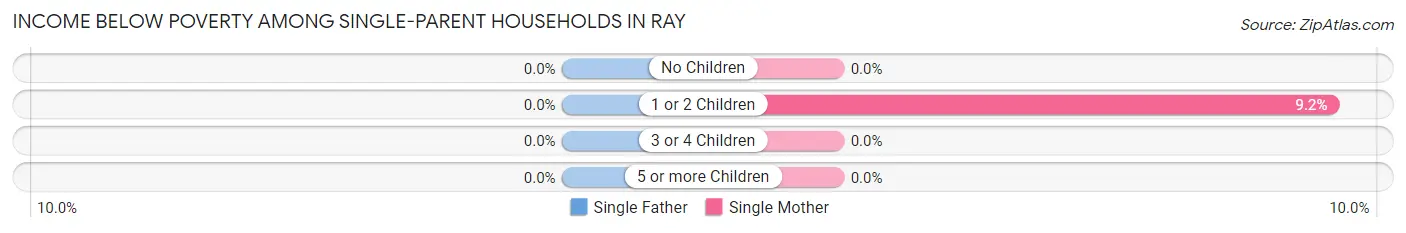
| Children | Single Father | Single Mother |
| No Children | 0 (0.0%) | 0 (0.0%) |
| 1 or 2 Children | 0 (0.0%) | 6 (9.2%) |
| 3 or 4 Children | 0 (0.0%) | 0 (0.0%) |
| 5 or more Children | 0 (0.0%) | 0 (0.0%) |
| Total | 0 (0.0%) | 6 (9.2%) |
Income Below Poverty Among Married-Couple vs Single-Parent Households in Ray
The poverty data for Ray shows that 2 of the married-couple family households (1.5%) and 6 of the single-parent households (7.5%) are living below the poverty level. Within the married-couple family households, those with 3 or 4 children have the highest poverty rate, with 2 households (8.3%) falling below the poverty line. Among the single-parent households, those with 1 or 2 children have the highest poverty rate, with 6 household (9.2%) living below poverty.
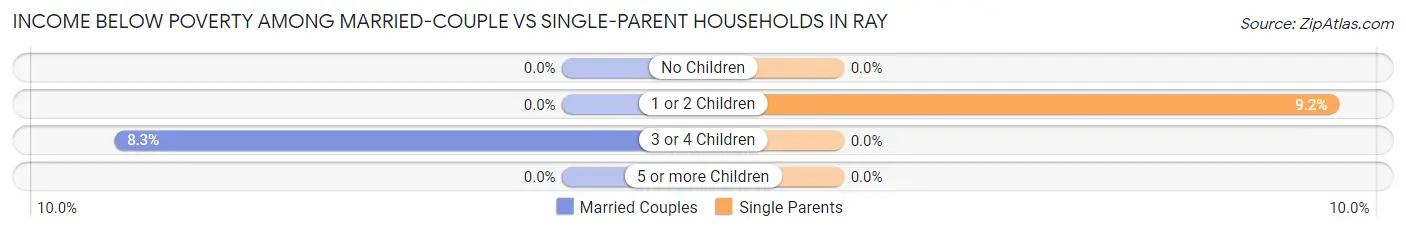
| Children | Married-Couple Families | Single-Parent Households |
| No Children | 0 (0.0%) | 0 (0.0%) |
| 1 or 2 Children | 0 (0.0%) | 6 (9.2%) |
| 3 or 4 Children | 2 (8.3%) | 0 (0.0%) |
| 5 or more Children | 0 (0.0%) | 0 (0.0%) |
| Total | 2 (1.5%) | 6 (7.5%) |
Employment Characteristics in Ray
Employment by Class of Employer in Ray
Among the 385 employed individuals in Ray, private company employees (250 | 64.9%), local government employees (51 | 13.3%), and not-for-profit organizations (39 | 10.1%) make up the most common classes of employment.
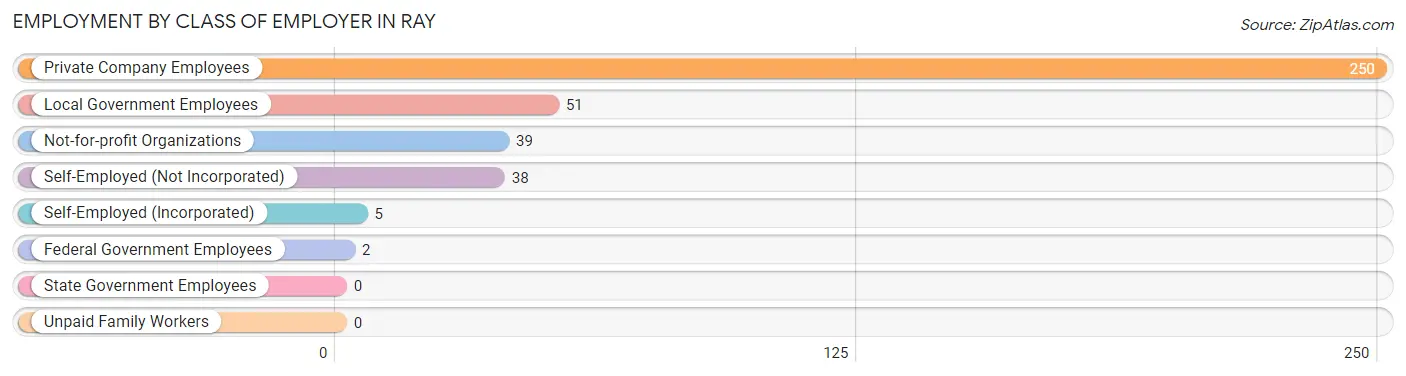
| Employer Class | # Employees | % Employees |
| Private Company Employees | 250 | 64.9% |
| Self-Employed (Incorporated) | 5 | 1.3% |
| Self-Employed (Not Incorporated) | 38 | 9.9% |
| Not-for-profit Organizations | 39 | 10.1% |
| Local Government Employees | 51 | 13.3% |
| State Government Employees | 0 | 0.0% |
| Federal Government Employees | 2 | 0.5% |
| Unpaid Family Workers | 0 | 0.0% |
| Total | 385 | 100.0% |
Employment Status by Age in Ray
According to the labor force statistics for Ray, out of the total population over 16 years of age (531), 72.7% or 386 individuals are in the labor force, with 0.3% or 1 of them unemployed. The age group with the highest labor force participation rate is 20 to 24 years, with 100.0% or 63 individuals in the labor force. Within the labor force, the 55 to 59 years age range has the highest percentage of unemployed individuals, with 4.3% or 1 of them being unemployed.
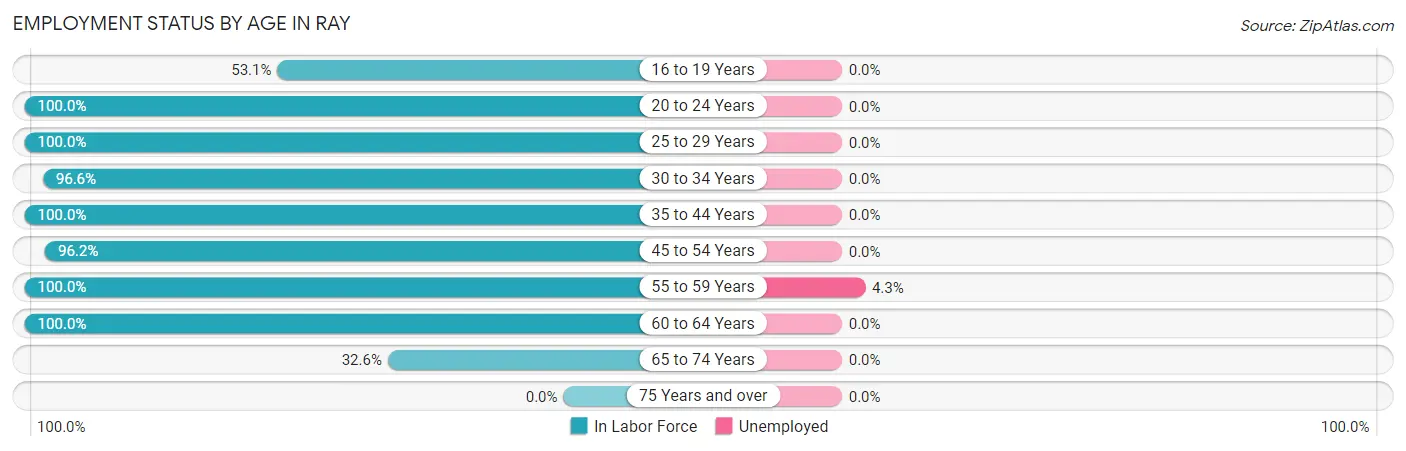
| Age Bracket | In Labor Force | Unemployed |
| 16 to 19 Years | 17 (53.1%) | 0 (0.0%) |
| 20 to 24 Years | 63 (100.0%) | 0 (0.0%) |
| 25 to 29 Years | 24 (100.0%) | 0 (0.0%) |
| 30 to 34 Years | 57 (96.6%) | 0 (0.0%) |
| 35 to 44 Years | 117 (100.0%) | 0 (0.0%) |
| 45 to 54 Years | 51 (96.2%) | 0 (0.0%) |
| 55 to 59 Years | 23 (100.0%) | 1 (4.3%) |
| 60 to 64 Years | 4 (100.0%) | 0 (0.0%) |
| 65 to 74 Years | 30 (32.6%) | 0 (0.0%) |
| 75 Years and over | 0 (0.0%) | 0 (0.0%) |
| Total | 386 (72.7%) | 1 (0.3%) |
Employment Status by Educational Attainment in Ray
According to labor force statistics for Ray, 98.6% of individuals (276) out of the total population between 25 and 64 years of age (280) are in the labor force, with 0.4% or 1 of them being unemployed. The group with the highest labor force participation rate are those with the educational attainment of college / associate degree, with 100.0% or 135 individuals in the labor force. Within the labor force, individuals with high school diploma education have the highest percentage of unemployment, with 2.2% or 1 of them being unemployed.

| Educational Attainment | In Labor Force | Unemployed |
| Less than High School | 34 (94.4%) | 0 (0.0%) |
| High School Diploma | 45 (95.7%) | 1 (2.2%) |
| College / Associate Degree | 135 (100.0%) | 0 (0.0%) |
| Bachelor's Degree or higher | 62 (100.0%) | 0 (0.0%) |
| Total | 276 (98.6%) | 1 (0.4%) |
Employment Occupations by Sex in Ray
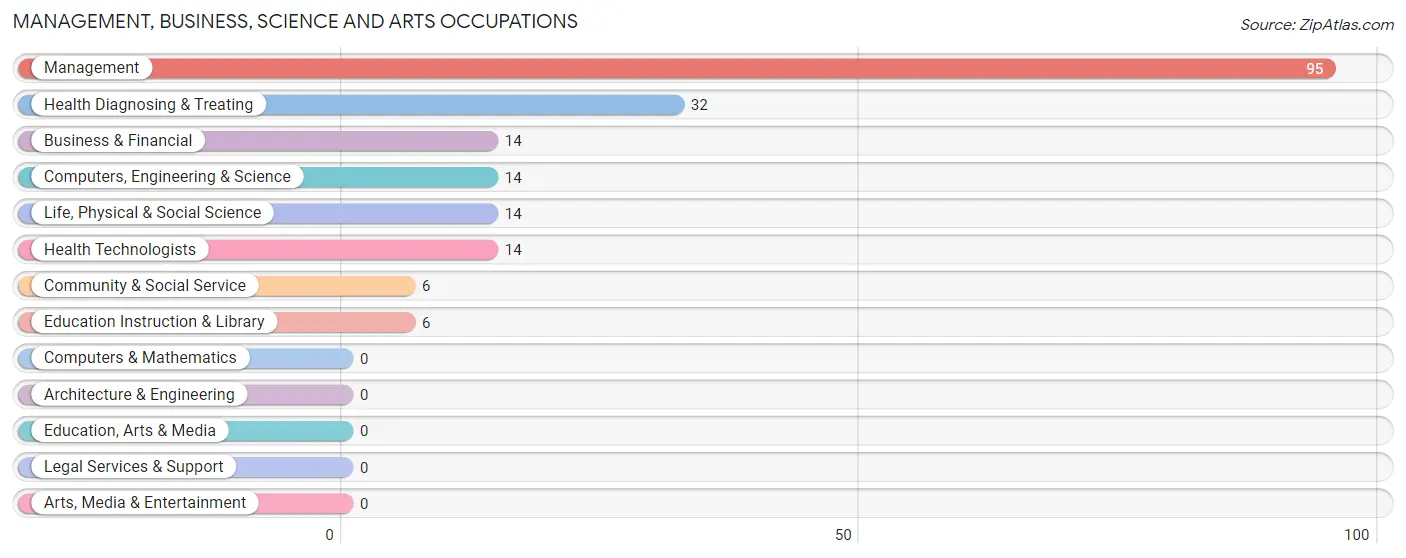
Management, Business, Science and Arts Occupations
The most common Management, Business, Science and Arts occupations in Ray are Management (95 | 24.8%), Health Diagnosing & Treating (32 | 8.4%), Business & Financial (14 | 3.7%), Computers, Engineering & Science (14 | 3.7%), and Life, Physical & Social Science (14 | 3.7%).
Management, Business, Science and Arts Occupations by Sex
Within the Management, Business, Science and Arts occupations in Ray, the most male-oriented occupations are Management (69.5%), Business & Financial (14.3%), and Health Diagnosing & Treating (9.4%), while the most female-oriented occupations are Computers, Engineering & Science (100.0%), Life, Physical & Social Science (100.0%), and Community & Social Service (100.0%).
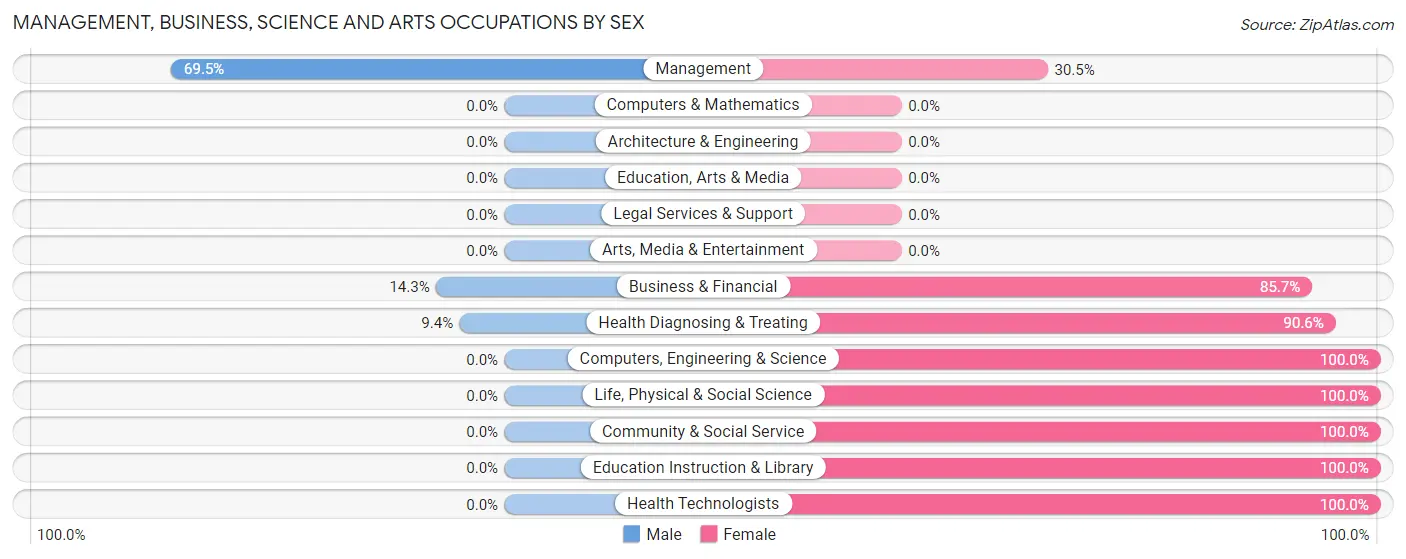
| Occupation | Male | Female |
| Management | 66 (69.5%) | 29 (30.5%) |
| Business & Financial | 2 (14.3%) | 12 (85.7%) |
| Computers, Engineering & Science | 0 (0.0%) | 14 (100.0%) |
| Computers & Mathematics | 0 (0.0%) | 0 (0.0%) |
| Architecture & Engineering | 0 (0.0%) | 0 (0.0%) |
| Life, Physical & Social Science | 0 (0.0%) | 14 (100.0%) |
| Community & Social Service | 0 (0.0%) | 6 (100.0%) |
| Education, Arts & Media | 0 (0.0%) | 0 (0.0%) |
| Legal Services & Support | 0 (0.0%) | 0 (0.0%) |
| Education Instruction & Library | 0 (0.0%) | 6 (100.0%) |
| Arts, Media & Entertainment | 0 (0.0%) | 0 (0.0%) |
| Health Diagnosing & Treating | 3 (9.4%) | 29 (90.6%) |
| Health Technologists | 0 (0.0%) | 14 (100.0%) |
| Total (Category) | 71 (44.1%) | 90 (55.9%) |
| Total (Overall) | 153 (40.0%) | 230 (60.1%) |
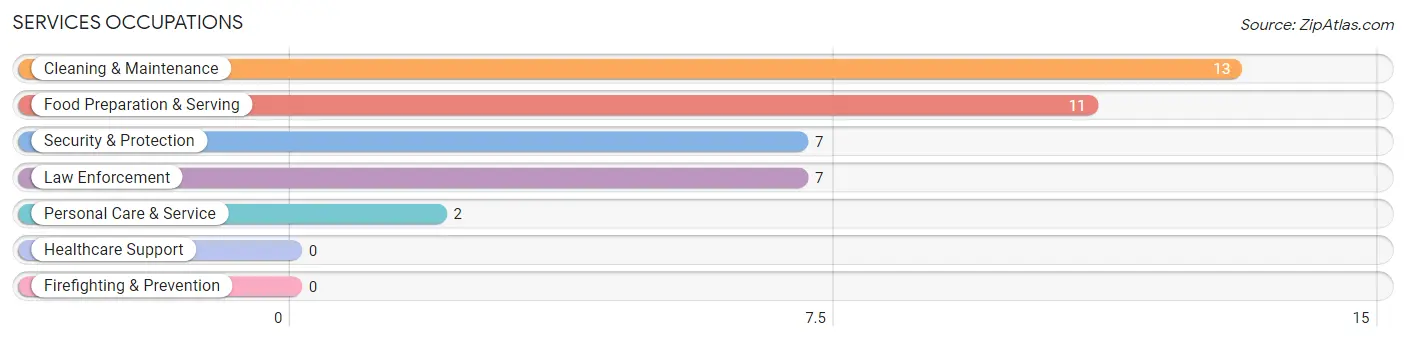
Services Occupations
The most common Services occupations in Ray are Cleaning & Maintenance (13 | 3.4%), Food Preparation & Serving (11 | 2.9%), Security & Protection (7 | 1.8%), Law Enforcement (7 | 1.8%), and Personal Care & Service (2 | 0.5%).
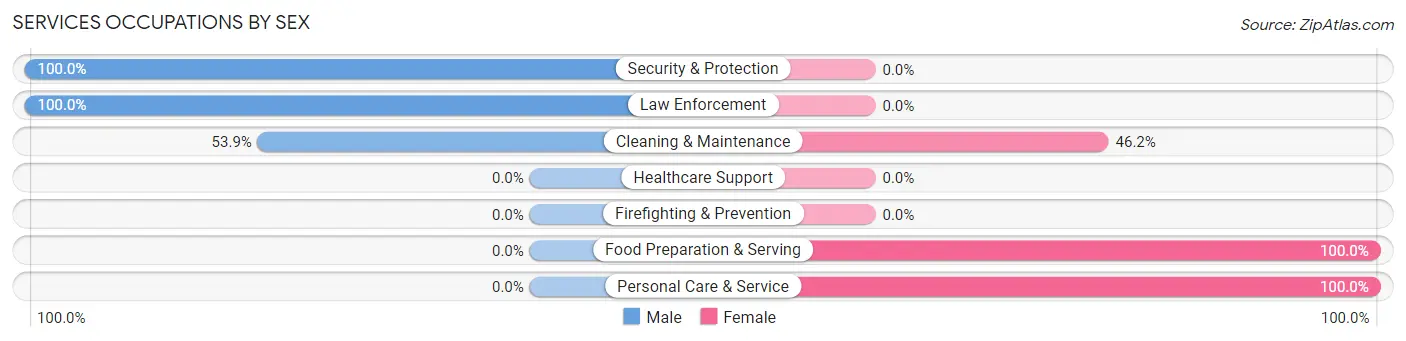
Services Occupations by Sex
Within the Services occupations in Ray, the most male-oriented occupations are Security & Protection (100.0%), Law Enforcement (100.0%), and Cleaning & Maintenance (53.8%), while the most female-oriented occupations are Food Preparation & Serving (100.0%), Personal Care & Service (100.0%), and Cleaning & Maintenance (46.2%).
| Occupation | Male | Female |
| Healthcare Support | 0 (0.0%) | 0 (0.0%) |
| Security & Protection | 7 (100.0%) | 0 (0.0%) |
| Firefighting & Prevention | 0 (0.0%) | 0 (0.0%) |
| Law Enforcement | 7 (100.0%) | 0 (0.0%) |
| Food Preparation & Serving | 0 (0.0%) | 11 (100.0%) |
| Cleaning & Maintenance | 7 (53.8%) | 6 (46.2%) |
| Personal Care & Service | 0 (0.0%) | 2 (100.0%) |
| Total (Category) | 14 (42.4%) | 19 (57.6%) |
| Total (Overall) | 153 (40.0%) | 230 (60.1%) |
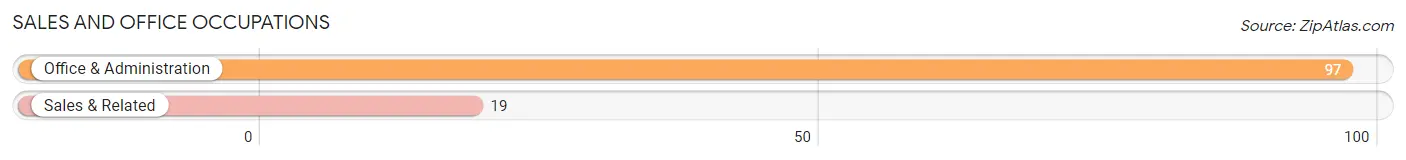
Sales and Office Occupations
The most common Sales and Office occupations in Ray are Office & Administration (97 | 25.3%), and Sales & Related (19 | 5.0%).
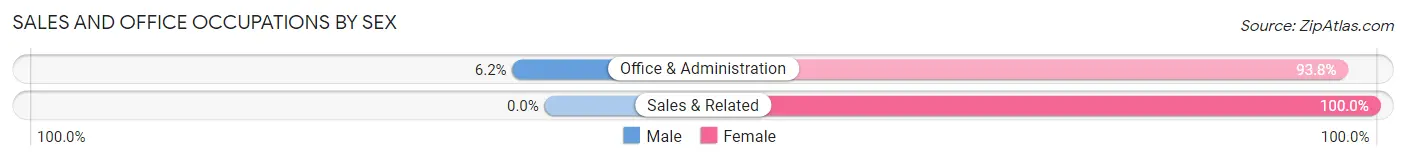
Sales and Office Occupations by Sex
| Occupation | Male | Female |
| Sales & Related | 0 (0.0%) | 19 (100.0%) |
| Office & Administration | 6 (6.2%) | 91 (93.8%) |
| Total (Category) | 6 (5.2%) | 110 (94.8%) |
| Total (Overall) | 153 (40.0%) | 230 (60.1%) |
Natural Resources, Construction and Maintenance Occupations
The most common Natural Resources, Construction and Maintenance occupations in Ray are Farming, Fishing & Forestry (14 | 3.7%), Installation, Maintenance & Repair (11 | 2.9%), and Construction & Extraction (8 | 2.1%).
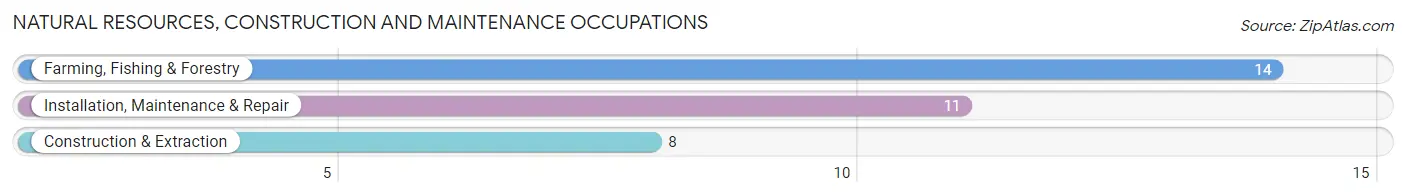
Natural Resources, Construction and Maintenance Occupations by Sex
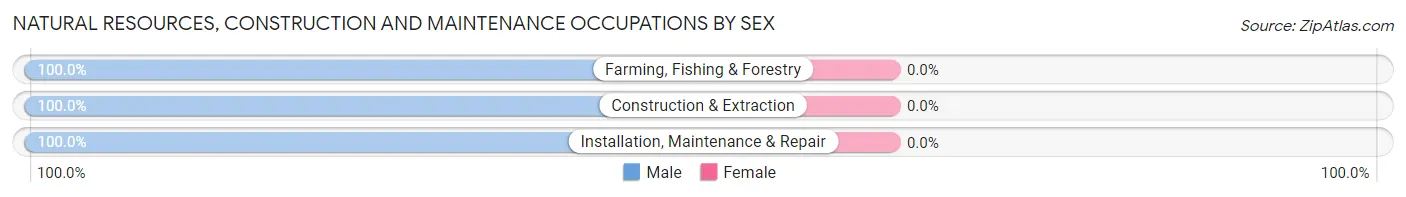
| Occupation | Male | Female |
| Farming, Fishing & Forestry | 14 (100.0%) | 0 (0.0%) |
| Construction & Extraction | 8 (100.0%) | 0 (0.0%) |
| Installation, Maintenance & Repair | 11 (100.0%) | 0 (0.0%) |
| Total (Category) | 33 (100.0%) | 0 (0.0%) |
| Total (Overall) | 153 (40.0%) | 230 (60.1%) |
Production, Transportation and Moving Occupations
The most common Production, Transportation and Moving occupations in Ray are Material Moving (24 | 6.3%), Transportation (9 | 2.4%), and Production (7 | 1.8%).
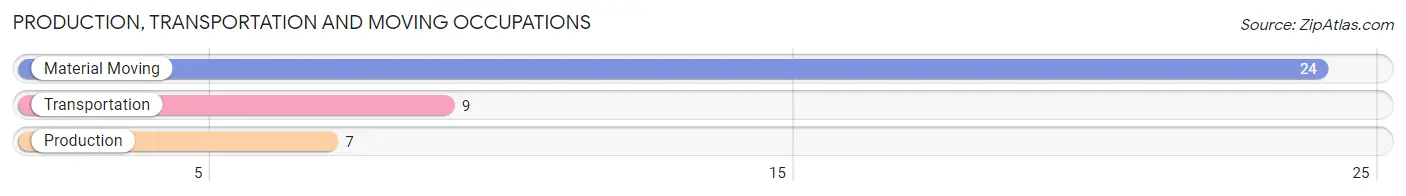
Production, Transportation and Moving Occupations by Sex
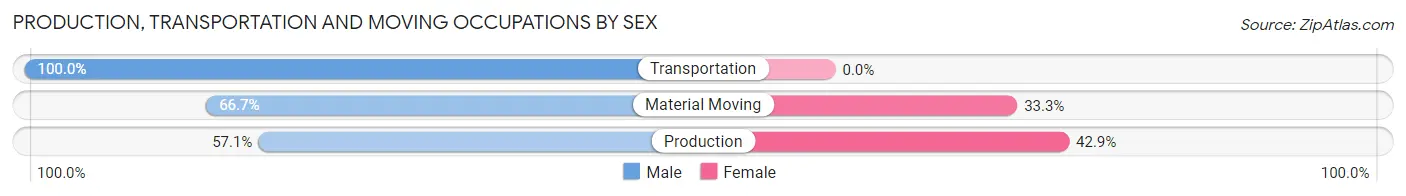
| Occupation | Male | Female |
| Production | 4 (57.1%) | 3 (42.9%) |
| Transportation | 9 (100.0%) | 0 (0.0%) |
| Material Moving | 16 (66.7%) | 8 (33.3%) |
| Total (Category) | 29 (72.5%) | 11 (27.5%) |
| Total (Overall) | 153 (40.0%) | 230 (60.1%) |
Employment Industries by Sex in Ray
Employment Industries in Ray
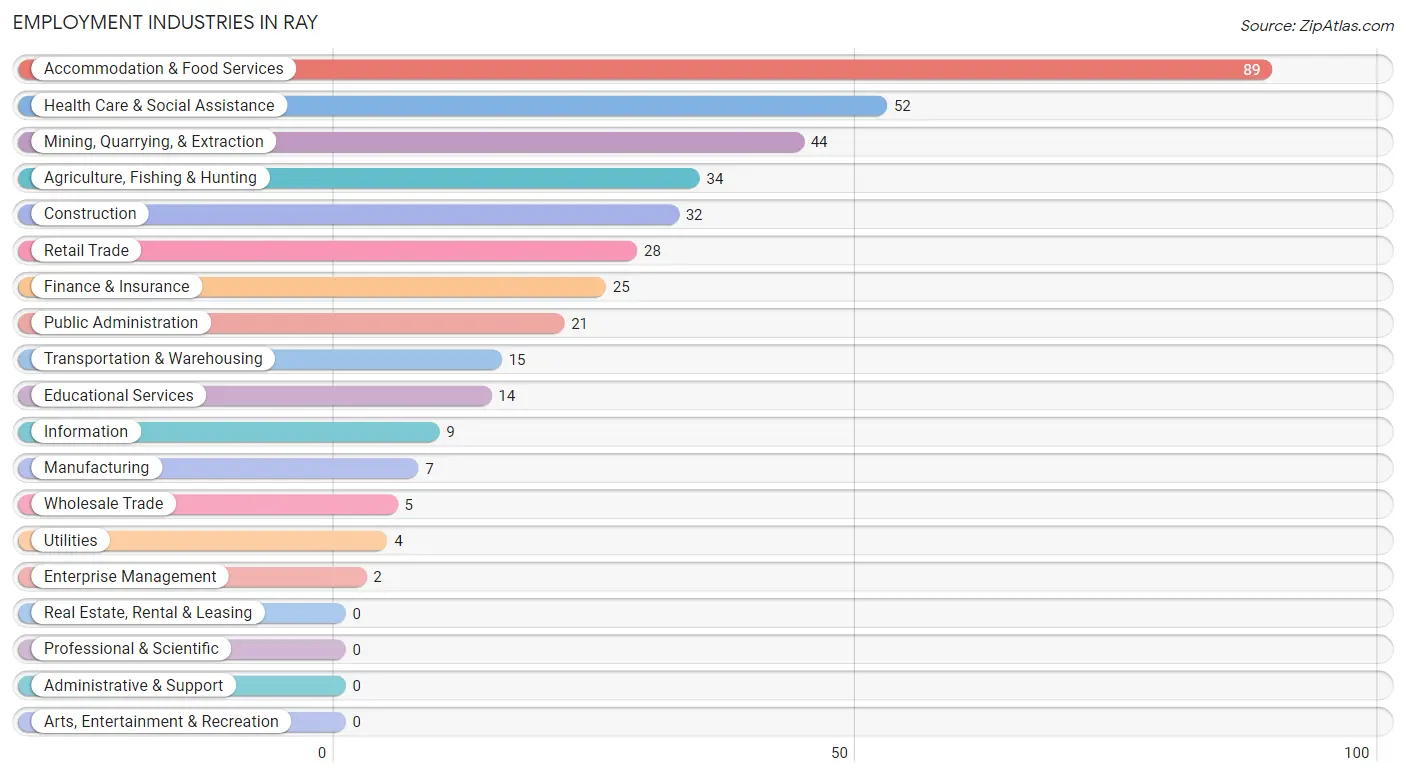
The major employment industries in Ray include Accommodation & Food Services (89 | 23.2%), Health Care & Social Assistance (52 | 13.6%), Mining, Quarrying, & Extraction (44 | 11.5%), Agriculture, Fishing & Hunting (34 | 8.9%), and Construction (32 | 8.4%).
Employment Industries by Sex in Ray
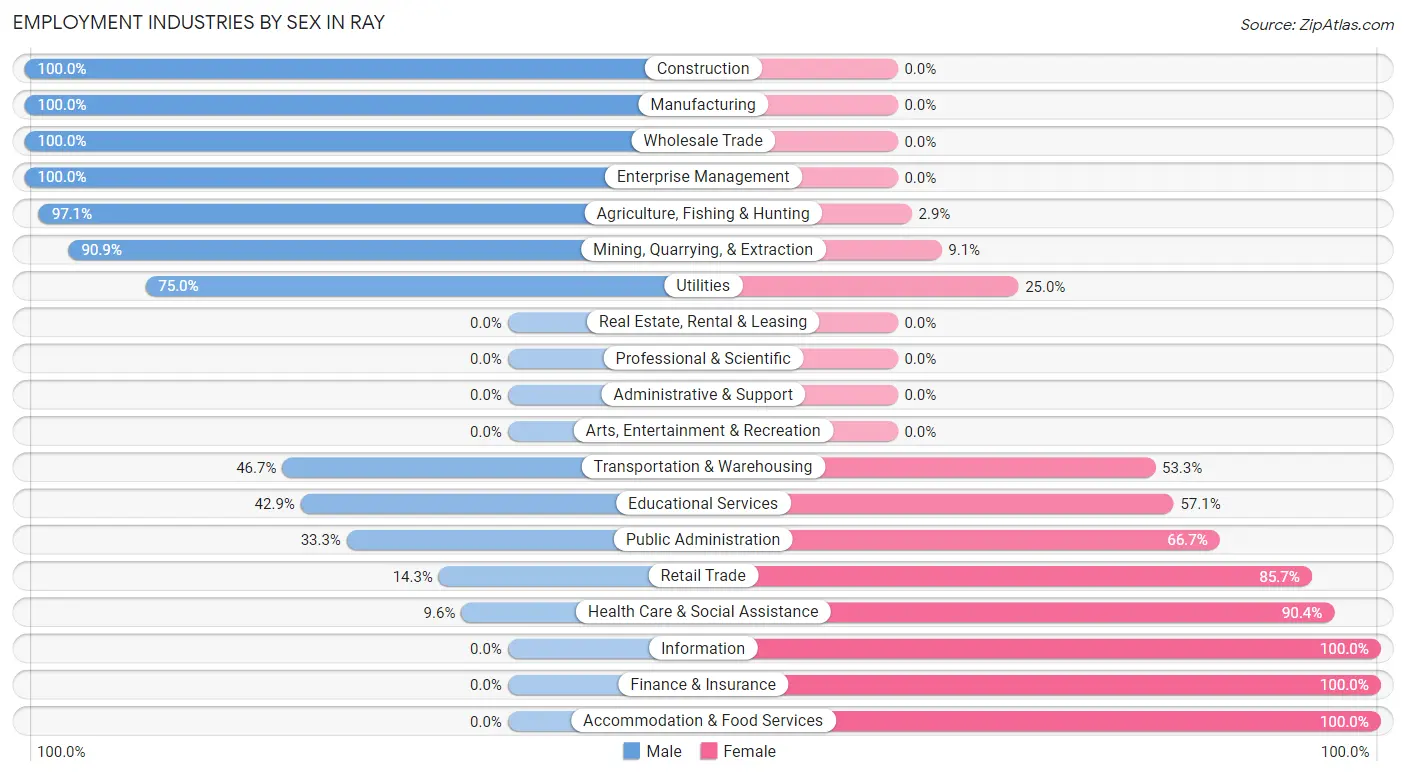
The Ray industries that see more men than women are Construction (100.0%), Manufacturing (100.0%), and Wholesale Trade (100.0%), whereas the industries that tend to have a higher number of women are Information (100.0%), Finance & Insurance (100.0%), and Accommodation & Food Services (100.0%).
| Industry | Male | Female |
| Agriculture, Fishing & Hunting | 33 (97.1%) | 1 (2.9%) |
| Mining, Quarrying, & Extraction | 40 (90.9%) | 4 (9.1%) |
| Construction | 32 (100.0%) | 0 (0.0%) |
| Manufacturing | 7 (100.0%) | 0 (0.0%) |
| Wholesale Trade | 5 (100.0%) | 0 (0.0%) |
| Retail Trade | 4 (14.3%) | 24 (85.7%) |
| Transportation & Warehousing | 7 (46.7%) | 8 (53.3%) |
| Utilities | 3 (75.0%) | 1 (25.0%) |
| Information | 0 (0.0%) | 9 (100.0%) |
| Finance & Insurance | 0 (0.0%) | 25 (100.0%) |
| Real Estate, Rental & Leasing | 0 (0.0%) | 0 (0.0%) |
| Professional & Scientific | 0 (0.0%) | 0 (0.0%) |
| Enterprise Management | 2 (100.0%) | 0 (0.0%) |
| Administrative & Support | 0 (0.0%) | 0 (0.0%) |
| Educational Services | 6 (42.9%) | 8 (57.1%) |
| Health Care & Social Assistance | 5 (9.6%) | 47 (90.4%) |
| Arts, Entertainment & Recreation | 0 (0.0%) | 0 (0.0%) |
| Accommodation & Food Services | 0 (0.0%) | 89 (100.0%) |
| Public Administration | 7 (33.3%) | 14 (66.7%) |
| Total | 153 (40.0%) | 230 (60.1%) |
Education in Ray
School Enrollment in Ray
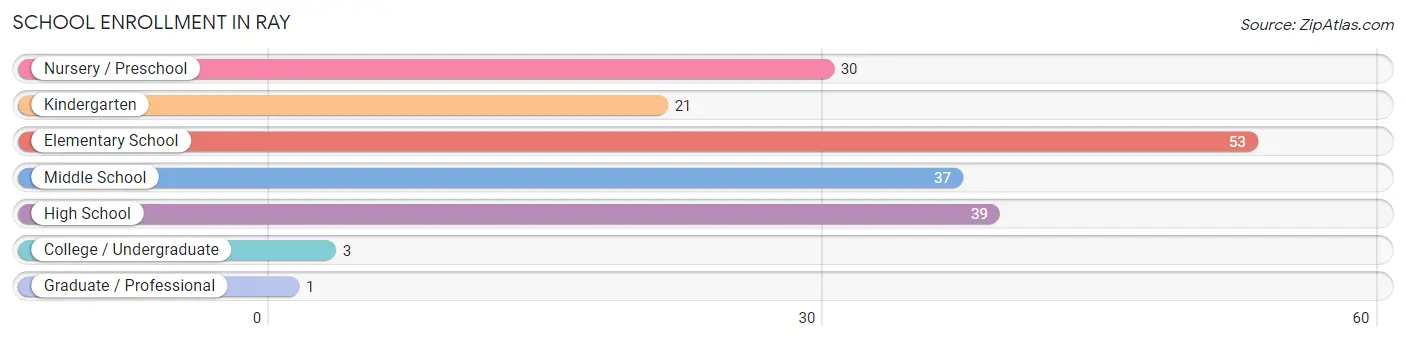
The most common levels of schooling among the 184 students in Ray are elementary school (53 | 28.8%), high school (39 | 21.2%), and middle school (37 | 20.1%).
| School Level | # Students | % Students |
| Nursery / Preschool | 30 | 16.3% |
| Kindergarten | 21 | 11.4% |
| Elementary School | 53 | 28.8% |
| Middle School | 37 | 20.1% |
| High School | 39 | 21.2% |
| College / Undergraduate | 3 | 1.6% |
| Graduate / Professional | 1 | 0.5% |
| Total | 184 | 100.0% |
School Enrollment by Age by Funding Source in Ray
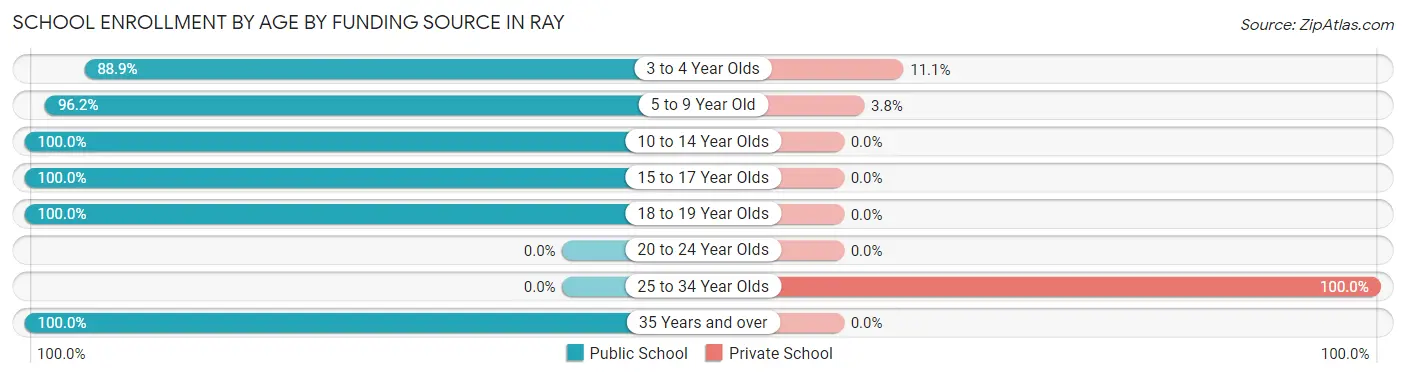
Out of a total of 184 students who are enrolled in schools in Ray, 8 (4.3%) attend a private institution, while the remaining 176 (95.7%) are enrolled in public schools. The age group of 25 to 34 year olds has the highest likelihood of being enrolled in private schools, with 3 (100.0% in the age bracket) enrolled. Conversely, the age group of 10 to 14 year olds has the lowest likelihood of being enrolled in a private school, with 44 (100.0% in the age bracket) attending a public institution.
| Age Bracket | Public School | Private School |
| 3 to 4 Year Olds | 16 (88.9%) | 2 (11.1%) |
| 5 to 9 Year Old | 76 (96.2%) | 3 (3.8%) |
| 10 to 14 Year Olds | 44 (100.0%) | 0 (0.0%) |
| 15 to 17 Year Olds | 30 (100.0%) | 0 (0.0%) |
| 18 to 19 Year Olds | 7 (100.0%) | 0 (0.0%) |
| 20 to 24 Year Olds | 0 (0.0%) | 0 (0.0%) |
| 25 to 34 Year Olds | 0 (0.0%) | 3 (100.0%) |
| 35 Years and over | 3 (100.0%) | 0 (0.0%) |
| Total | 176 (95.7%) | 8 (4.3%) |
Educational Attainment by Field of Study in Ray
Science & technology (19 | 21.8%), business (18 | 20.7%), education (12 | 13.8%), literature & languages (11 | 12.6%), and communications (11 | 12.6%) are the most common fields of study among 87 individuals in Ray who have obtained a bachelor's degree or higher.
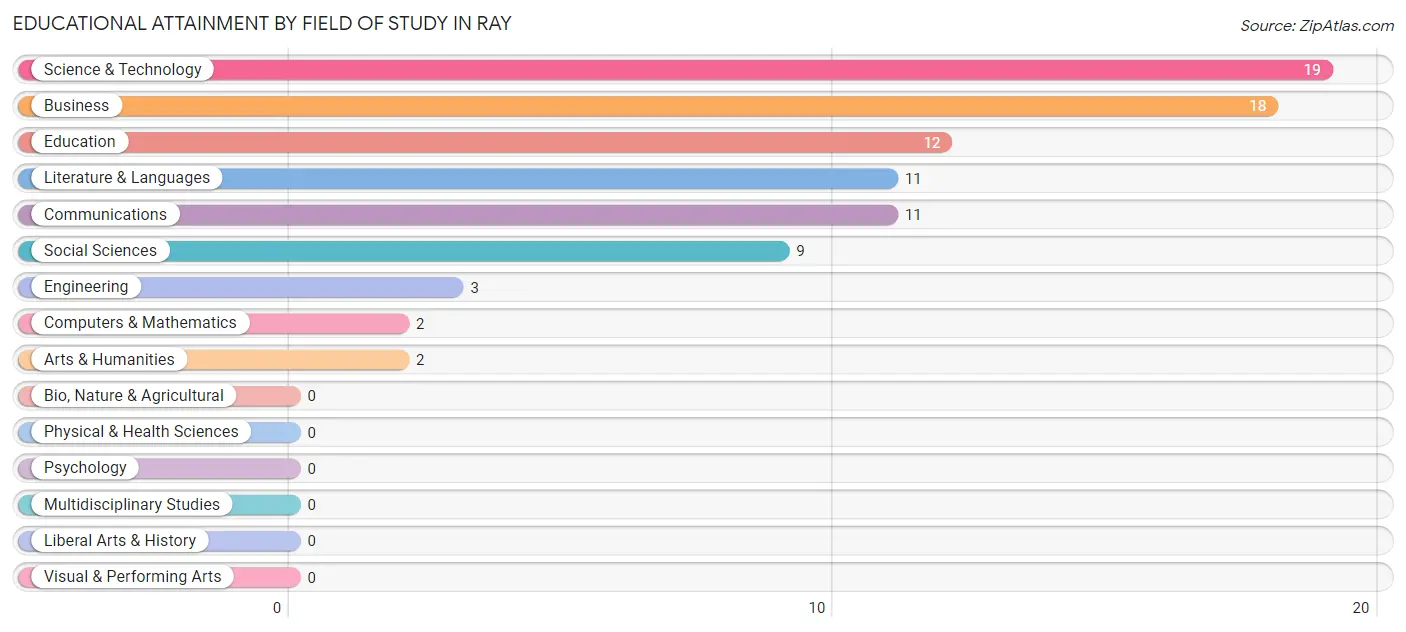
| Field of Study | # Graduates | % Graduates |
| Computers & Mathematics | 2 | 2.3% |
| Bio, Nature & Agricultural | 0 | 0.0% |
| Physical & Health Sciences | 0 | 0.0% |
| Psychology | 0 | 0.0% |
| Social Sciences | 9 | 10.3% |
| Engineering | 3 | 3.5% |
| Multidisciplinary Studies | 0 | 0.0% |
| Science & Technology | 19 | 21.8% |
| Business | 18 | 20.7% |
| Education | 12 | 13.8% |
| Literature & Languages | 11 | 12.6% |
| Liberal Arts & History | 0 | 0.0% |
| Visual & Performing Arts | 0 | 0.0% |
| Communications | 11 | 12.6% |
| Arts & Humanities | 2 | 2.3% |
| Total | 87 | 100.0% |
Transportation & Commute in Ray
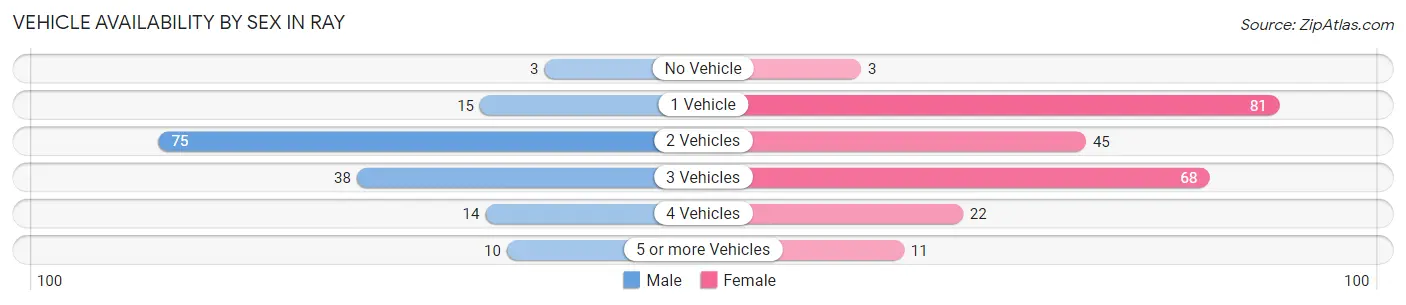
Vehicle Availability by Sex in Ray
The most prevalent vehicle ownership categories in Ray are males with 2 vehicles (75, accounting for 48.4%) and females with 2 vehicles (45, making up 32.6%).
| Vehicles Available | Male | Female |
| No Vehicle | 3 (1.9%) | 3 (1.3%) |
| 1 Vehicle | 15 (9.7%) | 81 (35.2%) |
| 2 Vehicles | 75 (48.4%) | 45 (19.6%) |
| 3 Vehicles | 38 (24.5%) | 68 (29.6%) |
| 4 Vehicles | 14 (9.0%) | 22 (9.6%) |
| 5 or more Vehicles | 10 (6.5%) | 11 (4.8%) |
| Total | 155 (100.0%) | 230 (100.0%) |
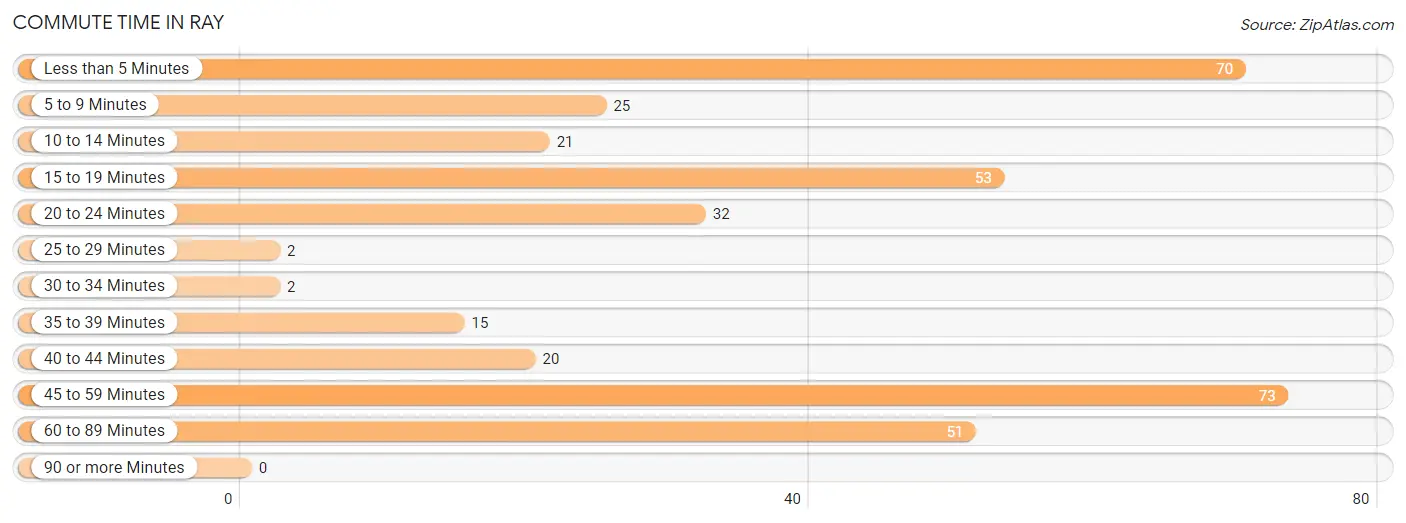
Commute Time in Ray
The most frequently occuring commute durations in Ray are 45 to 59 minutes (73 commuters, 20.1%), less than 5 minutes (70 commuters, 19.2%), and 15 to 19 minutes (53 commuters, 14.6%).
| Commute Time | # Commuters | % Commuters |
| Less than 5 Minutes | 70 | 19.2% |
| 5 to 9 Minutes | 25 | 6.9% |
| 10 to 14 Minutes | 21 | 5.8% |
| 15 to 19 Minutes | 53 | 14.6% |
| 20 to 24 Minutes | 32 | 8.8% |
| 25 to 29 Minutes | 2 | 0.5% |
| 30 to 34 Minutes | 2 | 0.5% |
| 35 to 39 Minutes | 15 | 4.1% |
| 40 to 44 Minutes | 20 | 5.5% |
| 45 to 59 Minutes | 73 | 20.1% |
| 60 to 89 Minutes | 51 | 14.0% |
| 90 or more Minutes | 0 | 0.0% |
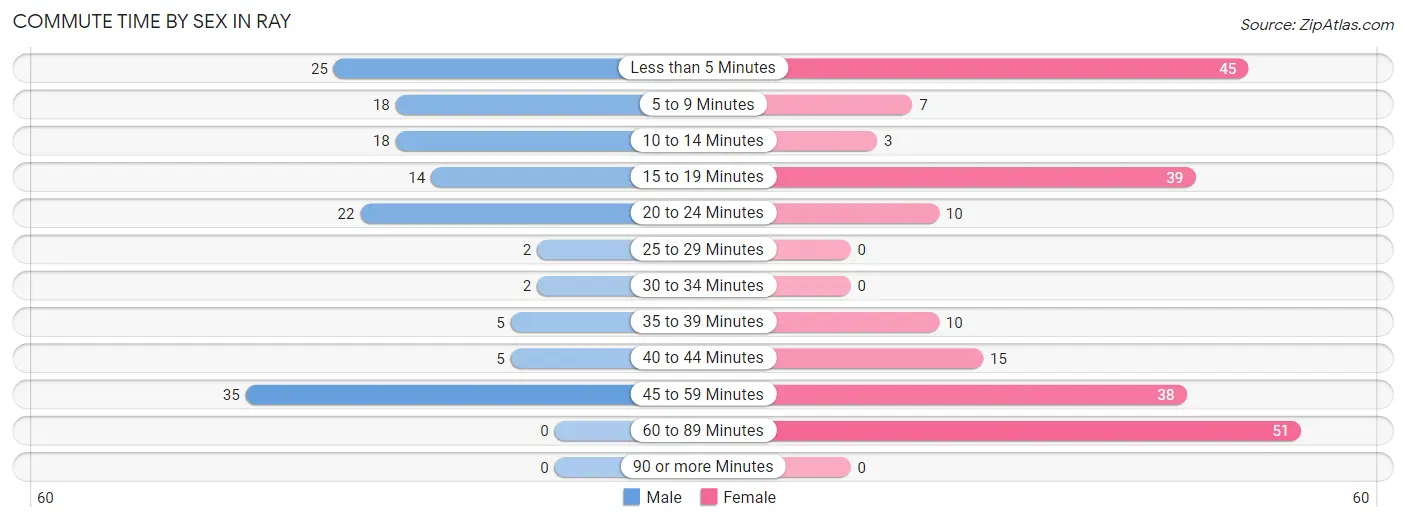
Commute Time by Sex in Ray
The most common commute times in Ray are 45 to 59 minutes (35 commuters, 24.0%) for males and 60 to 89 minutes (51 commuters, 23.4%) for females.
| Commute Time | Male | Female |
| Less than 5 Minutes | 25 (17.1%) | 45 (20.6%) |
| 5 to 9 Minutes | 18 (12.3%) | 7 (3.2%) |
| 10 to 14 Minutes | 18 (12.3%) | 3 (1.4%) |
| 15 to 19 Minutes | 14 (9.6%) | 39 (17.9%) |
| 20 to 24 Minutes | 22 (15.1%) | 10 (4.6%) |
| 25 to 29 Minutes | 2 (1.4%) | 0 (0.0%) |
| 30 to 34 Minutes | 2 (1.4%) | 0 (0.0%) |
| 35 to 39 Minutes | 5 (3.4%) | 10 (4.6%) |
| 40 to 44 Minutes | 5 (3.4%) | 15 (6.9%) |
| 45 to 59 Minutes | 35 (24.0%) | 38 (17.4%) |
| 60 to 89 Minutes | 0 (0.0%) | 51 (23.4%) |
| 90 or more Minutes | 0 (0.0%) | 0 (0.0%) |
Time of Departure to Work by Sex in Ray
The most frequent times of departure to work in Ray are 7:00 AM to 7:29 AM (51, 34.9%) for males and 4:00 PM to 11:59 PM (62, 28.4%) for females.
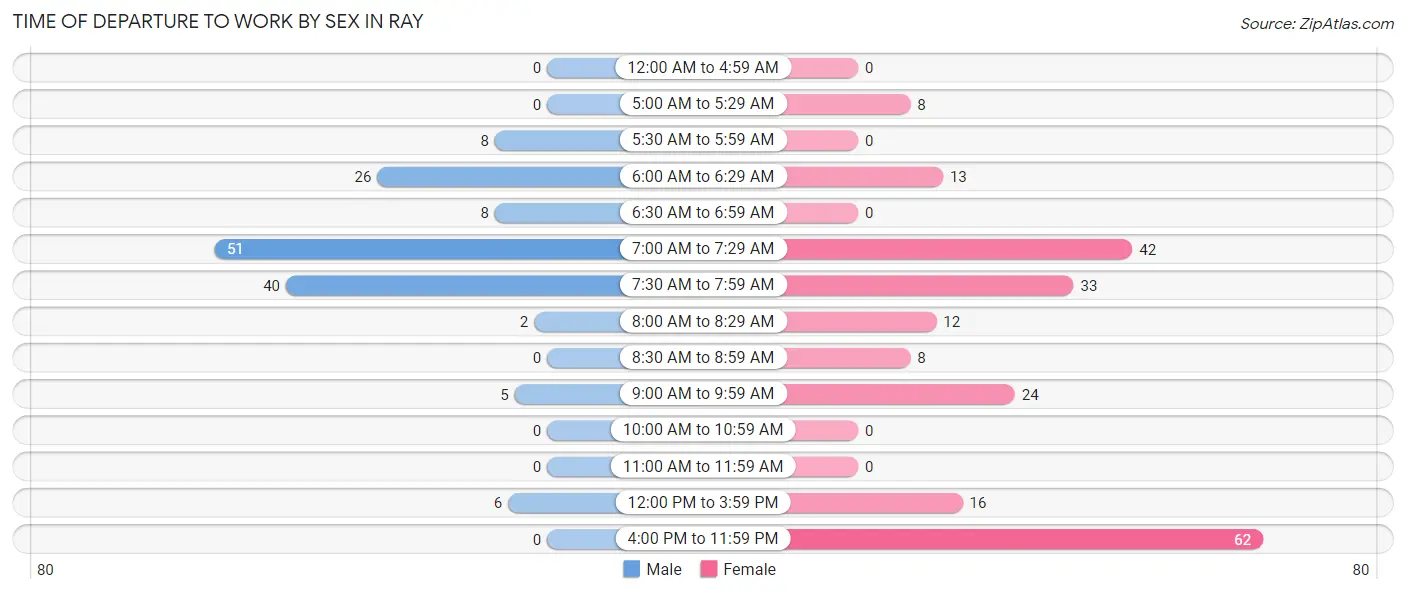
| Time of Departure | Male | Female |
| 12:00 AM to 4:59 AM | 0 (0.0%) | 0 (0.0%) |
| 5:00 AM to 5:29 AM | 0 (0.0%) | 8 (3.7%) |
| 5:30 AM to 5:59 AM | 8 (5.5%) | 0 (0.0%) |
| 6:00 AM to 6:29 AM | 26 (17.8%) | 13 (6.0%) |
| 6:30 AM to 6:59 AM | 8 (5.5%) | 0 (0.0%) |
| 7:00 AM to 7:29 AM | 51 (34.9%) | 42 (19.3%) |
| 7:30 AM to 7:59 AM | 40 (27.4%) | 33 (15.1%) |
| 8:00 AM to 8:29 AM | 2 (1.4%) | 12 (5.5%) |
| 8:30 AM to 8:59 AM | 0 (0.0%) | 8 (3.7%) |
| 9:00 AM to 9:59 AM | 5 (3.4%) | 24 (11.0%) |
| 10:00 AM to 10:59 AM | 0 (0.0%) | 0 (0.0%) |
| 11:00 AM to 11:59 AM | 0 (0.0%) | 0 (0.0%) |
| 12:00 PM to 3:59 PM | 6 (4.1%) | 16 (7.3%) |
| 4:00 PM to 11:59 PM | 0 (0.0%) | 62 (28.4%) |
| Total | 146 (100.0%) | 218 (100.0%) |
Housing Occupancy in Ray
Occupancy by Ownership in Ray
Of the total 312 dwellings in Ray, owner-occupied units account for 190 (60.9%), while renter-occupied units make up 122 (39.1%).
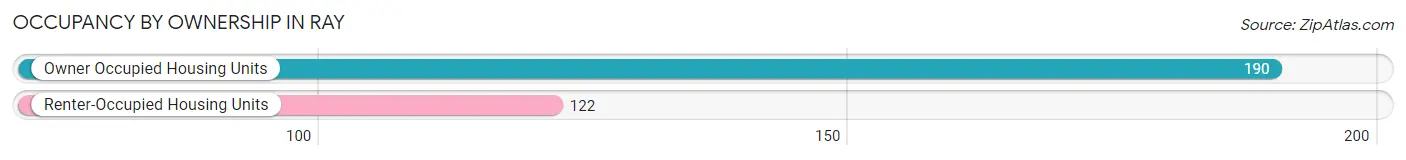
| Occupancy | # Housing Units | % Housing Units |
| Owner Occupied Housing Units | 190 | 60.9% |
| Renter-Occupied Housing Units | 122 | 39.1% |
| Total Occupied Housing Units | 312 | 100.0% |
Occupancy by Household Size in Ray
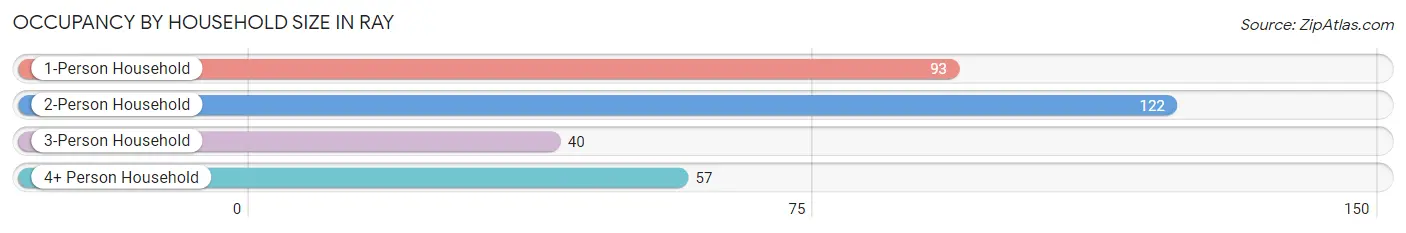
| Household Size | # Housing Units | % Housing Units |
| 1-Person Household | 93 | 29.8% |
| 2-Person Household | 122 | 39.1% |
| 3-Person Household | 40 | 12.8% |
| 4+ Person Household | 57 | 18.3% |
| Total Housing Units | 312 | 100.0% |
Occupancy by Ownership by Household Size in Ray
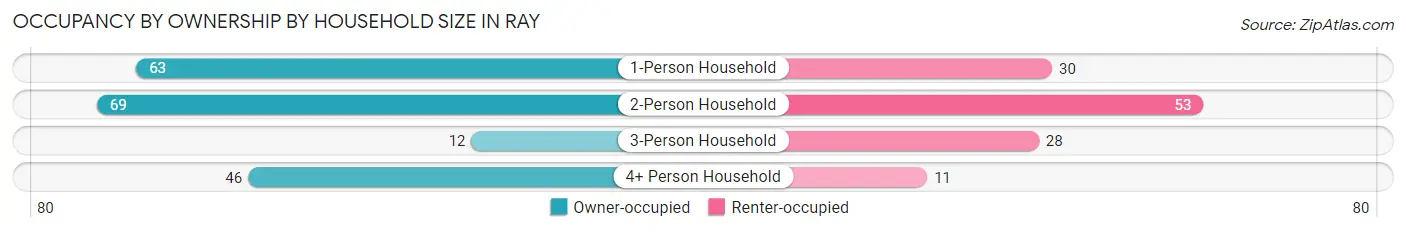
| Household Size | Owner-occupied | Renter-occupied |
| 1-Person Household | 63 (67.7%) | 30 (32.3%) |
| 2-Person Household | 69 (56.6%) | 53 (43.4%) |
| 3-Person Household | 12 (30.0%) | 28 (70.0%) |
| 4+ Person Household | 46 (80.7%) | 11 (19.3%) |
| Total Housing Units | 190 (60.9%) | 122 (39.1%) |
Occupancy by Educational Attainment in Ray
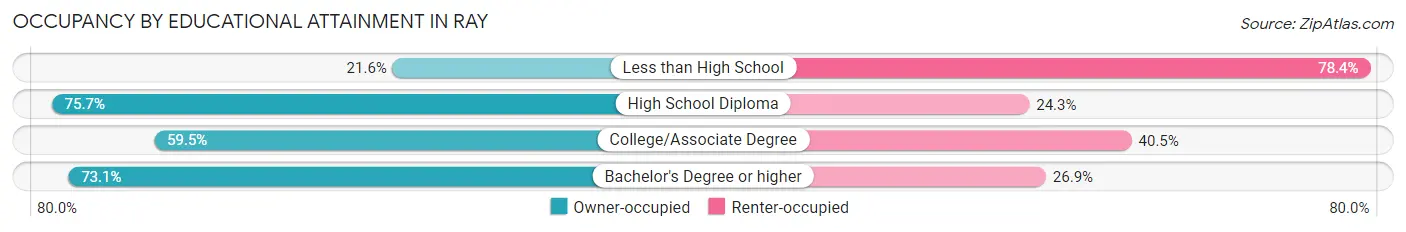
| Household Size | Owner-occupied | Renter-occupied |
| Less than High School | 8 (21.6%) | 29 (78.4%) |
| High School Diploma | 53 (75.7%) | 17 (24.3%) |
| College/Associate Degree | 91 (59.5%) | 62 (40.5%) |
| Bachelor's Degree or higher | 38 (73.1%) | 14 (26.9%) |
Occupancy by Age of Householder in Ray
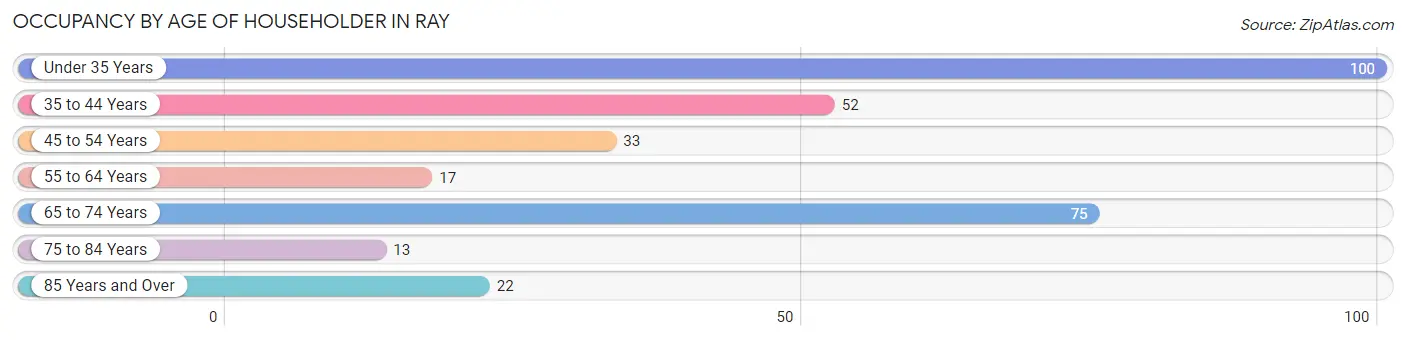
| Age Bracket | # Households | % Households |
| Under 35 Years | 100 | 32.1% |
| 35 to 44 Years | 52 | 16.7% |
| 45 to 54 Years | 33 | 10.6% |
| 55 to 64 Years | 17 | 5.4% |
| 65 to 74 Years | 75 | 24.0% |
| 75 to 84 Years | 13 | 4.2% |
| 85 Years and Over | 22 | 7.0% |
| Total | 312 | 100.0% |
Housing Finances in Ray
Median Income by Occupancy in Ray

| Occupancy Type | # Households | Median Income |
| Owner-Occupied | 190 (60.9%) | $68,889 |
| Renter-Occupied | 122 (39.1%) | $0 |
| Average | 312 (100.0%) | $65,208 |
Occupancy by Householder Income Bracket in Ray
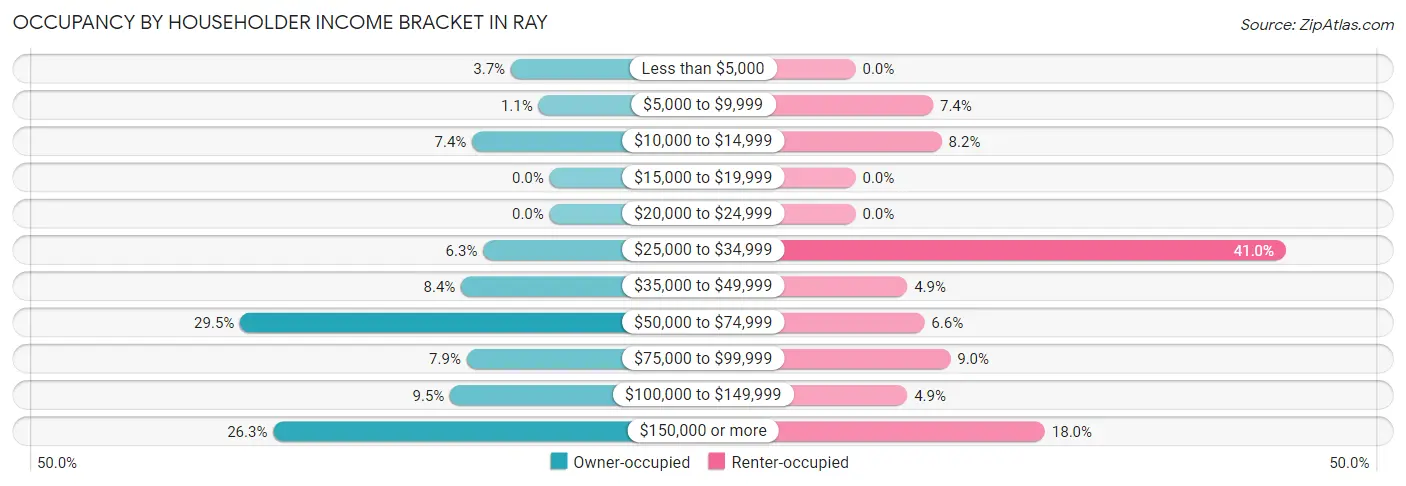
| Income Bracket | Owner-occupied | Renter-occupied |
| Less than $5,000 | 7 (3.7%) | 0 (0.0%) |
| $5,000 to $9,999 | 2 (1.1%) | 9 (7.4%) |
| $10,000 to $14,999 | 14 (7.4%) | 10 (8.2%) |
| $15,000 to $19,999 | 0 (0.0%) | 0 (0.0%) |
| $20,000 to $24,999 | 0 (0.0%) | 0 (0.0%) |
| $25,000 to $34,999 | 12 (6.3%) | 50 (41.0%) |
| $35,000 to $49,999 | 16 (8.4%) | 6 (4.9%) |
| $50,000 to $74,999 | 56 (29.5%) | 8 (6.6%) |
| $75,000 to $99,999 | 15 (7.9%) | 11 (9.0%) |
| $100,000 to $149,999 | 18 (9.5%) | 6 (4.9%) |
| $150,000 or more | 50 (26.3%) | 22 (18.0%) |
| Total | 190 (100.0%) | 122 (100.0%) |
Monthly Housing Cost Tiers in Ray
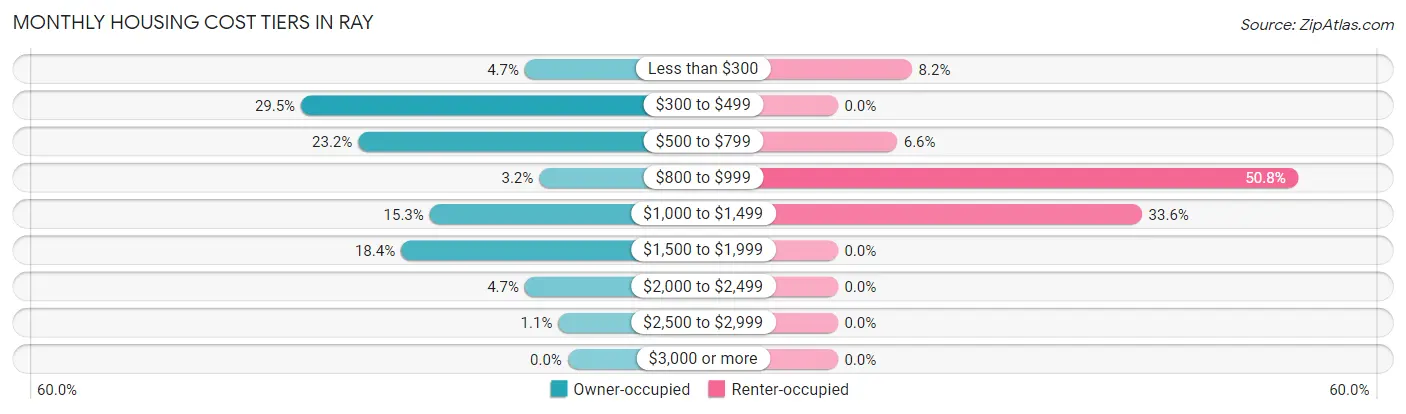
| Monthly Cost | Owner-occupied | Renter-occupied |
| Less than $300 | 9 (4.7%) | 10 (8.2%) |
| $300 to $499 | 56 (29.5%) | 0 (0.0%) |
| $500 to $799 | 44 (23.2%) | 8 (6.6%) |
| $800 to $999 | 6 (3.2%) | 62 (50.8%) |
| $1,000 to $1,499 | 29 (15.3%) | 41 (33.6%) |
| $1,500 to $1,999 | 35 (18.4%) | 0 (0.0%) |
| $2,000 to $2,499 | 9 (4.7%) | 0 (0.0%) |
| $2,500 to $2,999 | 2 (1.1%) | 0 (0.0%) |
| $3,000 or more | 0 (0.0%) | 0 (0.0%) |
| Total | 190 (100.0%) | 122 (100.0%) |
Physical Housing Characteristics in Ray
Housing Structures in Ray
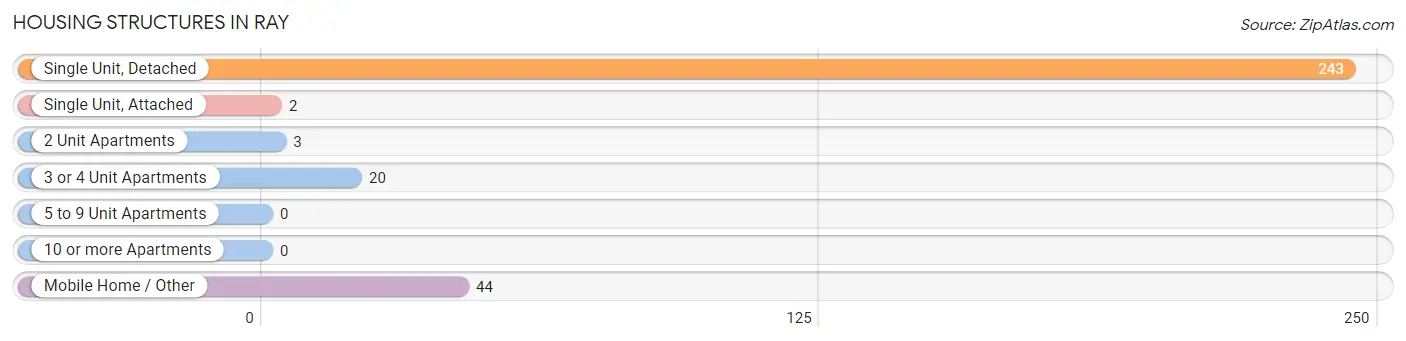
| Structure Type | # Housing Units | % Housing Units |
| Single Unit, Detached | 243 | 77.9% |
| Single Unit, Attached | 2 | 0.6% |
| 2 Unit Apartments | 3 | 1.0% |
| 3 or 4 Unit Apartments | 20 | 6.4% |
| 5 to 9 Unit Apartments | 0 | 0.0% |
| 10 or more Apartments | 0 | 0.0% |
| Mobile Home / Other | 44 | 14.1% |
| Total | 312 | 100.0% |
Housing Structures by Occupancy in Ray
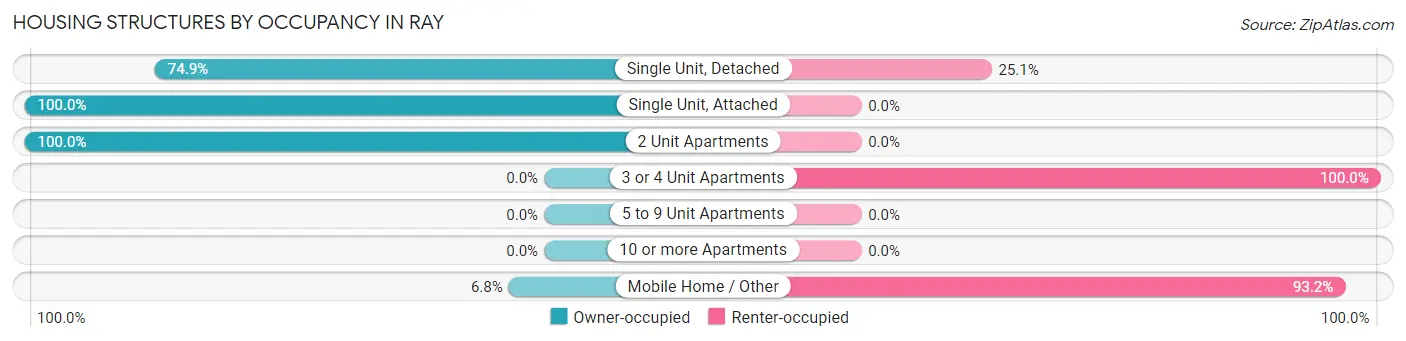
| Structure Type | Owner-occupied | Renter-occupied |
| Single Unit, Detached | 182 (74.9%) | 61 (25.1%) |
| Single Unit, Attached | 2 (100.0%) | 0 (0.0%) |
| 2 Unit Apartments | 3 (100.0%) | 0 (0.0%) |
| 3 or 4 Unit Apartments | 0 (0.0%) | 20 (100.0%) |
| 5 to 9 Unit Apartments | 0 (0.0%) | 0 (0.0%) |
| 10 or more Apartments | 0 (0.0%) | 0 (0.0%) |
| Mobile Home / Other | 3 (6.8%) | 41 (93.2%) |
| Total | 190 (60.9%) | 122 (39.1%) |
Housing Structures by Number of Rooms in Ray
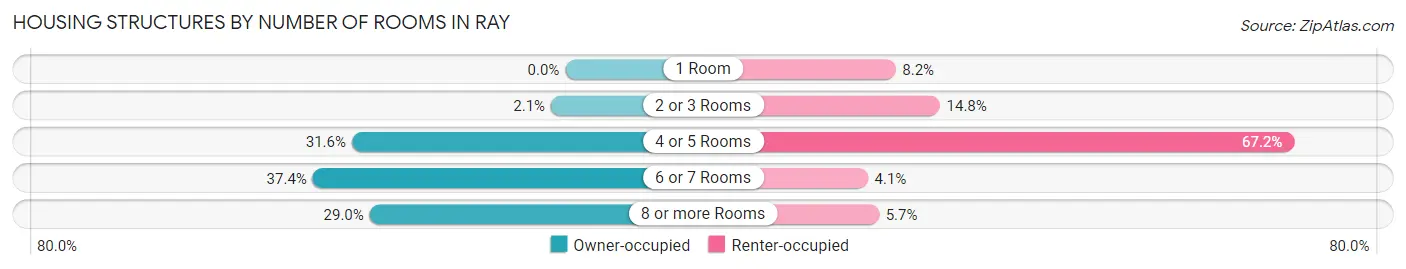
| Number of Rooms | Owner-occupied | Renter-occupied |
| 1 Room | 0 (0.0%) | 10 (8.2%) |
| 2 or 3 Rooms | 4 (2.1%) | 18 (14.7%) |
| 4 or 5 Rooms | 60 (31.6%) | 82 (67.2%) |
| 6 or 7 Rooms | 71 (37.4%) | 5 (4.1%) |
| 8 or more Rooms | 55 (28.9%) | 7 (5.7%) |
| Total | 190 (100.0%) | 122 (100.0%) |
Housing Structure by Heating Type in Ray
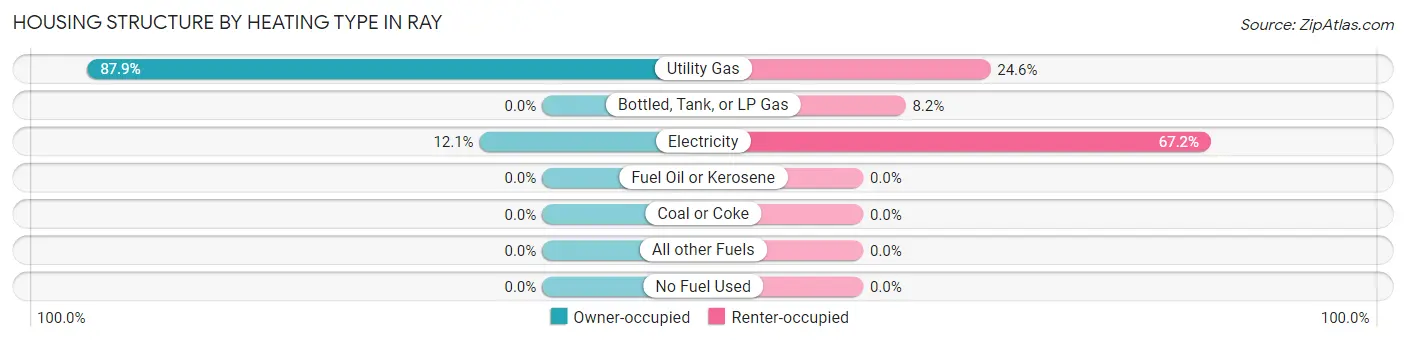
| Heating Type | Owner-occupied | Renter-occupied |
| Utility Gas | 167 (87.9%) | 30 (24.6%) |
| Bottled, Tank, or LP Gas | 0 (0.0%) | 10 (8.2%) |
| Electricity | 23 (12.1%) | 82 (67.2%) |
| Fuel Oil or Kerosene | 0 (0.0%) | 0 (0.0%) |
| Coal or Coke | 0 (0.0%) | 0 (0.0%) |
| All other Fuels | 0 (0.0%) | 0 (0.0%) |
| No Fuel Used | 0 (0.0%) | 0 (0.0%) |
| Total | 190 (100.0%) | 122 (100.0%) |
Household Vehicle Usage in Ray
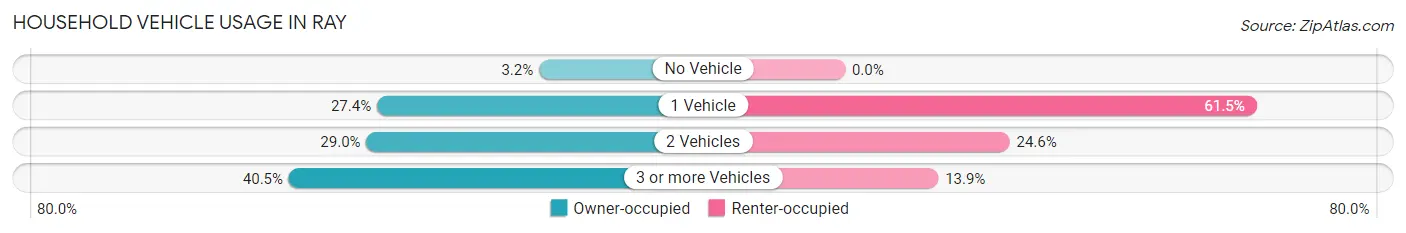
| Vehicles per Household | Owner-occupied | Renter-occupied |
| No Vehicle | 6 (3.2%) | 0 (0.0%) |
| 1 Vehicle | 52 (27.4%) | 75 (61.5%) |
| 2 Vehicles | 55 (28.9%) | 30 (24.6%) |
| 3 or more Vehicles | 77 (40.5%) | 17 (13.9%) |
| Total | 190 (100.0%) | 122 (100.0%) |
Real Estate & Mortgages in Ray
Real Estate and Mortgage Overview in Ray
| Characteristic | Without Mortgage | With Mortgage |
| Housing Units | 109 | 81 |
| Median Property Value | $139,400 | $223,800 |
| Median Household Income | $63,063 | $43 |
| Monthly Housing Costs | $464 | $0 |
| Real Estate Taxes | $1,385 | $2 |
Property Value by Mortgage Status in Ray
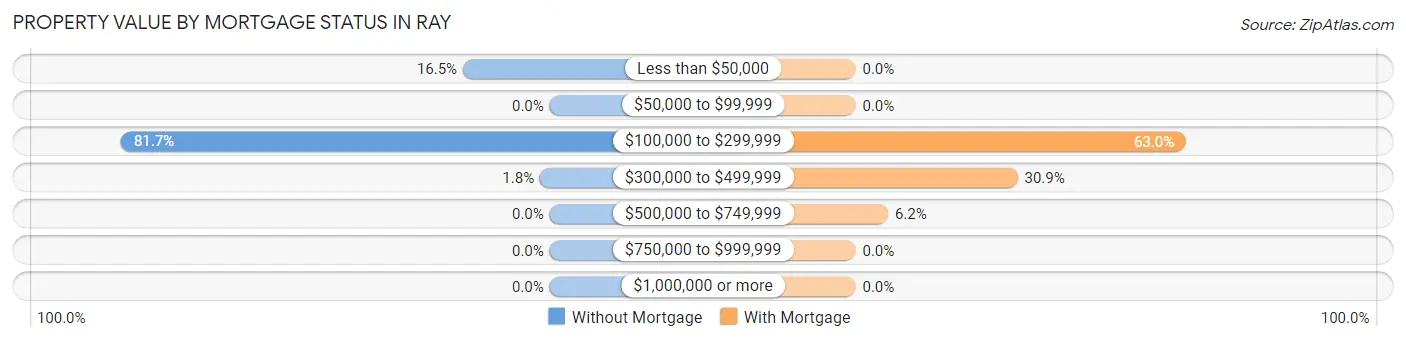
| Property Value | Without Mortgage | With Mortgage |
| Less than $50,000 | 18 (16.5%) | 0 (0.0%) |
| $50,000 to $99,999 | 0 (0.0%) | 0 (0.0%) |
| $100,000 to $299,999 | 89 (81.7%) | 51 (63.0%) |
| $300,000 to $499,999 | 2 (1.8%) | 25 (30.9%) |
| $500,000 to $749,999 | 0 (0.0%) | 5 (6.2%) |
| $750,000 to $999,999 | 0 (0.0%) | 0 (0.0%) |
| $1,000,000 or more | 0 (0.0%) | 0 (0.0%) |
| Total | 109 (100.0%) | 81 (100.0%) |
Household Income by Mortgage Status in Ray

| Household Income | Without Mortgage | With Mortgage |
| Less than $10,000 | 1 (0.9%) | 2 (2.5%) |
| $10,000 to $24,999 | 14 (12.8%) | 8 (9.9%) |
| $25,000 to $34,999 | 12 (11.0%) | 0 (0.0%) |
| $35,000 to $49,999 | 16 (14.7%) | 0 (0.0%) |
| $50,000 to $74,999 | 52 (47.7%) | 0 (0.0%) |
| $75,000 to $99,999 | 3 (2.8%) | 4 (4.9%) |
| $100,000 to $149,999 | 4 (3.7%) | 12 (14.8%) |
| $150,000 or more | 7 (6.4%) | 14 (17.3%) |
| Total | 109 (100.0%) | 81 (100.0%) |
Property Value to Household Income Ratio in Ray
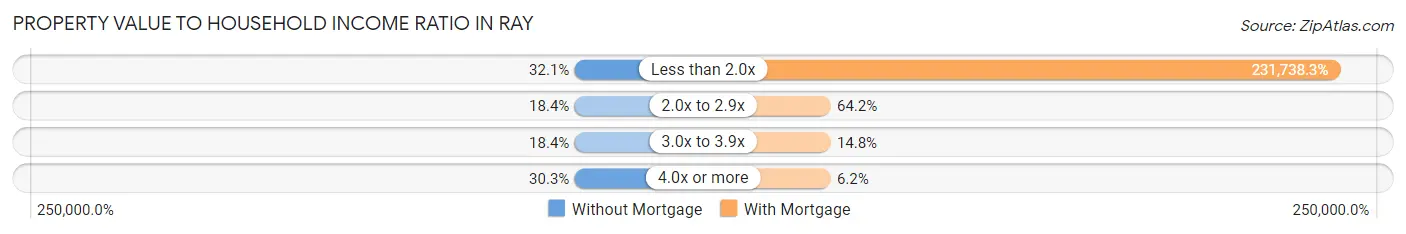
| Value-to-Income Ratio | Without Mortgage | With Mortgage |
| Less than 2.0x | 35 (32.1%) | 187,708 (231,738.3%) |
| 2.0x to 2.9x | 20 (18.3%) | 52 (64.2%) |
| 3.0x to 3.9x | 20 (18.3%) | 12 (14.8%) |
| 4.0x or more | 33 (30.3%) | 5 (6.2%) |
| Total | 109 (100.0%) | 81 (100.0%) |
Real Estate Taxes by Mortgage Status in Ray
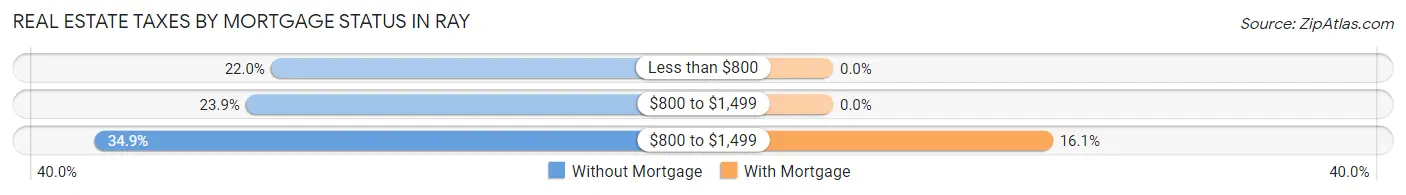
| Property Taxes | Without Mortgage | With Mortgage |
| Less than $800 | 24 (22.0%) | 0 (0.0%) |
| $800 to $1,499 | 26 (23.8%) | 0 (0.0%) |
| $800 to $1,499 | 38 (34.9%) | 13 (16.1%) |
| Total | 109 (100.0%) | 81 (100.0%) |
Health & Disability in Ray
Health Insurance Coverage by Age in Ray
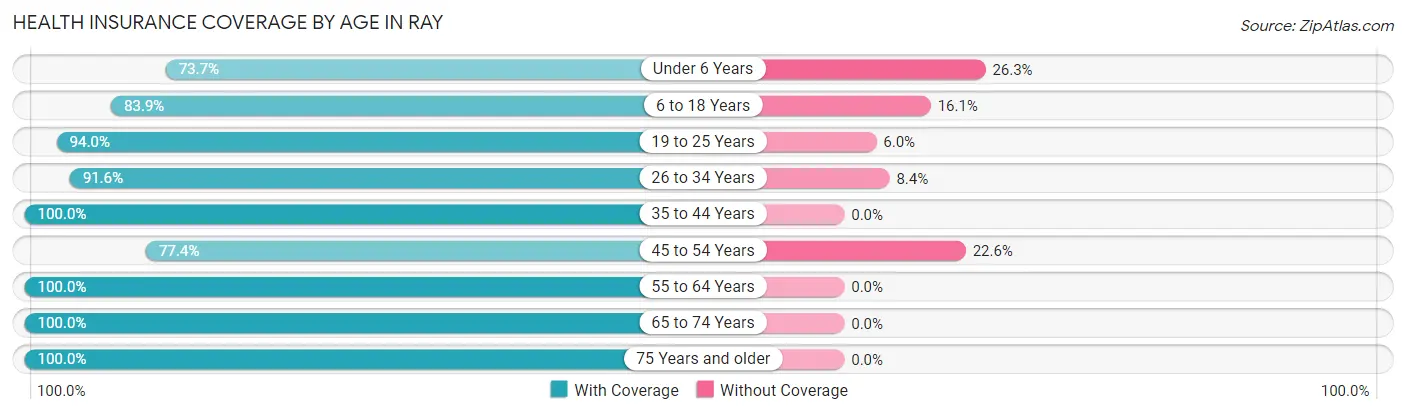
| Age Bracket | With Coverage | Without Coverage |
| Under 6 Years | 84 (73.7%) | 30 (26.3%) |
| 6 to 18 Years | 125 (83.9%) | 24 (16.1%) |
| 19 to 25 Years | 63 (94.0%) | 4 (6.0%) |
| 26 to 34 Years | 76 (91.6%) | 7 (8.4%) |
| 35 to 44 Years | 117 (100.0%) | 0 (0.0%) |
| 45 to 54 Years | 41 (77.4%) | 12 (22.6%) |
| 55 to 64 Years | 27 (100.0%) | 0 (0.0%) |
| 65 to 74 Years | 92 (100.0%) | 0 (0.0%) |
| 75 Years and older | 64 (100.0%) | 0 (0.0%) |
| Total | 689 (89.9%) | 77 (10.1%) |
Health Insurance Coverage by Citizenship Status in Ray
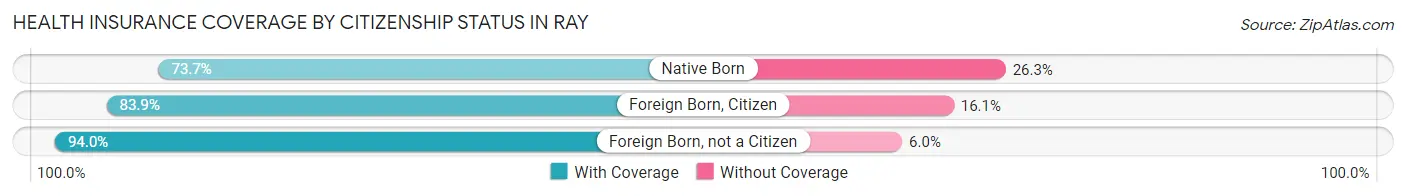
| Citizenship Status | With Coverage | Without Coverage |
| Native Born | 84 (73.7%) | 30 (26.3%) |
| Foreign Born, Citizen | 125 (83.9%) | 24 (16.1%) |
| Foreign Born, not a Citizen | 63 (94.0%) | 4 (6.0%) |
Health Insurance Coverage by Household Income in Ray
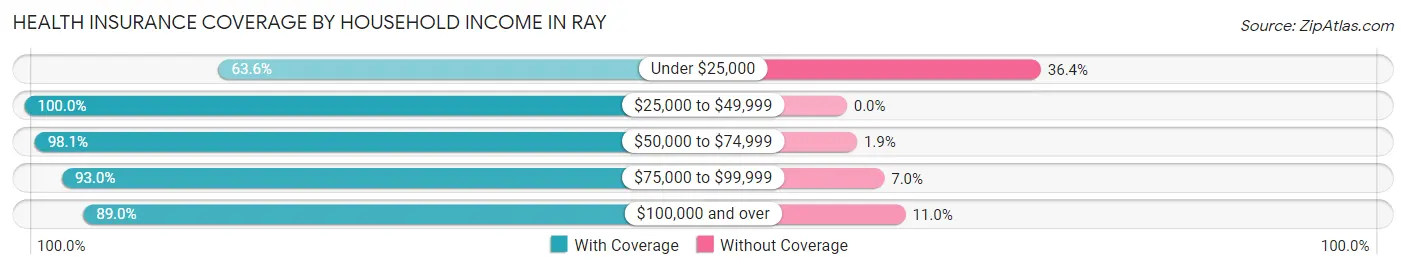
| Household Income | With Coverage | Without Coverage |
| Under $25,000 | 42 (63.6%) | 24 (36.4%) |
| $25,000 to $49,999 | 111 (100.0%) | 0 (0.0%) |
| $50,000 to $74,999 | 103 (98.1%) | 2 (1.9%) |
| $75,000 to $99,999 | 53 (93.0%) | 4 (7.0%) |
| $100,000 and over | 380 (89.0%) | 47 (11.0%) |
Public vs Private Health Insurance Coverage by Age in Ray
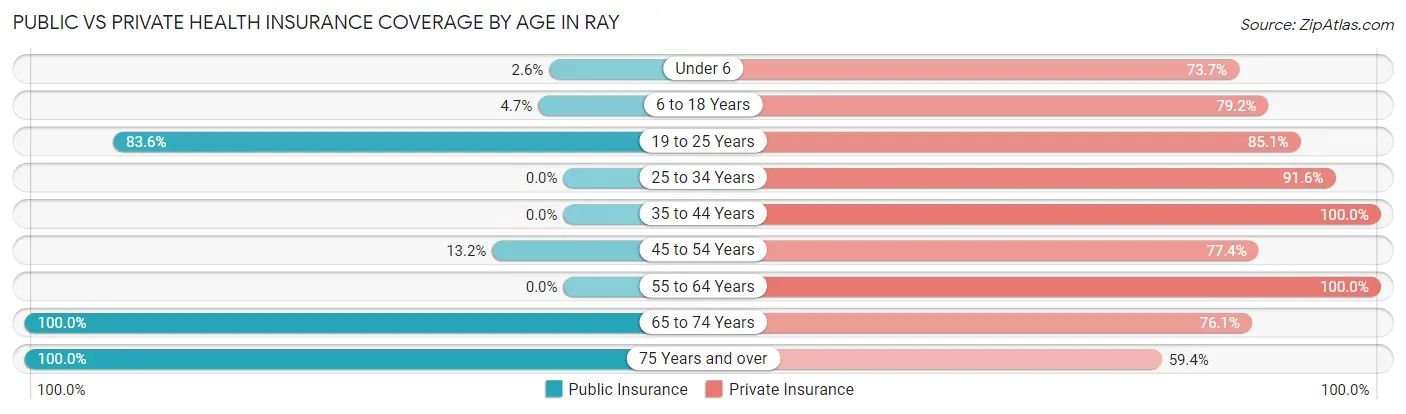
| Age Bracket | Public Insurance | Private Insurance |
| Under 6 | 3 (2.6%) | 84 (73.7%) |
| 6 to 18 Years | 7 (4.7%) | 118 (79.2%) |
| 19 to 25 Years | 56 (83.6%) | 57 (85.1%) |
| 25 to 34 Years | 0 (0.0%) | 76 (91.6%) |
| 35 to 44 Years | 0 (0.0%) | 117 (100.0%) |
| 45 to 54 Years | 7 (13.2%) | 41 (77.4%) |
| 55 to 64 Years | 0 (0.0%) | 27 (100.0%) |
| 65 to 74 Years | 92 (100.0%) | 70 (76.1%) |
| 75 Years and over | 64 (100.0%) | 38 (59.4%) |
| Total | 229 (29.9%) | 628 (82.0%) |
Disability Status by Sex by Age in Ray
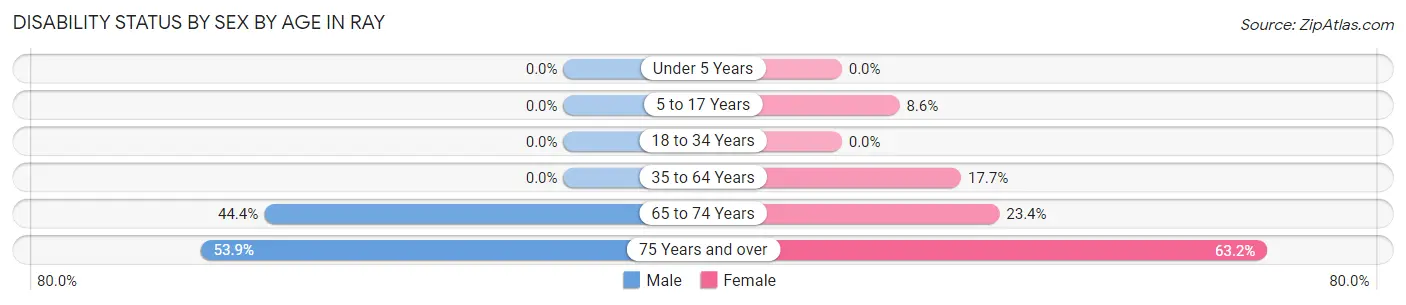
| Age Bracket | Male | Female |
| Under 5 Years | 0 (0.0%) | 0 (0.0%) |
| 5 to 17 Years | 0 (0.0%) | 6 (8.6%) |
| 18 to 34 Years | 0 (0.0%) | 0 (0.0%) |
| 35 to 64 Years | 0 (0.0%) | 17 (17.7%) |
| 65 to 74 Years | 20 (44.4%) | 11 (23.4%) |
| 75 Years and over | 14 (53.8%) | 24 (63.2%) |
Disability Class by Sex by Age in Ray
Disability Class: Hearing Difficulty
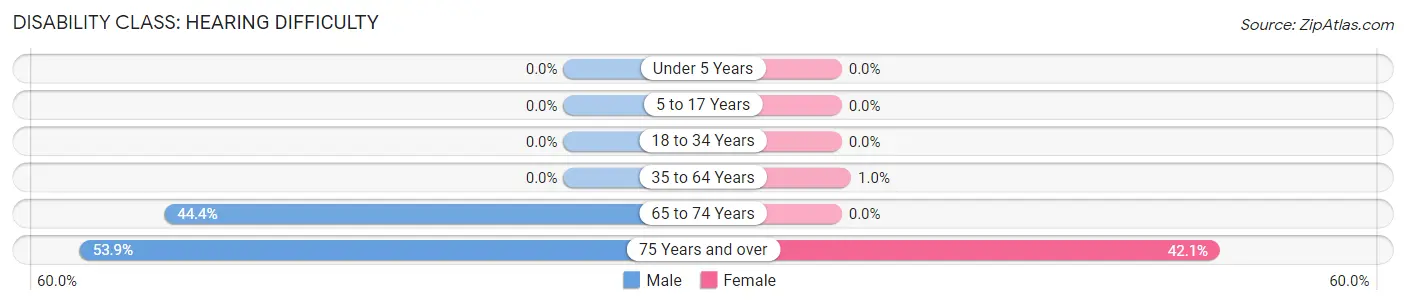
| Age Bracket | Male | Female |
| Under 5 Years | 0 (0.0%) | 0 (0.0%) |
| 5 to 17 Years | 0 (0.0%) | 0 (0.0%) |
| 18 to 34 Years | 0 (0.0%) | 0 (0.0%) |
| 35 to 64 Years | 0 (0.0%) | 1 (1.0%) |
| 65 to 74 Years | 20 (44.4%) | 0 (0.0%) |
| 75 Years and over | 14 (53.8%) | 16 (42.1%) |
Disability Class: Vision Difficulty
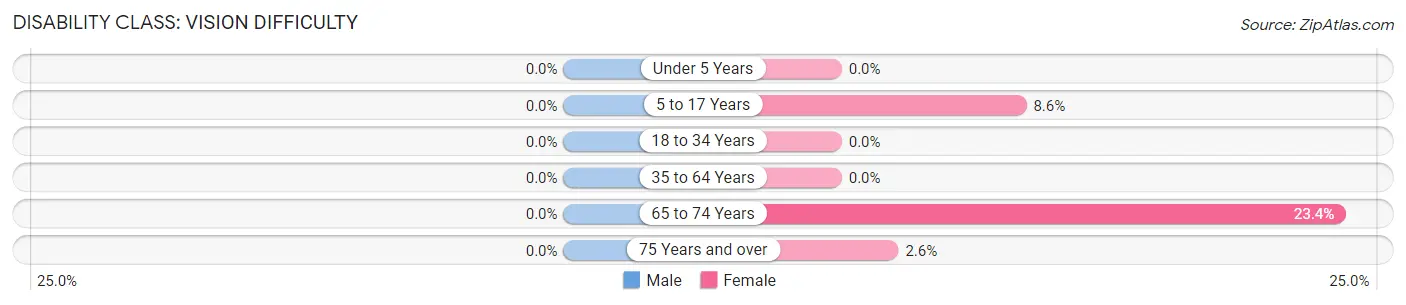
| Age Bracket | Male | Female |
| Under 5 Years | 0 (0.0%) | 0 (0.0%) |
| 5 to 17 Years | 0 (0.0%) | 6 (8.6%) |
| 18 to 34 Years | 0 (0.0%) | 0 (0.0%) |
| 35 to 64 Years | 0 (0.0%) | 0 (0.0%) |
| 65 to 74 Years | 0 (0.0%) | 11 (23.4%) |
| 75 Years and over | 0 (0.0%) | 1 (2.6%) |
Disability Class: Cognitive Difficulty
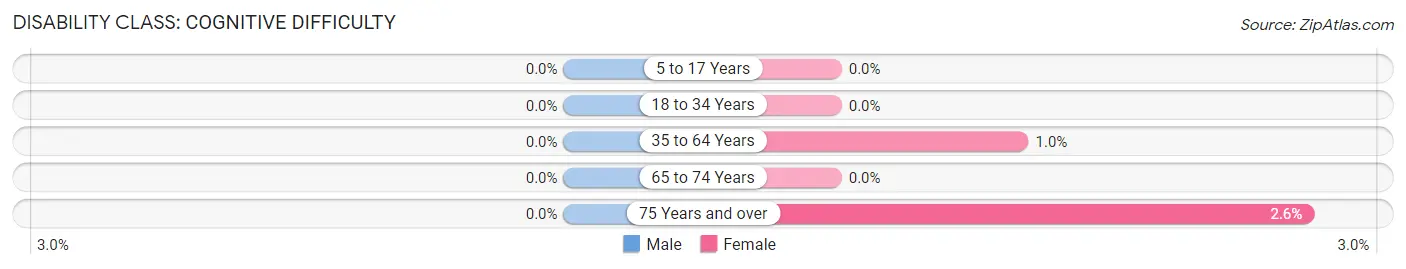
| Age Bracket | Male | Female |
| 5 to 17 Years | 0 (0.0%) | 0 (0.0%) |
| 18 to 34 Years | 0 (0.0%) | 0 (0.0%) |
| 35 to 64 Years | 0 (0.0%) | 1 (1.0%) |
| 65 to 74 Years | 0 (0.0%) | 0 (0.0%) |
| 75 Years and over | 0 (0.0%) | 1 (2.6%) |
Disability Class: Ambulatory Difficulty
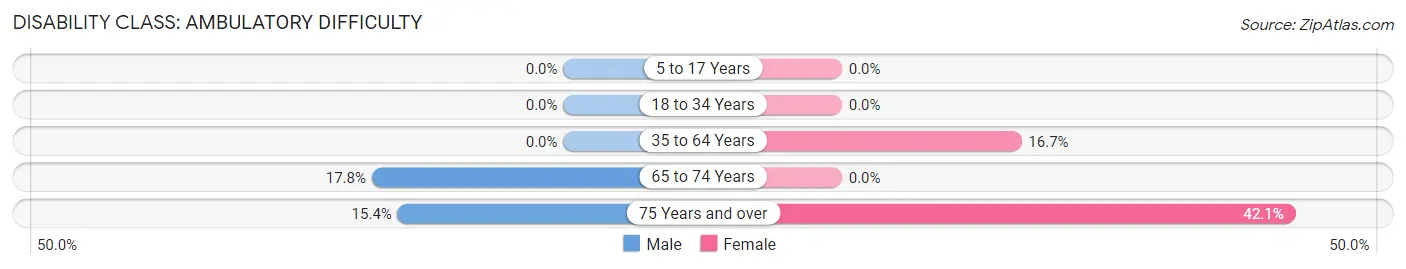
| Age Bracket | Male | Female |
| 5 to 17 Years | 0 (0.0%) | 0 (0.0%) |
| 18 to 34 Years | 0 (0.0%) | 0 (0.0%) |
| 35 to 64 Years | 0 (0.0%) | 16 (16.7%) |
| 65 to 74 Years | 8 (17.8%) | 0 (0.0%) |
| 75 Years and over | 4 (15.4%) | 16 (42.1%) |
Disability Class: Self-Care Difficulty
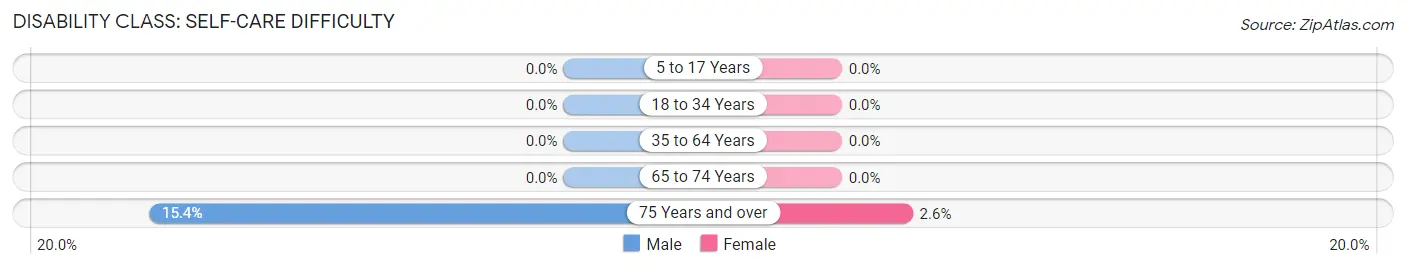
| Age Bracket | Male | Female |
| 5 to 17 Years | 0 (0.0%) | 0 (0.0%) |
| 18 to 34 Years | 0 (0.0%) | 0 (0.0%) |
| 35 to 64 Years | 0 (0.0%) | 0 (0.0%) |
| 65 to 74 Years | 0 (0.0%) | 0 (0.0%) |
| 75 Years and over | 4 (15.4%) | 1 (2.6%) |
Technology Access in Ray
Computing Device Access in Ray
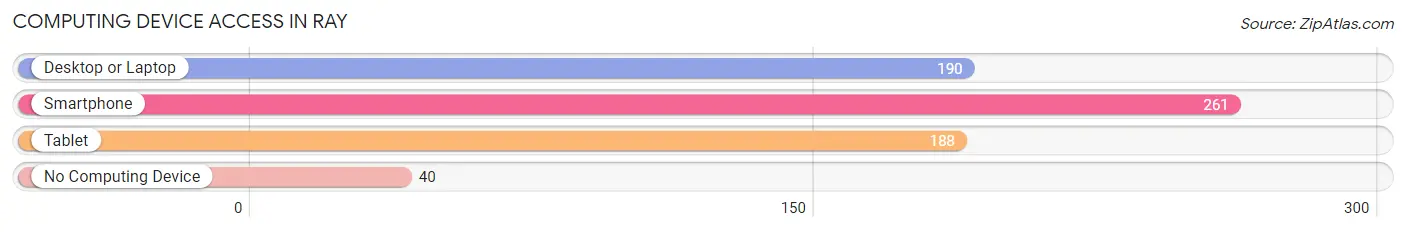
| Device Type | # Households | % Households |
| Desktop or Laptop | 190 | 60.9% |
| Smartphone | 261 | 83.7% |
| Tablet | 188 | 60.3% |
| No Computing Device | 40 | 12.8% |
| Total | 312 | 100.0% |
Internet Access in Ray
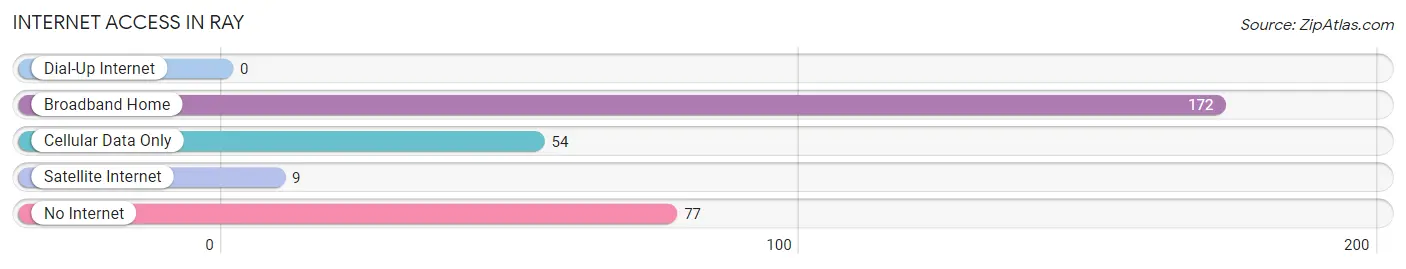
| Internet Type | # Households | % Households |
| Dial-Up Internet | 0 | 0.0% |
| Broadband Home | 172 | 55.1% |
| Cellular Data Only | 54 | 17.3% |
| Satellite Internet | 9 | 2.9% |
| No Internet | 77 | 24.7% |
| Total | 312 | 100.0% |
Ray Summary
North Dakota is a state located in the Midwestern and Great Plains regions of the United States. It is the 19th largest state by area, and the third least populous state in the country. North Dakota is bordered by the Canadian provinces of Saskatchewan and Manitoba to the north, Minnesota to the east, South Dakota to the south, and Montana to the west. The state capital is Bismarck, and the largest city is Fargo.
History
The area that is now North Dakota has been inhabited for thousands of years by various Native American tribes. The first Europeans to explore the area were French fur traders, who arrived in the late 17th century. In 1803, the area became part of the United States as part of the Louisiana Purchase. In 1861, the Dakota Territory was created, which included the area that is now North Dakota. The territory was divided into two states in 1889, with North Dakota becoming a state on November 2nd of that year.
Geography
North Dakota is located in the northern Great Plains region of the United States. It is bordered by the Canadian provinces of Saskatchewan and Manitoba to the north, Minnesota to the east, South Dakota to the south, and Montana to the west. The state has an area of 70,700 square miles, making it the 19th largest state in the country.
The geography of North Dakota is mostly flat, with rolling hills in the east and west. The state is divided into three distinct geographic regions: the Red River Valley in the east, the Missouri Plateau in the west, and the Drift Prairie in the central part of the state. The Red River Valley is the most fertile region in the state, and is home to the majority of the state’s population. The Missouri Plateau is a region of rolling hills and prairies, while the Drift Prairie is a region of flat plains and grasslands.
The highest point in North Dakota is White Butte, which has an elevation of 3,506 feet. The lowest point is the Red River, which has an elevation of 750 feet.
Economy
North Dakota’s economy is largely based on agriculture, with the state being one of the top producers of wheat, barley, oats, and sunflowers in the United States. Other important crops include soybeans, corn, and canola. The state is also a major producer of beef, pork, and dairy products.
The state’s economy is also heavily reliant on the energy industry, with the state being one of the top producers of oil and natural gas in the country. Other important industries in the state include manufacturing, tourism, and technology.
Demographics
As of 2019, North Dakota had an estimated population of 762,062, making it the third least populous state in the country. The state has a population density of 10.7 people per square mile, making it the fourth least densely populated state in the country.
The largest racial group in North Dakota is white, making up 87.2% of the population. Other racial groups include Native American (5.2%), African American (2.2%), Asian (1.7%), and Hispanic or Latino (2.7%).
The median household income in North Dakota is $58,906, and the median age is 37.7 years. The state’s poverty rate is 11.2%, and the unemployment rate is 2.9%.
Common Questions
What is the Total Population of Ray?
Total Population of Ray is 768.
What is the Total Male Population of Ray?
Total Male Population of Ray is 380.
What is the Total Female Population of Ray?
Total Female Population of Ray is 388.
What is the Ratio of Males per 100 Females in Ray?
There are 97.94 Males per 100 Females in Ray.
What is the Ratio of Females per 100 Males in Ray?
There are 102.11 Females per 100 Males in Ray.
What is the Median Population Age in Ray?
Median Population Age in Ray is 32.4 Years.
What is the Average Family Size in Ray
Average Family Size in Ray is 3.1 People.
What is the Average Household Size in Ray
Average Household Size in Ray is 2.5 People.
What is Per Capita Income in Ray?
Per Capita income in Ray is $45,421.
What is the Median Family Income in Ray?
Median Family Income in Ray is $68,375.
What is the Median Household income in Ray?
Median Household Income in Ray is $65,208.
What is Income or Wage Gap in Ray?
Income or Wage Gap in Ray is 72.0%.
Women in Ray earn 28.0 cents for every dollar earned by a man.
What is Inequality or Gini Index in Ray?
Inequality or Gini Index in Ray is 0.49.
How Large is the Labor Force in Ray?
There are 386 People in the Labor Forcein in Ray.
What is the Percentage of People in the Labor Force in Ray?
72.7% of People are in the Labor Force in Ray.
What is the Unemployment Rate in Ray?
Unemployment Rate in Ray is 0.3%.