Hankinson, ND
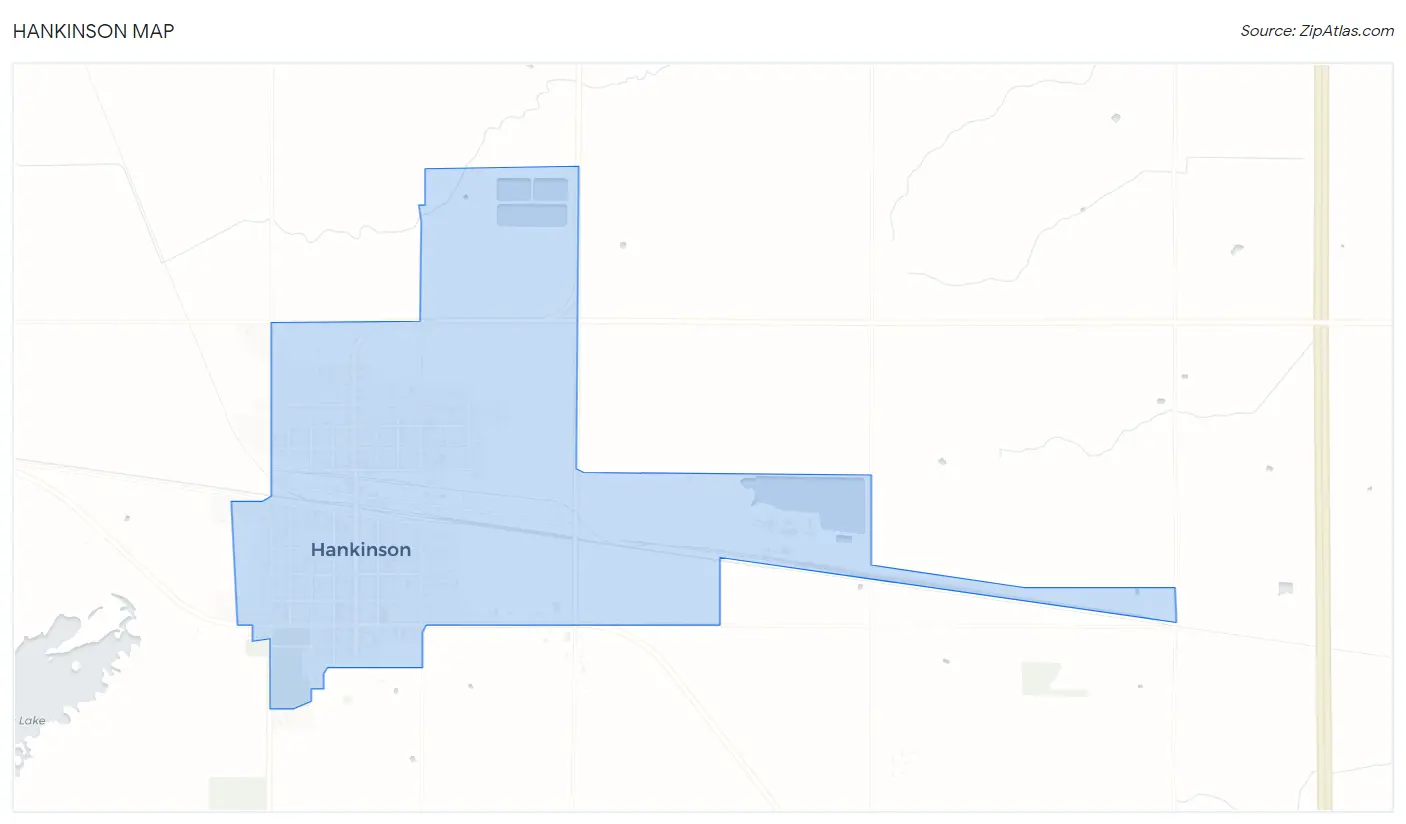
Hankinson Map
Hankinson Overview
790
TOTAL POPULATION
411
MALE POPULATION
379
FEMALE POPULATION
108.44
MALES / 100 FEMALES
92.21
FEMALES / 100 MALES
39.7
MEDIAN AGE
3.0
AVG FAMILY SIZE
2.4
AVG HOUSEHOLD SIZE
$28,406
PER CAPITA INCOME
$73,594
AVG FAMILY INCOME
$57,031
AVG HOUSEHOLD INCOME
4.5%
WAGE / INCOME GAP [ % ]
95.5¢/ $1
WAGE / INCOME GAP [ $ ]
0.39
INEQUALITY / GINI INDEX
302
LABOR FORCE [ PEOPLE ]
51.4%
PERCENT IN LABOR FORCE
3.6%
UNEMPLOYMENT RATE
Hankinson Zip Codes
Hankinson Area Codes
Race in Hankinson
The most populous races in Hankinson are White / Caucasian (756 | 95.7%), Native / Alaskan (21 | 2.7%), and Two or more Races (7 | 0.9%).
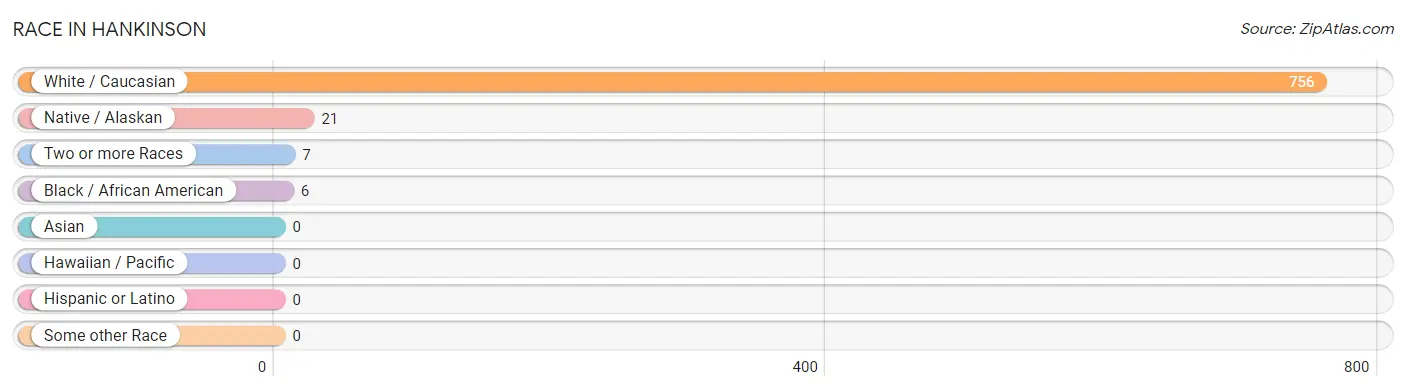
| Race | # Population | % Population |
| Asian | 0 | 0.0% |
| Black / African American | 6 | 0.8% |
| Hawaiian / Pacific | 0 | 0.0% |
| Hispanic or Latino | 0 | 0.0% |
| Native / Alaskan | 21 | 2.7% |
| White / Caucasian | 756 | 95.7% |
| Two or more Races | 7 | 0.9% |
| Some other Race | 0 | 0.0% |
| Total | 790 | 100.0% |
Ancestry in Hankinson
The most populous ancestries reported in Hankinson are German (361 | 45.7%), Norwegian (141 | 17.8%), Hungarian (40 | 5.1%), Scandinavian (38 | 4.8%), and American (32 | 4.1%), together accounting for 77.5% of all Hankinson residents.
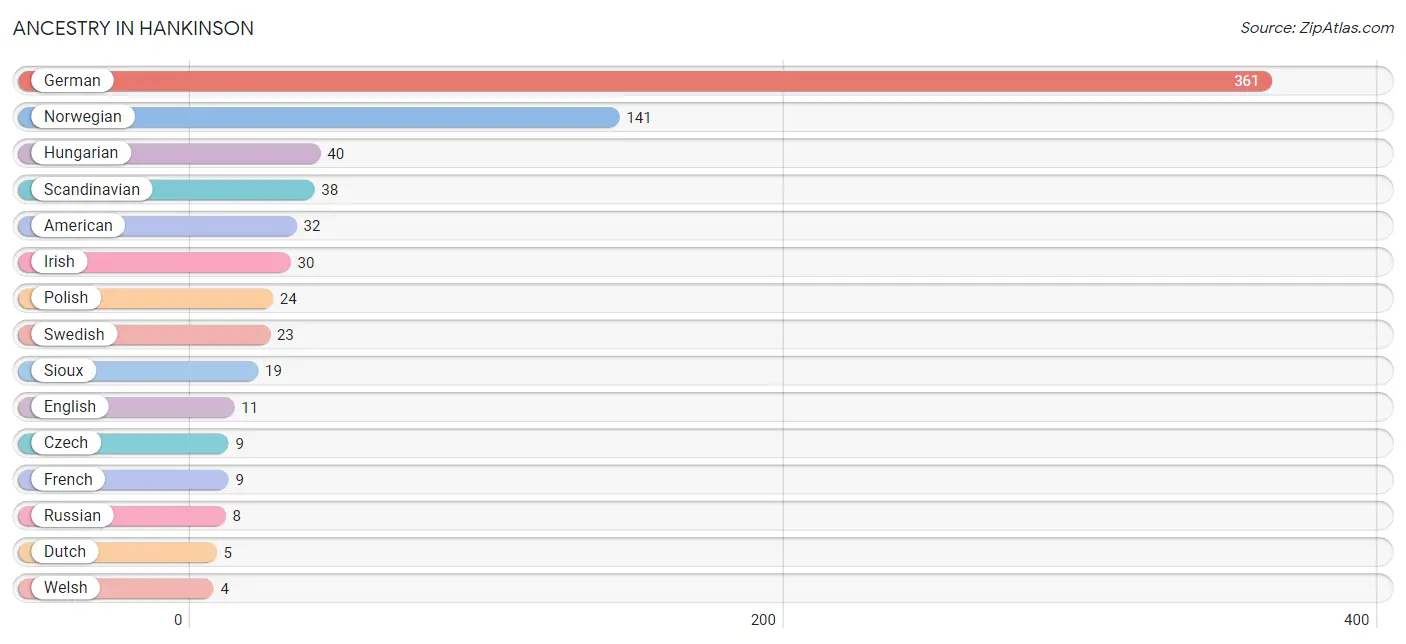
| Ancestry | # Population | % Population |
| American | 32 | 4.1% |
| Austrian | 1 | 0.1% |
| British | 2 | 0.3% |
| Burmese | 1 | 0.1% |
| Chippewa | 2 | 0.3% |
| Czech | 9 | 1.1% |
| Dutch | 5 | 0.6% |
| English | 11 | 1.4% |
| French | 9 | 1.1% |
| German | 361 | 45.7% |
| Hungarian | 40 | 5.1% |
| Irish | 30 | 3.8% |
| Italian | 3 | 0.4% |
| Norwegian | 141 | 17.8% |
| Polish | 24 | 3.0% |
| Russian | 8 | 1.0% |
| Scandinavian | 38 | 4.8% |
| Scotch-Irish | 2 | 0.3% |
| Sioux | 19 | 2.4% |
| Swedish | 23 | 2.9% |
| Welsh | 4 | 0.5% | View All 21 Rows |
Immigrants in Hankinson
The most numerous immigrant groups reported in Hankinson came from Canada (4 | 0.5%), England (1 | 0.1%), Europe (1 | 0.1%), and Northern Europe (1 | 0.1%), together accounting for 0.9% of all Hankinson residents.
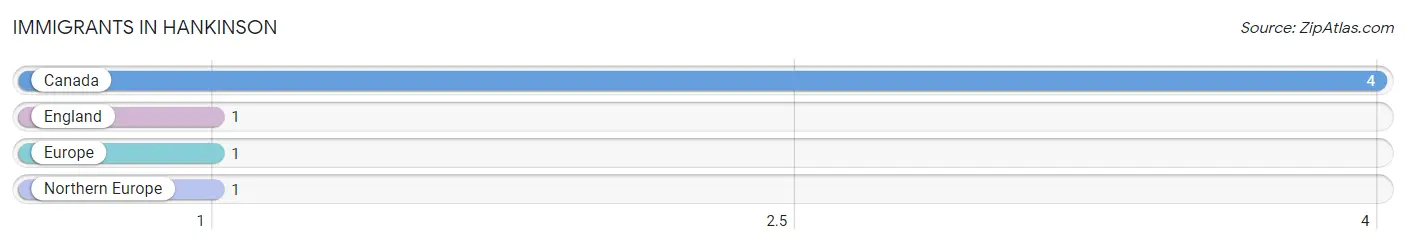
| Immigration Origin | # Population | % Population |
| Canada | 4 | 0.5% |
| England | 1 | 0.1% |
| Europe | 1 | 0.1% |
| Northern Europe | 1 | 0.1% | View All 4 Rows |
Sex and Age in Hankinson
Sex and Age in Hankinson
The most populous age groups in Hankinson are 25 to 29 Years (57 | 13.9%) for men and 10 to 14 Years (49 | 12.9%) for women.
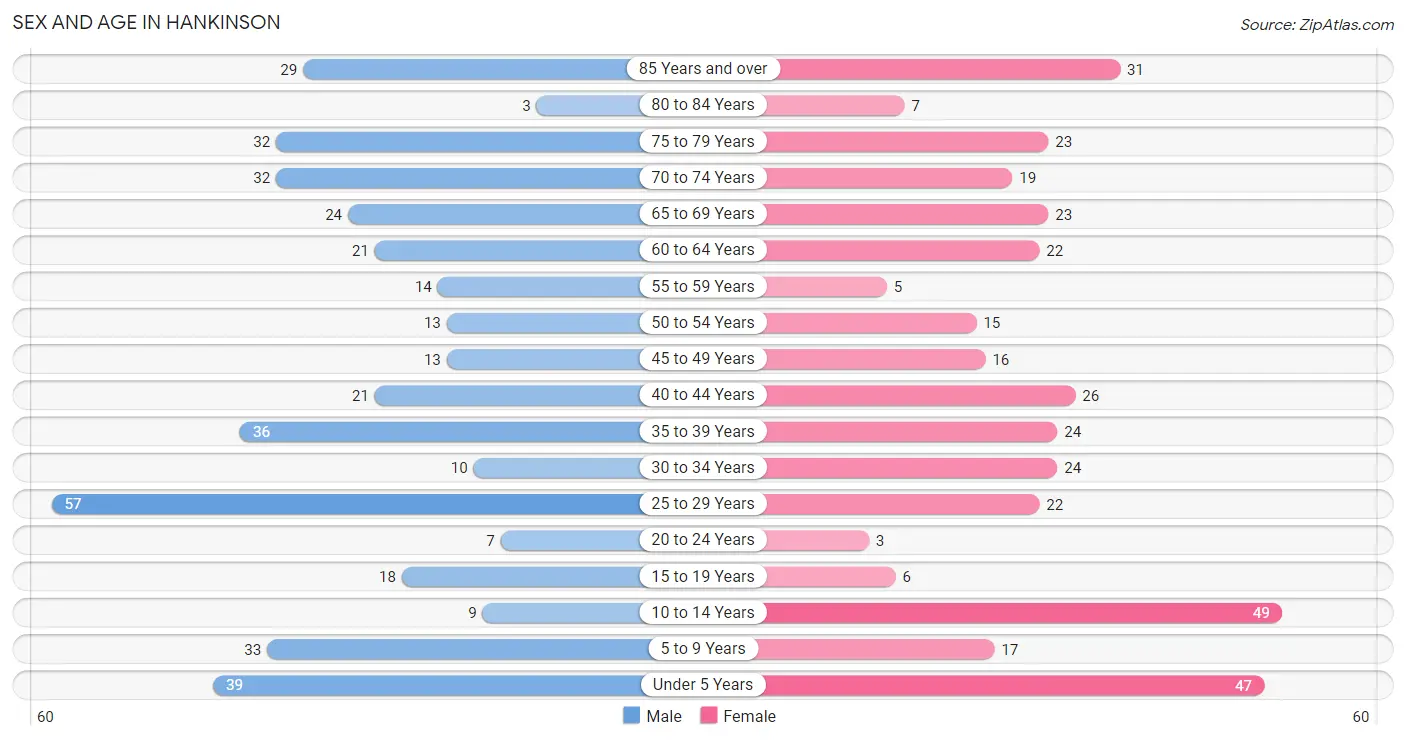
| Age Bracket | Male | Female |
| Under 5 Years | 39 (9.5%) | 47 (12.4%) |
| 5 to 9 Years | 33 (8.0%) | 17 (4.5%) |
| 10 to 14 Years | 9 (2.2%) | 49 (12.9%) |
| 15 to 19 Years | 18 (4.4%) | 6 (1.6%) |
| 20 to 24 Years | 7 (1.7%) | 3 (0.8%) |
| 25 to 29 Years | 57 (13.9%) | 22 (5.8%) |
| 30 to 34 Years | 10 (2.4%) | 24 (6.3%) |
| 35 to 39 Years | 36 (8.8%) | 24 (6.3%) |
| 40 to 44 Years | 21 (5.1%) | 26 (6.9%) |
| 45 to 49 Years | 13 (3.2%) | 16 (4.2%) |
| 50 to 54 Years | 13 (3.2%) | 15 (4.0%) |
| 55 to 59 Years | 14 (3.4%) | 5 (1.3%) |
| 60 to 64 Years | 21 (5.1%) | 22 (5.8%) |
| 65 to 69 Years | 24 (5.8%) | 23 (6.1%) |
| 70 to 74 Years | 32 (7.8%) | 19 (5.0%) |
| 75 to 79 Years | 32 (7.8%) | 23 (6.1%) |
| 80 to 84 Years | 3 (0.7%) | 7 (1.8%) |
| 85 Years and over | 29 (7.1%) | 31 (8.2%) |
| Total | 411 (100.0%) | 379 (100.0%) |
Families and Households in Hankinson
Median Family Size in Hankinson
The median family size in Hankinson is 3.01 persons per family, with married-couple families (135 | 70.7%) accounting for the largest median family size of 3.23 persons per family. On the other hand, single male/father families (27 | 14.1%) represent the smallest median family size with 2.04 persons per family.
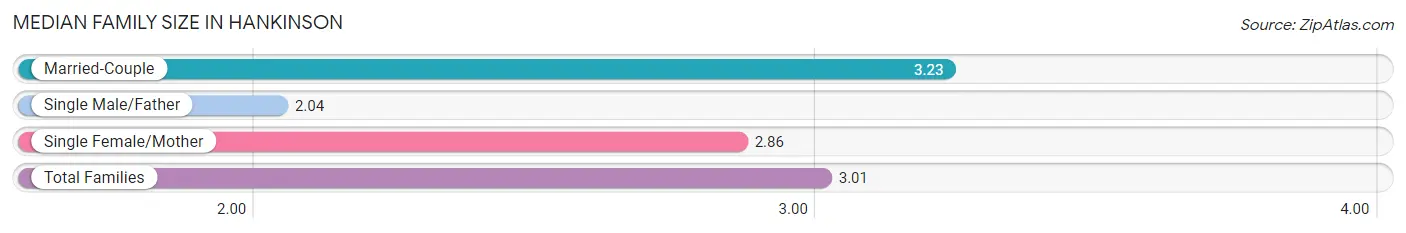
| Family Type | # Families | Family Size |
| Married-Couple | 135 (70.7%) | 3.23 |
| Single Male/Father | 27 (14.1%) | 2.04 |
| Single Female/Mother | 29 (15.2%) | 2.86 |
| Total Families | 191 (100.0%) | 3.01 |
Median Household Size in Hankinson
The median household size in Hankinson is 2.39 persons per household, with married-couple households (135 | 44.6%) accounting for the largest median household size of 3.23 persons per household. non-family households (112 | 37.0%) represent the smallest median household size with 1.21 persons per household.
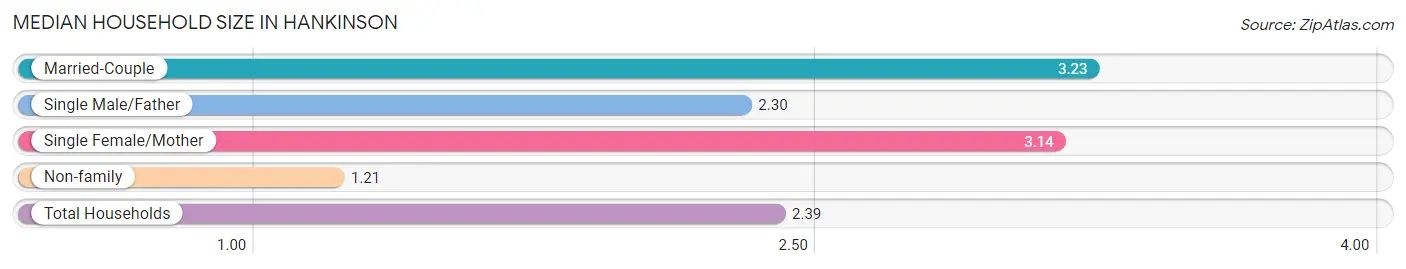
| Household Type | # Households | Household Size |
| Married-Couple | 135 (44.6%) | 3.23 |
| Single Male/Father | 27 (8.9%) | 2.30 |
| Single Female/Mother | 29 (9.6%) | 3.14 |
| Non-family | 112 (37.0%) | 1.21 |
| Total Households | 303 (100.0%) | 2.39 |
Household Size by Marriage Status in Hankinson
Out of a total of 303 households in Hankinson, 191 (63.0%) are family households, while 112 (37.0%) are nonfamily households. The most numerous type of family households are 2-person households, comprising 103, and the most common type of nonfamily households are 1-person households, comprising 87.
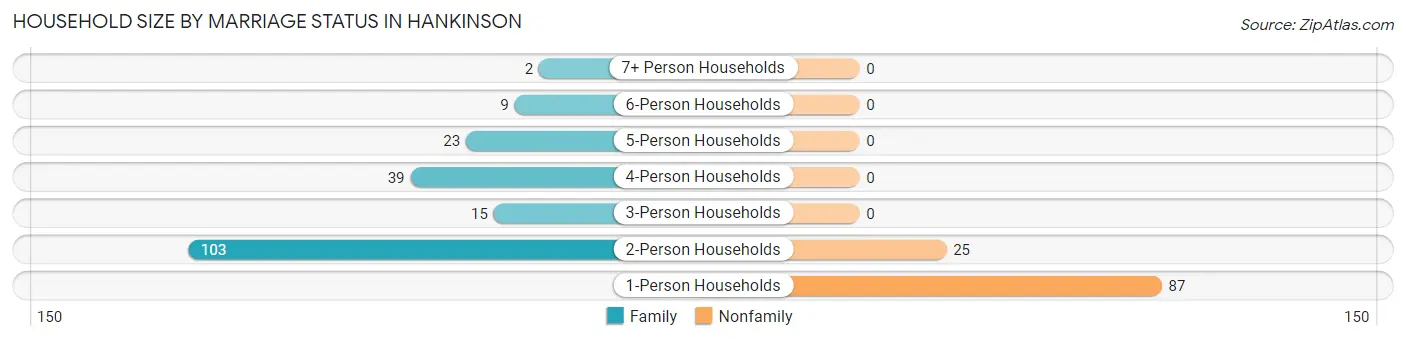
| Household Size | Family Households | Nonfamily Households |
| 1-Person Households | - | 87 (28.7%) |
| 2-Person Households | 103 (34.0%) | 25 (8.3%) |
| 3-Person Households | 15 (5.0%) | 0 (0.0%) |
| 4-Person Households | 39 (12.9%) | 0 (0.0%) |
| 5-Person Households | 23 (7.6%) | 0 (0.0%) |
| 6-Person Households | 9 (3.0%) | 0 (0.0%) |
| 7+ Person Households | 2 (0.7%) | 0 (0.0%) |
| Total | 191 (63.0%) | 112 (37.0%) |
Female Fertility in Hankinson
Fertility by Age in Hankinson
Average fertility rate in Hankinson is 81.0 births per 1,000 women. Women in the age bracket of 20 to 34 years have the highest fertility rate with 204.0 births per 1,000 women. Women in the age bracket of 20 to 34 years acount for 100.0% of all women with births.
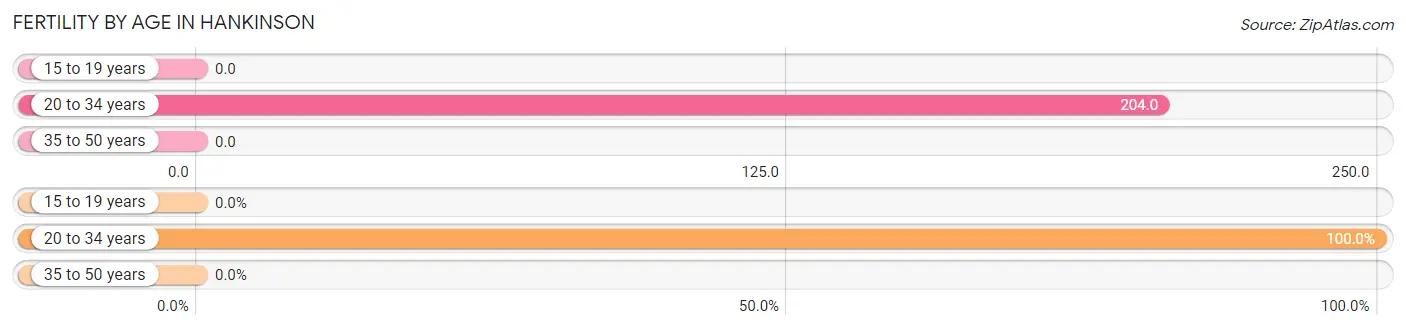
| Age Bracket | Women with Births | Births / 1,000 Women |
| 15 to 19 years | 0 (0.0%) | 0.0 |
| 20 to 34 years | 10 (100.0%) | 204.0 |
| 35 to 50 years | 0 (0.0%) | 0.0 |
| Total | 10 (100.0%) | 81.0 |
Fertility by Age by Marriage Status in Hankinson
40.0% of women with births (10) in Hankinson are married. The highest percentage of unmarried women with births falls into 20 to 34 years age bracket with 60.0% of them unmarried at the time of birth, while the lowest percentage of unmarried women with births belong to 20 to 34 years age bracket with 60.0% of them unmarried.
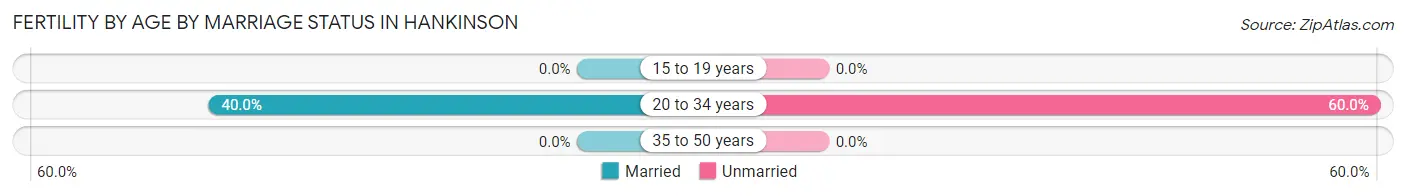
| Age Bracket | Married | Unmarried |
| 15 to 19 years | 0 (0.0%) | 0 (0.0%) |
| 20 to 34 years | 4 (40.0%) | 6 (60.0%) |
| 35 to 50 years | 0 (0.0%) | 0 (0.0%) |
| Total | 4 (40.0%) | 6 (60.0%) |
Fertility by Education in Hankinson
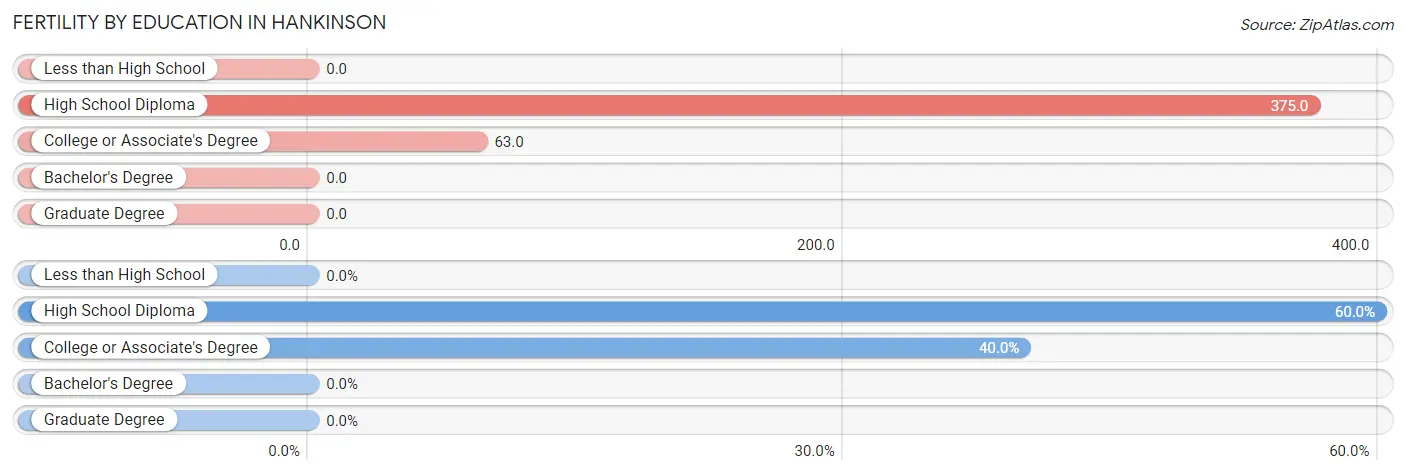
| Educational Attainment | Women with Births | Births / 1,000 Women |
| Less than High School | 0 (0.0%) | 0.0 |
| High School Diploma | 6 (60.0%) | 375.0 |
| College or Associate's Degree | 4 (40.0%) | 63.0 |
| Bachelor's Degree | 0 (0.0%) | 0.0 |
| Graduate Degree | 0 (0.0%) | 0.0 |
| Total | 10 (100.0%) | 81.0 |
Fertility by Education by Marriage Status in Hankinson
60.0% of women with births in Hankinson are unmarried. Women with the educational attainment of college or associate's degree are most likely to be married with 100.0% of them married at childbirth, while women with the educational attainment of high school diploma are least likely to be married with 100.0% of them unmarried at childbirth.
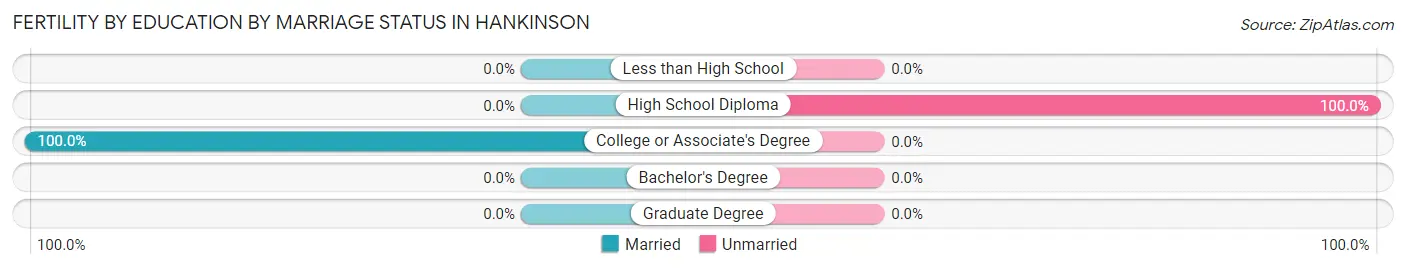
| Educational Attainment | Married | Unmarried |
| Less than High School | 0 (0.0%) | 0 (0.0%) |
| High School Diploma | 0 (0.0%) | 6 (100.0%) |
| College or Associate's Degree | 4 (100.0%) | 0 (0.0%) |
| Bachelor's Degree | 0 (0.0%) | 0 (0.0%) |
| Graduate Degree | 0 (0.0%) | 0 (0.0%) |
| Total | 4 (40.0%) | 6 (60.0%) |
Income in Hankinson
Income Overview in Hankinson
Per Capita Income in Hankinson is $28,406, while median incomes of families and households are $73,594 and $57,031 respectively.
| Characteristic | Number | Measure |
| Per Capita Income | 790 | $28,406 |
| Median Family Income | 191 | $73,594 |
| Mean Family Income | 191 | $83,298 |
| Median Household Income | 303 | $57,031 |
| Mean Household Income | 303 | $72,873 |
| Income Deficit | 191 | $0 |
| Wage / Income Gap (%) | 790 | 4.46% |
| Wage / Income Gap ($) | 790 | 95.54¢ per $1 |
| Gini / Inequality Index | 790 | 0.39 |
Earnings by Sex in Hankinson
Average Earnings in Hankinson are $41,458, $40,938 for men and $42,847 for women, a difference of 4.5%.
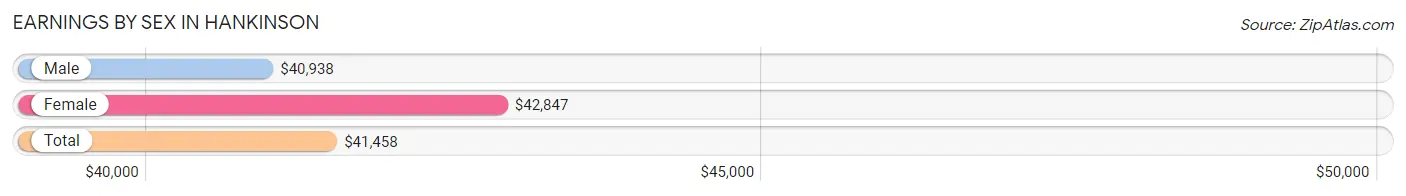
| Sex | Number | Average Earnings |
| Male | 185 (54.4%) | $40,938 |
| Female | 155 (45.6%) | $42,847 |
| Total | 340 (100.0%) | $41,458 |
Earnings by Sex by Income Bracket in Hankinson
The most common earnings brackets in Hankinson are $100,000+ for men (27 | 14.6%) and $55,000 to $64,999 for women (19 | 12.3%).
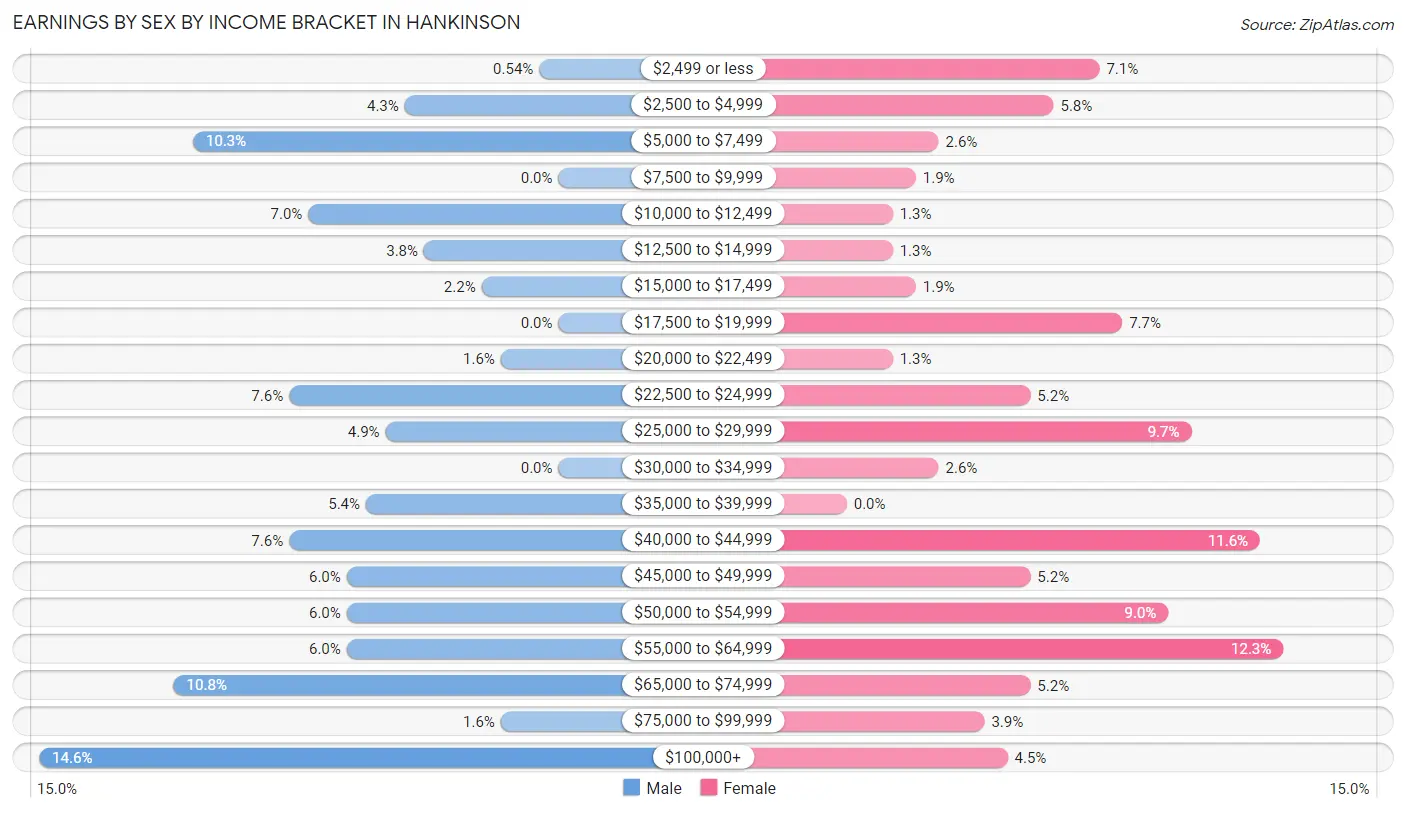
| Income | Male | Female |
| $2,499 or less | 1 (0.5%) | 11 (7.1%) |
| $2,500 to $4,999 | 8 (4.3%) | 9 (5.8%) |
| $5,000 to $7,499 | 19 (10.3%) | 4 (2.6%) |
| $7,500 to $9,999 | 0 (0.0%) | 3 (1.9%) |
| $10,000 to $12,499 | 13 (7.0%) | 2 (1.3%) |
| $12,500 to $14,999 | 7 (3.8%) | 2 (1.3%) |
| $15,000 to $17,499 | 4 (2.2%) | 3 (1.9%) |
| $17,500 to $19,999 | 0 (0.0%) | 12 (7.7%) |
| $20,000 to $22,499 | 3 (1.6%) | 2 (1.3%) |
| $22,500 to $24,999 | 14 (7.6%) | 8 (5.2%) |
| $25,000 to $29,999 | 9 (4.9%) | 15 (9.7%) |
| $30,000 to $34,999 | 0 (0.0%) | 4 (2.6%) |
| $35,000 to $39,999 | 10 (5.4%) | 0 (0.0%) |
| $40,000 to $44,999 | 14 (7.6%) | 18 (11.6%) |
| $45,000 to $49,999 | 11 (5.9%) | 8 (5.2%) |
| $50,000 to $54,999 | 11 (5.9%) | 14 (9.0%) |
| $55,000 to $64,999 | 11 (5.9%) | 19 (12.3%) |
| $65,000 to $74,999 | 20 (10.8%) | 8 (5.2%) |
| $75,000 to $99,999 | 3 (1.6%) | 6 (3.9%) |
| $100,000+ | 27 (14.6%) | 7 (4.5%) |
| Total | 185 (100.0%) | 155 (100.0%) |
Earnings by Sex by Educational Attainment in Hankinson
Average earnings in Hankinson are $43,750 for men and $42,667 for women, a difference of 2.5%. Men with an educational attainment of high school diploma enjoy the highest average annual earnings of $50,833, while those with college or associate's degree education earn the least with $47,917. Women with an educational attainment of graduate degree earn the most with the average annual earnings of $53,750, while those with high school diploma education have the smallest earnings of $47,708.

| Educational Attainment | Male Income | Female Income |
| Less than High School | - | - |
| High School Diploma | $50,833 | $47,708 |
| College or Associate's Degree | $47,917 | $0 |
| Bachelor's Degree | - | - |
| Graduate Degree | - | - |
| Total | $43,750 | $42,667 |
Family Income in Hankinson
Family Income Brackets in Hankinson
According to the Hankinson family income data, there are 40 families falling into the $100,000 to $149,999 income range, which is the most common income bracket and makes up 20.9% of all families.
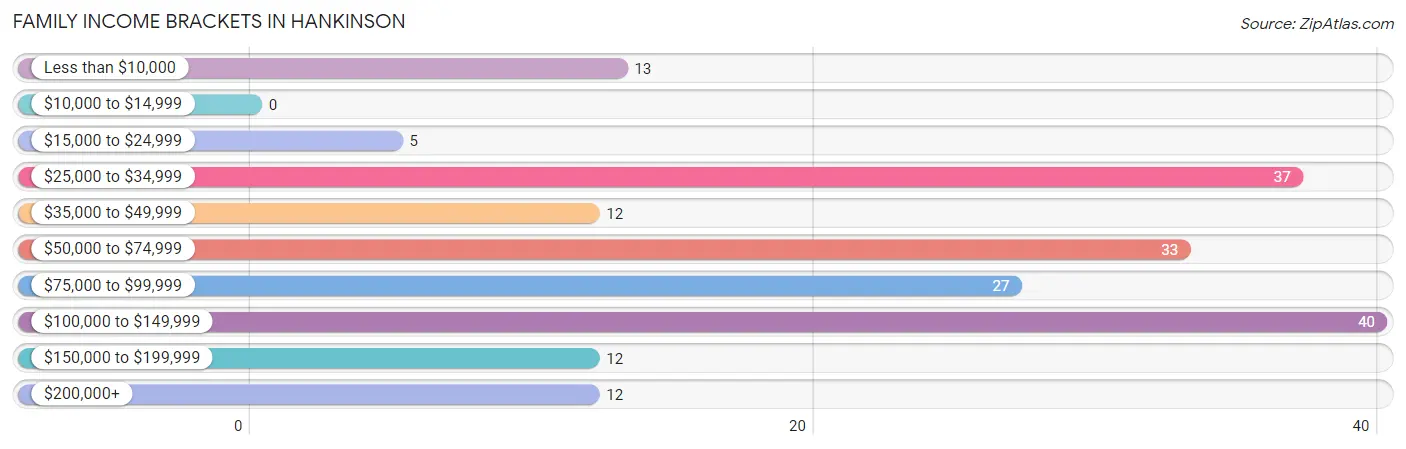
| Income Bracket | # Families | % Families |
| Less than $10,000 | 13 | 6.8% |
| $10,000 to $14,999 | 0 | 0.0% |
| $15,000 to $24,999 | 5 | 2.6% |
| $25,000 to $34,999 | 37 | 19.4% |
| $35,000 to $49,999 | 12 | 6.3% |
| $50,000 to $74,999 | 33 | 17.3% |
| $75,000 to $99,999 | 27 | 14.1% |
| $100,000 to $149,999 | 40 | 20.9% |
| $150,000 to $199,999 | 12 | 6.3% |
| $200,000+ | 12 | 6.3% |
Family Income by Famaliy Size in Hankinson
5-person families (21 | 11.0%) account for the highest median family income in Hankinson with $122,813 per family, while 2-person families (104 | 54.4%) have the highest median income of $28,125 per family member.
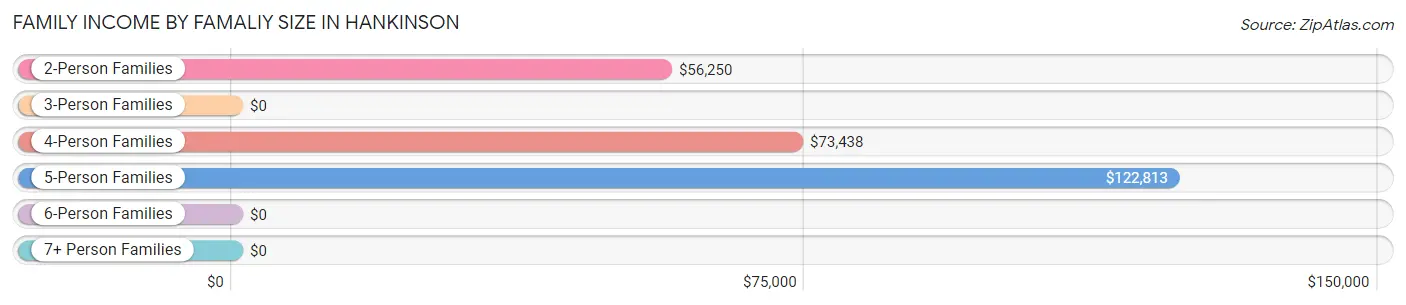
| Income Bracket | # Families | Median Income |
| 2-Person Families | 104 (54.4%) | $56,250 |
| 3-Person Families | 14 (7.3%) | $0 |
| 4-Person Families | 50 (26.2%) | $73,438 |
| 5-Person Families | 21 (11.0%) | $122,813 |
| 6-Person Families | 0 (0.0%) | $0 |
| 7+ Person Families | 2 (1.1%) | $0 |
| Total | 191 (100.0%) | $73,594 |
Family Income by Number of Earners in Hankinson
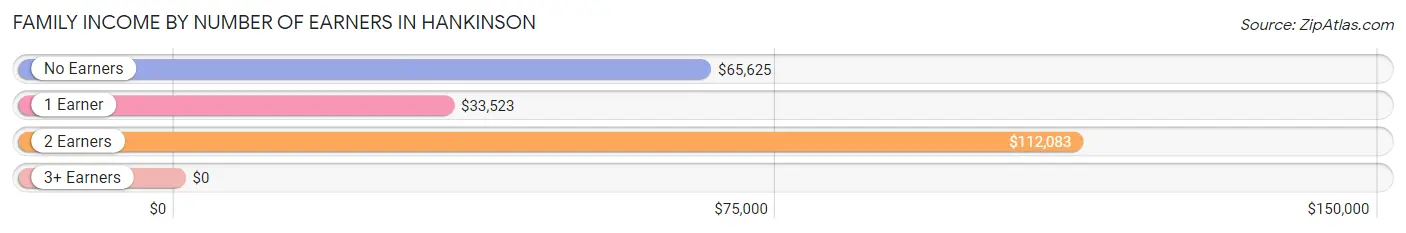
| Number of Earners | # Families | Median Income |
| No Earners | 33 (17.3%) | $65,625 |
| 1 Earner | 65 (34.0%) | $33,523 |
| 2 Earners | 83 (43.5%) | $112,083 |
| 3+ Earners | 10 (5.2%) | $0 |
| Total | 191 (100.0%) | $73,594 |
Household Income in Hankinson
Household Income Brackets in Hankinson
With 71 households falling in the category, the $50,000 to $74,999 income range is the most frequent in Hankinson, accounting for 23.4% of all households. In contrast, only 8 households (2.6%) fall into the $15,000 to $24,999 income bracket, making it the least populous group.
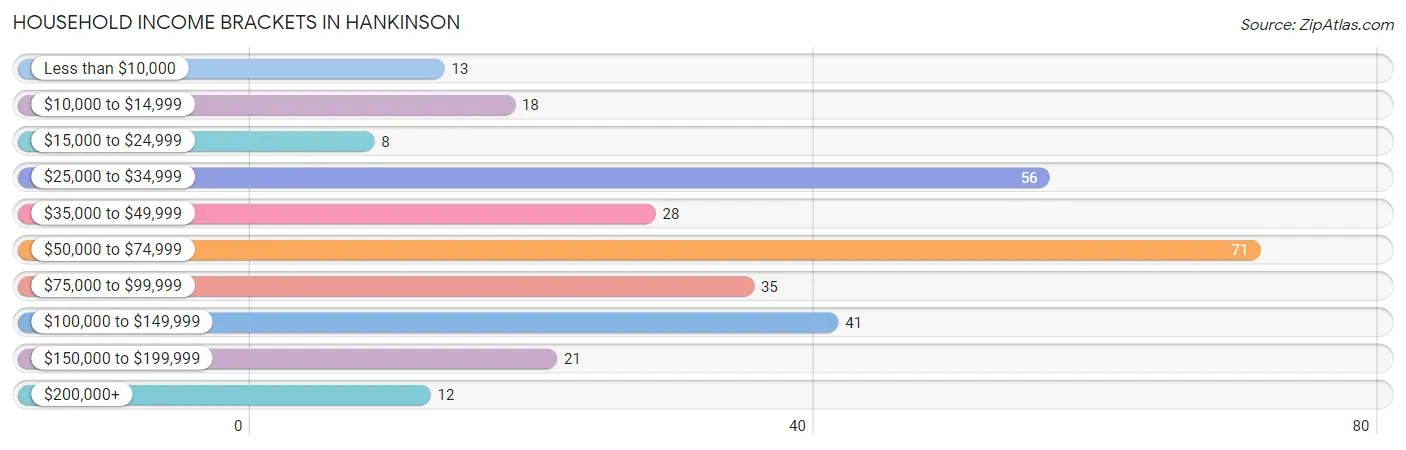
| Income Bracket | # Households | % Households |
| Less than $10,000 | 13 | 4.3% |
| $10,000 to $14,999 | 18 | 5.9% |
| $15,000 to $24,999 | 8 | 2.6% |
| $25,000 to $34,999 | 56 | 18.5% |
| $35,000 to $49,999 | 28 | 9.2% |
| $50,000 to $74,999 | 71 | 23.4% |
| $75,000 to $99,999 | 35 | 11.6% |
| $100,000 to $149,999 | 41 | 13.5% |
| $150,000 to $199,999 | 21 | 6.9% |
| $200,000+ | 12 | 4.0% |
Household Income by Householder Age in Hankinson
The median household income in Hankinson is $57,031, with the highest median household income of $69,583 found in the 45 to 64 years age bracket for the primary householder. A total of 59 households (19.5%) fall into this category. Meanwhile, the 15 to 24 years age bracket for the primary householder has the lowest median household income of $0, with 7 households (2.3%) in this group.
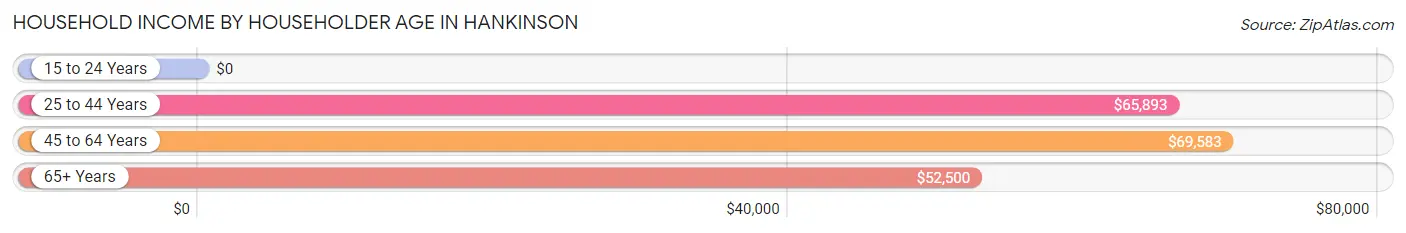
| Income Bracket | # Households | Median Income |
| 15 to 24 Years | 7 (2.3%) | $0 |
| 25 to 44 Years | 129 (42.6%) | $65,893 |
| 45 to 64 Years | 59 (19.5%) | $69,583 |
| 65+ Years | 108 (35.6%) | $52,500 |
| Total | 303 (100.0%) | $57,031 |
Poverty in Hankinson
Income Below Poverty by Sex and Age in Hankinson
With 8.2% poverty level for males and 17.3% for females among the residents of Hankinson, 35 to 44 year old males and 75 year old and over females are the most vulnerable to poverty, with 17 males (29.8%) and 23 females (59.0%) in their respective age groups living below the poverty level.
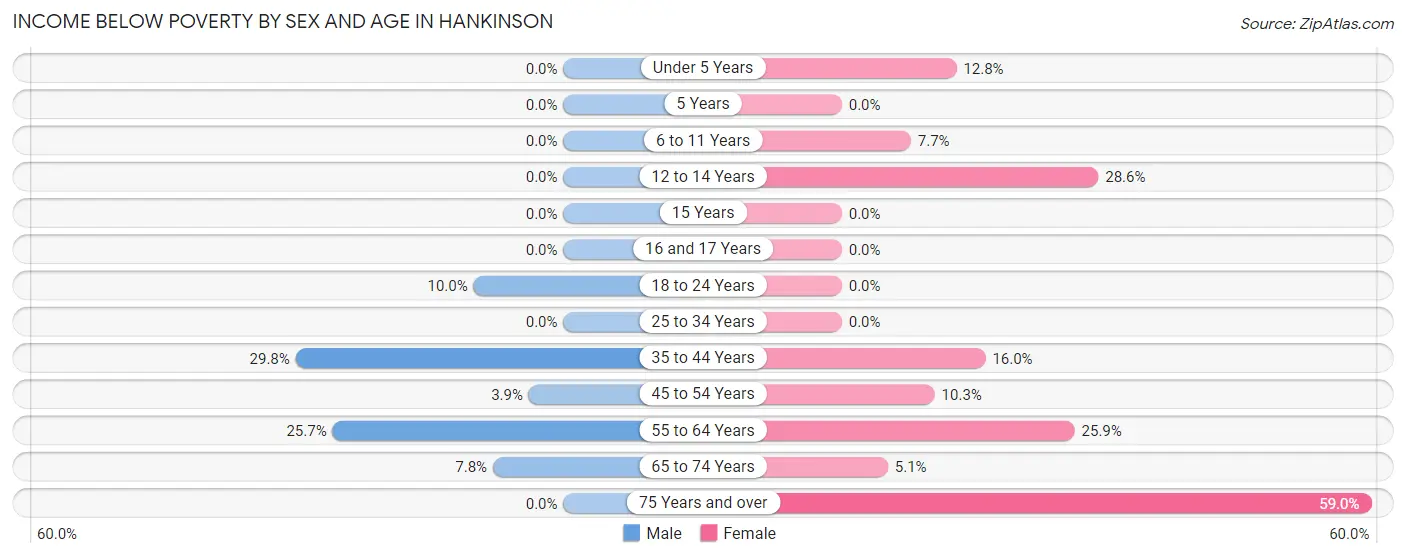
| Age Bracket | Male | Female |
| Under 5 Years | 0 (0.0%) | 6 (12.8%) |
| 5 Years | 0 (0.0%) | 0 (0.0%) |
| 6 to 11 Years | 0 (0.0%) | 2 (7.7%) |
| 12 to 14 Years | 0 (0.0%) | 10 (28.6%) |
| 15 Years | 0 (0.0%) | 0 (0.0%) |
| 16 and 17 Years | 0 (0.0%) | 0 (0.0%) |
| 18 to 24 Years | 1 (10.0%) | 0 (0.0%) |
| 25 to 34 Years | 0 (0.0%) | 0 (0.0%) |
| 35 to 44 Years | 17 (29.8%) | 8 (16.0%) |
| 45 to 54 Years | 1 (3.8%) | 3 (10.3%) |
| 55 to 64 Years | 9 (25.7%) | 7 (25.9%) |
| 65 to 74 Years | 4 (7.8%) | 2 (5.1%) |
| 75 Years and over | 0 (0.0%) | 23 (59.0%) |
| Total | 32 (8.2%) | 61 (17.3%) |
Income Above Poverty by Sex and Age in Hankinson
According to the poverty statistics in Hankinson, males aged under 5 years and females aged 5 years are the age groups that are most secure financially, with 100.0% of males and 100.0% of females in these age groups living above the poverty line.
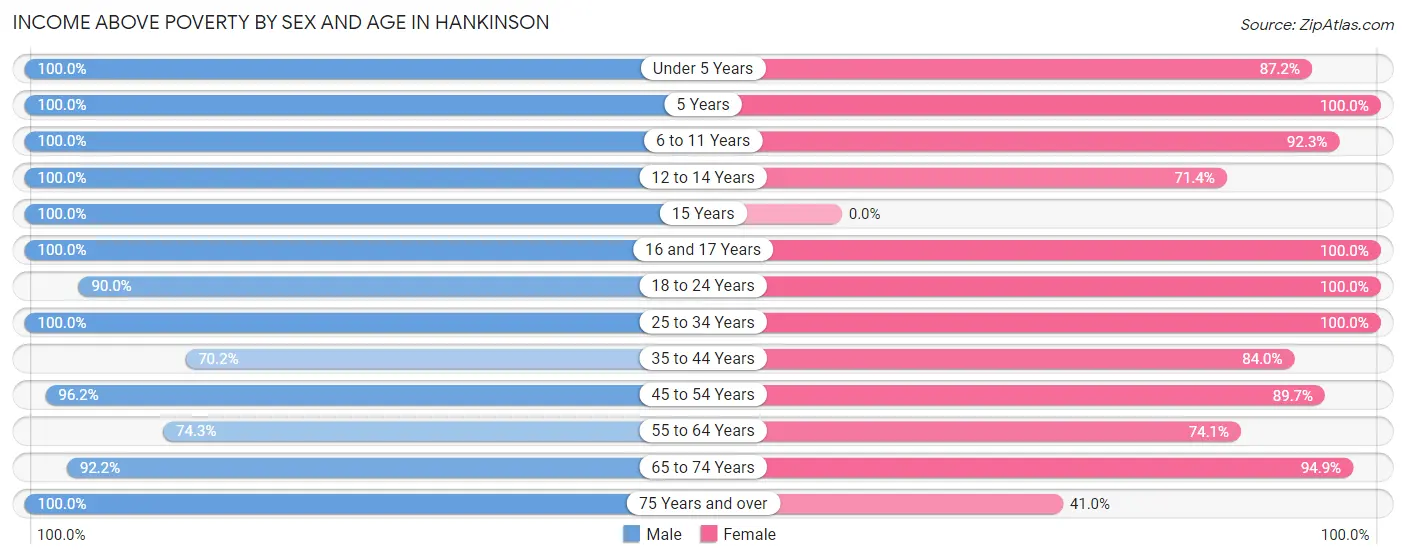
| Age Bracket | Male | Female |
| Under 5 Years | 39 (100.0%) | 41 (87.2%) |
| 5 Years | 3 (100.0%) | 5 (100.0%) |
| 6 to 11 Years | 36 (100.0%) | 24 (92.3%) |
| 12 to 14 Years | 3 (100.0%) | 25 (71.4%) |
| 15 Years | 8 (100.0%) | 0 (0.0%) |
| 16 and 17 Years | 7 (100.0%) | 6 (100.0%) |
| 18 to 24 Years | 9 (90.0%) | 3 (100.0%) |
| 25 to 34 Years | 66 (100.0%) | 46 (100.0%) |
| 35 to 44 Years | 40 (70.2%) | 42 (84.0%) |
| 45 to 54 Years | 25 (96.2%) | 26 (89.7%) |
| 55 to 64 Years | 26 (74.3%) | 20 (74.1%) |
| 65 to 74 Years | 47 (92.2%) | 37 (94.9%) |
| 75 Years and over | 51 (100.0%) | 16 (41.0%) |
| Total | 360 (91.8%) | 291 (82.7%) |
Income Below Poverty Among Married-Couple Families in Hankinson
The poverty statistics for married-couple families in Hankinson show that 3.7% or 5 of the total 135 families live below the poverty line. Families with no children have the highest poverty rate of 6.2%, comprising of 5 families. On the other hand, families with 1 or 2 children have the lowest poverty rate of 0.0%, which includes 0 families.
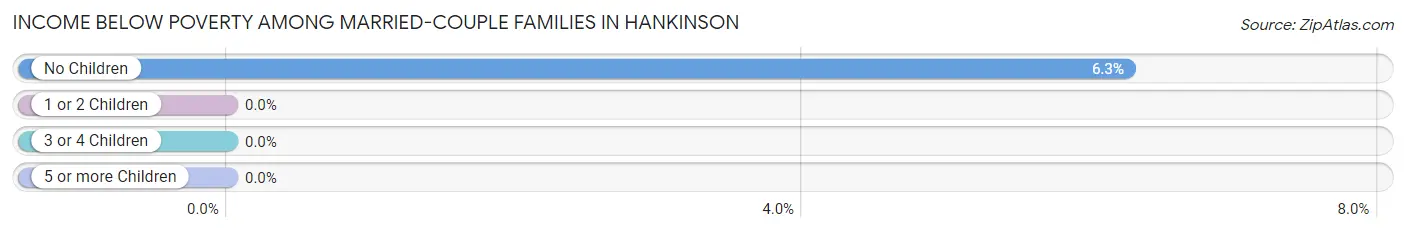
| Children | Above Poverty | Below Poverty |
| No Children | 75 (93.8%) | 5 (6.2%) |
| 1 or 2 Children | 41 (100.0%) | 0 (0.0%) |
| 3 or 4 Children | 12 (100.0%) | 0 (0.0%) |
| 5 or more Children | 2 (100.0%) | 0 (0.0%) |
| Total | 130 (96.3%) | 5 (3.7%) |
Income Below Poverty Among Single-Parent Households in Hankinson
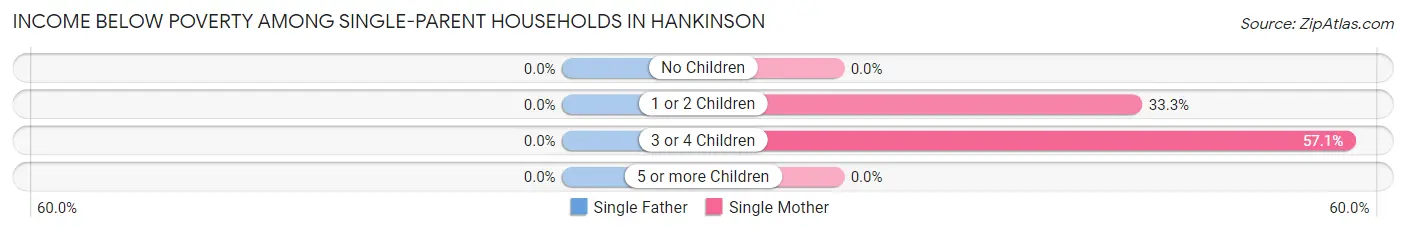
| Children | Single Father | Single Mother |
| No Children | 0 (0.0%) | 0 (0.0%) |
| 1 or 2 Children | 0 (0.0%) | 5 (33.3%) |
| 3 or 4 Children | 0 (0.0%) | 8 (57.1%) |
| 5 or more Children | 0 (0.0%) | 0 (0.0%) |
| Total | 0 (0.0%) | 13 (44.8%) |
Income Below Poverty Among Married-Couple vs Single-Parent Households in Hankinson
The poverty data for Hankinson shows that 5 of the married-couple family households (3.7%) and 13 of the single-parent households (23.2%) are living below the poverty level. Within the married-couple family households, those with no children have the highest poverty rate, with 5 households (6.2%) falling below the poverty line. Among the single-parent households, those with 3 or 4 children have the highest poverty rate, with 8 household (34.8%) living below poverty.
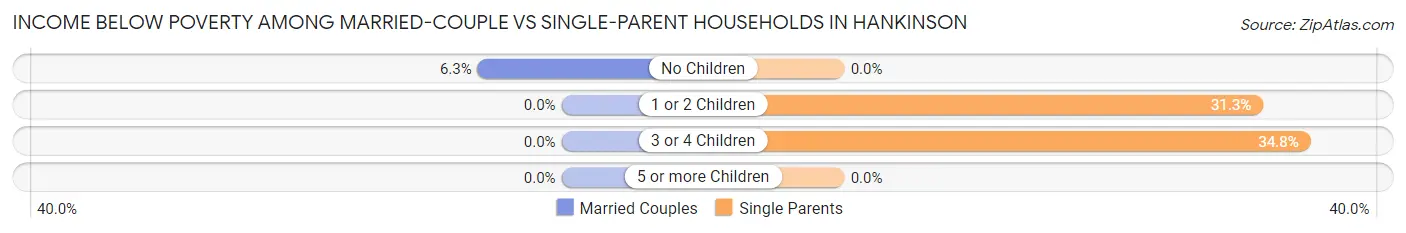
| Children | Married-Couple Families | Single-Parent Households |
| No Children | 5 (6.2%) | 0 (0.0%) |
| 1 or 2 Children | 0 (0.0%) | 5 (31.2%) |
| 3 or 4 Children | 0 (0.0%) | 8 (34.8%) |
| 5 or more Children | 0 (0.0%) | 0 (0.0%) |
| Total | 5 (3.7%) | 13 (23.2%) |
Employment Characteristics in Hankinson
Employment by Class of Employer in Hankinson
Among the 283 employed individuals in Hankinson, private company employees (139 | 49.1%), local government employees (51 | 18.0%), and self-employed (not incorporated) (44 | 15.5%) make up the most common classes of employment.
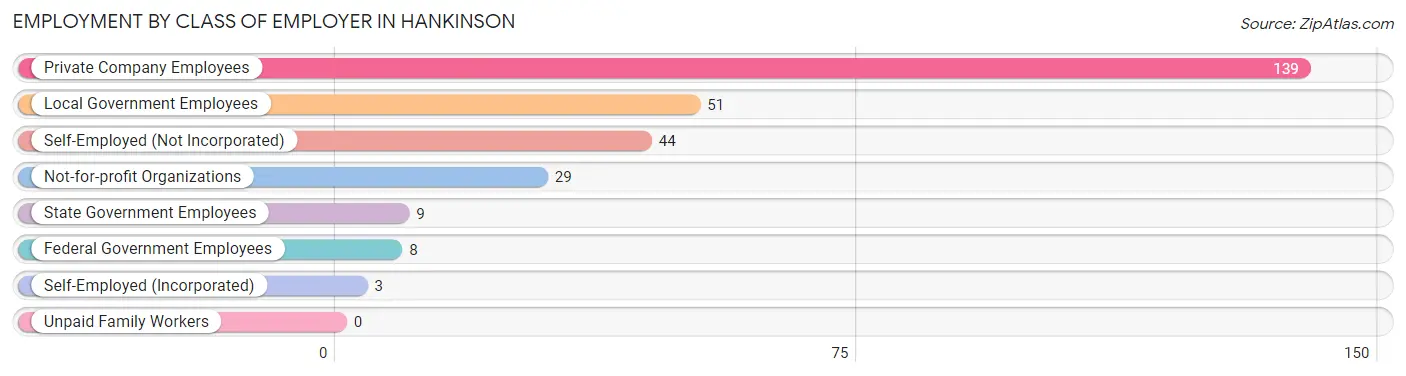
| Employer Class | # Employees | % Employees |
| Private Company Employees | 139 | 49.1% |
| Self-Employed (Incorporated) | 3 | 1.1% |
| Self-Employed (Not Incorporated) | 44 | 15.5% |
| Not-for-profit Organizations | 29 | 10.2% |
| Local Government Employees | 51 | 18.0% |
| State Government Employees | 9 | 3.2% |
| Federal Government Employees | 8 | 2.8% |
| Unpaid Family Workers | 0 | 0.0% |
| Total | 283 | 100.0% |
Employment Status by Age in Hankinson
According to the labor force statistics for Hankinson, out of the total population over 16 years of age (588), 51.4% or 302 individuals are in the labor force, with 3.6% or 11 of them unemployed. The age group with the highest labor force participation rate is 20 to 24 years, with 100.0% or 10 individuals in the labor force. Within the labor force, the 35 to 44 years age range has the highest percentage of unemployed individuals, with 11.1% or 11 of them being unemployed.
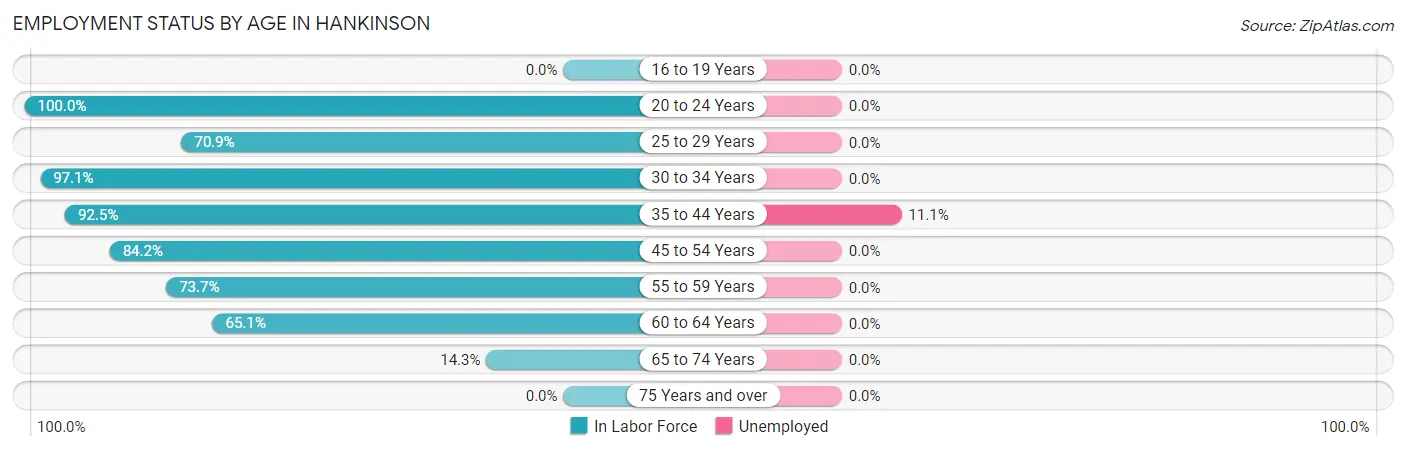
| Age Bracket | In Labor Force | Unemployed |
| 16 to 19 Years | 0 (0.0%) | 0 (0.0%) |
| 20 to 24 Years | 10 (100.0%) | 0 (0.0%) |
| 25 to 29 Years | 56 (70.9%) | 0 (0.0%) |
| 30 to 34 Years | 33 (97.1%) | 0 (0.0%) |
| 35 to 44 Years | 99 (92.5%) | 11 (11.1%) |
| 45 to 54 Years | 48 (84.2%) | 0 (0.0%) |
| 55 to 59 Years | 14 (73.7%) | 0 (0.0%) |
| 60 to 64 Years | 28 (65.1%) | 0 (0.0%) |
| 65 to 74 Years | 14 (14.3%) | 0 (0.0%) |
| 75 Years and over | 0 (0.0%) | 0 (0.0%) |
| Total | 302 (51.4%) | 11 (3.6%) |
Employment Status by Educational Attainment in Hankinson
According to labor force statistics for Hankinson, 82.0% of individuals (278) out of the total population between 25 and 64 years of age (339) are in the labor force, with 4.0% or 11 of them being unemployed. The group with the highest labor force participation rate are those with the educational attainment of bachelor's degree or higher, with 92.3% or 72 individuals in the labor force. Within the labor force, individuals with college / associate degree education have the highest percentage of unemployment, with 9.2% or 11 of them being unemployed.
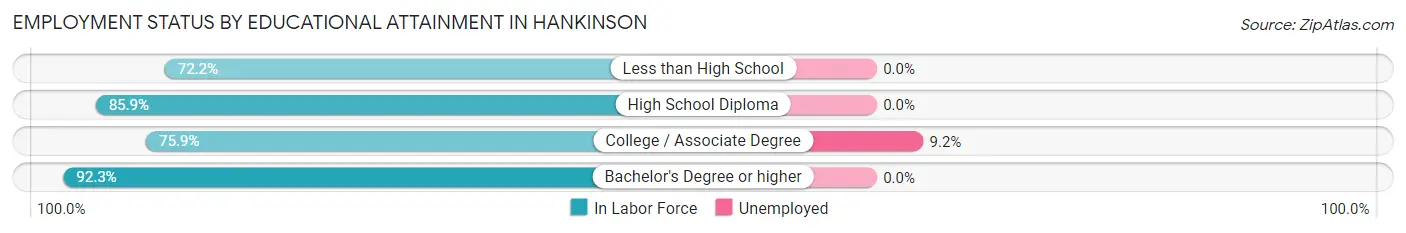
| Educational Attainment | In Labor Force | Unemployed |
| Less than High School | 13 (72.2%) | 0 (0.0%) |
| High School Diploma | 73 (85.9%) | 0 (0.0%) |
| College / Associate Degree | 120 (75.9%) | 15 (9.2%) |
| Bachelor's Degree or higher | 72 (92.3%) | 0 (0.0%) |
| Total | 278 (82.0%) | 14 (4.0%) |
Employment Occupations by Sex in Hankinson
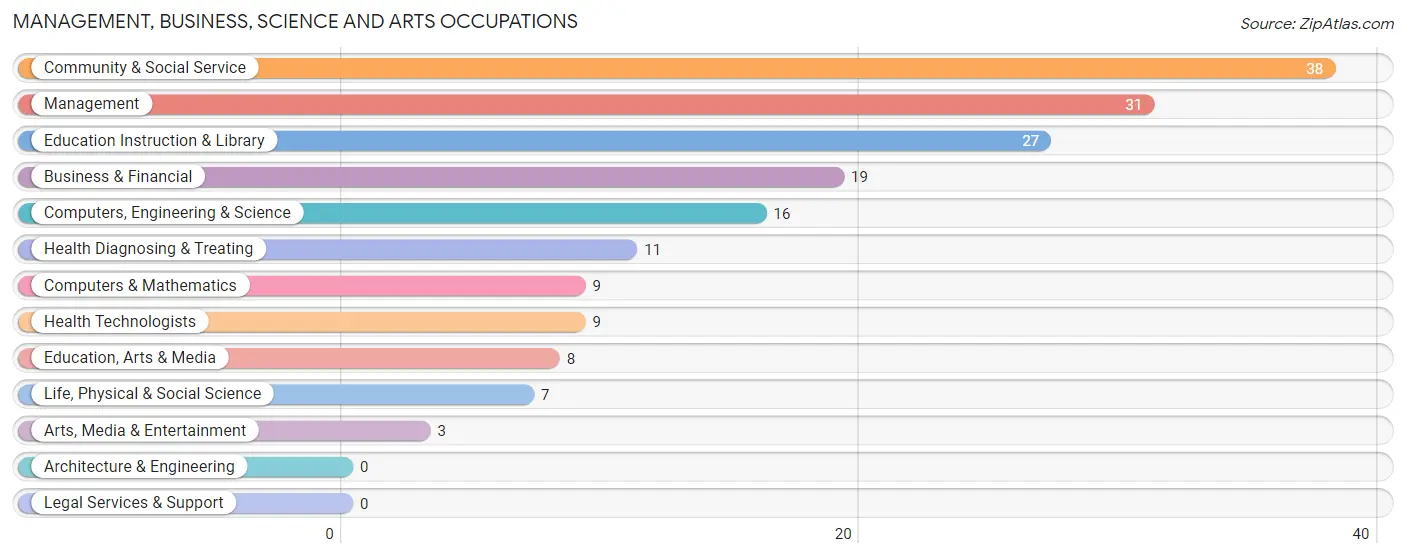
Management, Business, Science and Arts Occupations
The most common Management, Business, Science and Arts occupations in Hankinson are Community & Social Service (38 | 13.1%), Management (31 | 10.6%), Education Instruction & Library (27 | 9.3%), Business & Financial (19 | 6.5%), and Computers, Engineering & Science (16 | 5.5%).
Management, Business, Science and Arts Occupations by Sex
Within the Management, Business, Science and Arts occupations in Hankinson, the most male-oriented occupations are Computers & Mathematics (100.0%), Arts, Media & Entertainment (100.0%), and Management (93.5%), while the most female-oriented occupations are Education, Arts & Media (100.0%), Health Diagnosing & Treating (100.0%), and Health Technologists (100.0%).
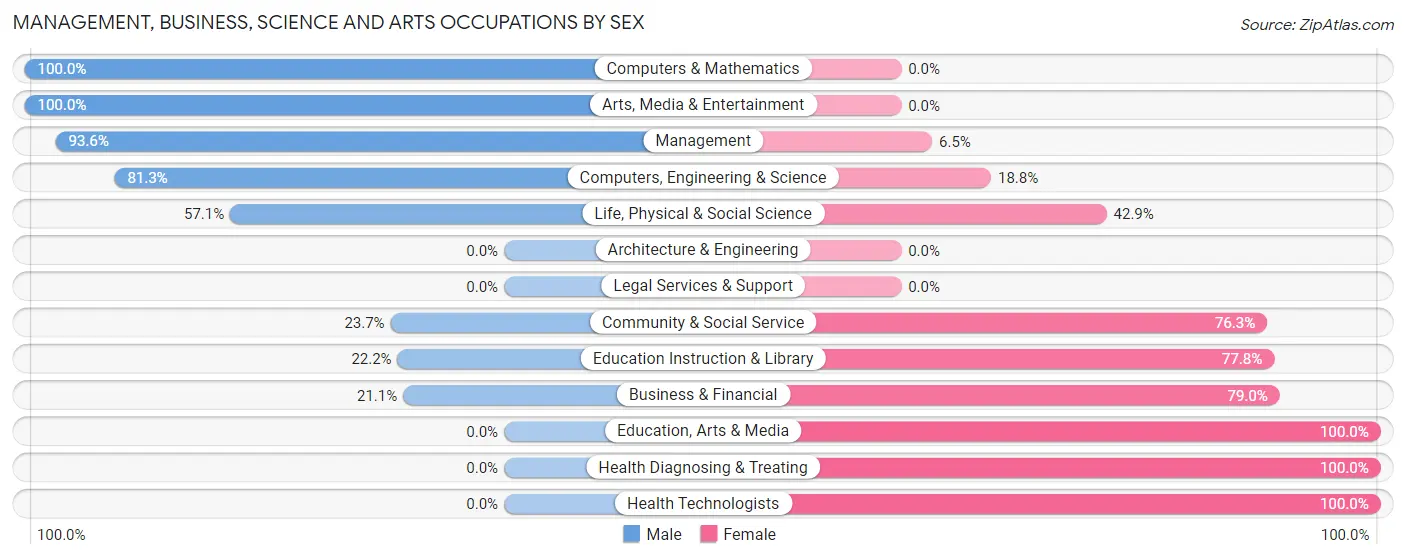
| Occupation | Male | Female |
| Management | 29 (93.5%) | 2 (6.5%) |
| Business & Financial | 4 (21.0%) | 15 (78.9%) |
| Computers, Engineering & Science | 13 (81.2%) | 3 (18.8%) |
| Computers & Mathematics | 9 (100.0%) | 0 (0.0%) |
| Architecture & Engineering | 0 (0.0%) | 0 (0.0%) |
| Life, Physical & Social Science | 4 (57.1%) | 3 (42.9%) |
| Community & Social Service | 9 (23.7%) | 29 (76.3%) |
| Education, Arts & Media | 0 (0.0%) | 8 (100.0%) |
| Legal Services & Support | 0 (0.0%) | 0 (0.0%) |
| Education Instruction & Library | 6 (22.2%) | 21 (77.8%) |
| Arts, Media & Entertainment | 3 (100.0%) | 0 (0.0%) |
| Health Diagnosing & Treating | 0 (0.0%) | 11 (100.0%) |
| Health Technologists | 0 (0.0%) | 9 (100.0%) |
| Total (Category) | 55 (47.8%) | 60 (52.2%) |
| Total (Overall) | 161 (55.3%) | 130 (44.7%) |
Services Occupations
The most common Services occupations in Hankinson are Cleaning & Maintenance (21 | 7.2%), Food Preparation & Serving (19 | 6.5%), Security & Protection (6 | 2.1%), Law Enforcement (6 | 2.1%), and Healthcare Support (5 | 1.7%).
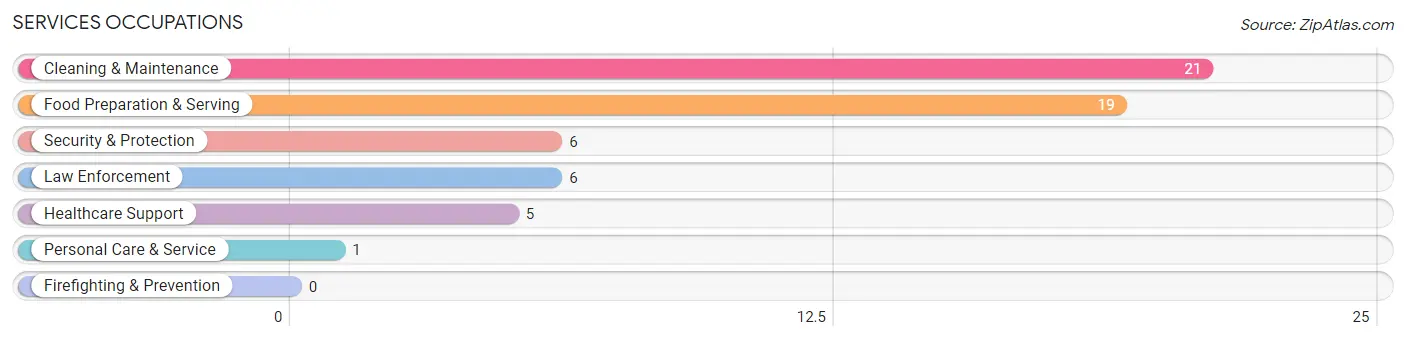
Services Occupations by Sex
Within the Services occupations in Hankinson, the most male-oriented occupations are Security & Protection (100.0%), Law Enforcement (100.0%), and Cleaning & Maintenance (52.4%), while the most female-oriented occupations are Healthcare Support (100.0%), Personal Care & Service (100.0%), and Food Preparation & Serving (84.2%).
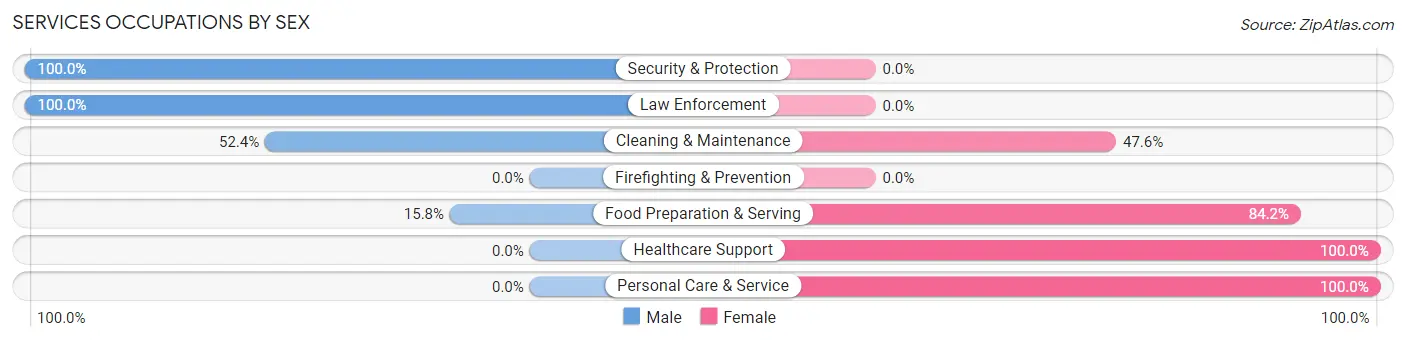
| Occupation | Male | Female |
| Healthcare Support | 0 (0.0%) | 5 (100.0%) |
| Security & Protection | 6 (100.0%) | 0 (0.0%) |
| Firefighting & Prevention | 0 (0.0%) | 0 (0.0%) |
| Law Enforcement | 6 (100.0%) | 0 (0.0%) |
| Food Preparation & Serving | 3 (15.8%) | 16 (84.2%) |
| Cleaning & Maintenance | 11 (52.4%) | 10 (47.6%) |
| Personal Care & Service | 0 (0.0%) | 1 (100.0%) |
| Total (Category) | 20 (38.5%) | 32 (61.5%) |
| Total (Overall) | 161 (55.3%) | 130 (44.7%) |
Sales and Office Occupations
The most common Sales and Office occupations in Hankinson are Office & Administration (23 | 7.9%), and Sales & Related (10 | 3.4%).
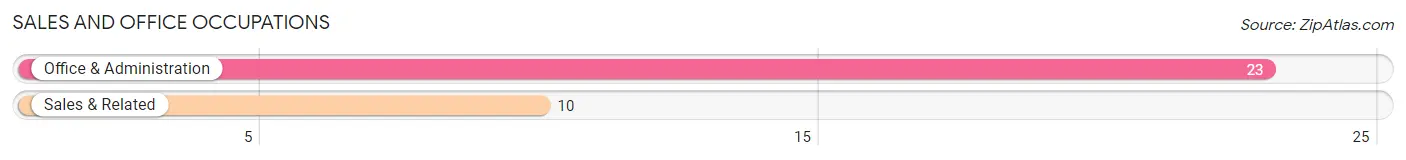
Sales and Office Occupations by Sex
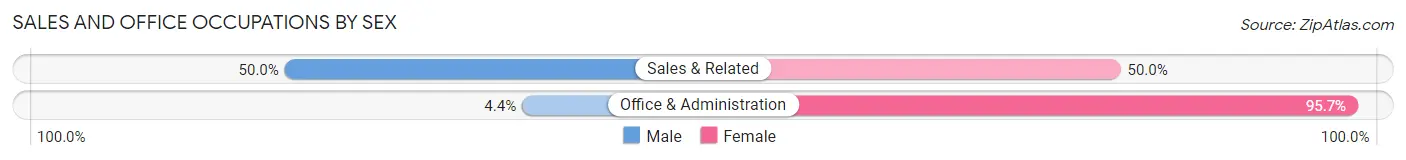
| Occupation | Male | Female |
| Sales & Related | 5 (50.0%) | 5 (50.0%) |
| Office & Administration | 1 (4.3%) | 22 (95.7%) |
| Total (Category) | 6 (18.2%) | 27 (81.8%) |
| Total (Overall) | 161 (55.3%) | 130 (44.7%) |
Natural Resources, Construction and Maintenance Occupations
The most common Natural Resources, Construction and Maintenance occupations in Hankinson are Installation, Maintenance & Repair (23 | 7.9%), Construction & Extraction (14 | 4.8%), and Farming, Fishing & Forestry (5 | 1.7%).
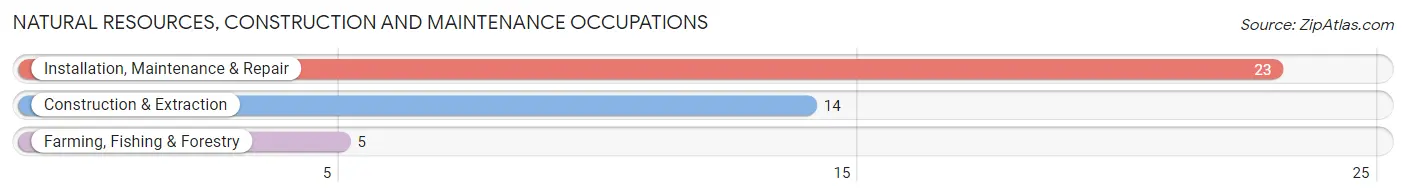
Natural Resources, Construction and Maintenance Occupations by Sex
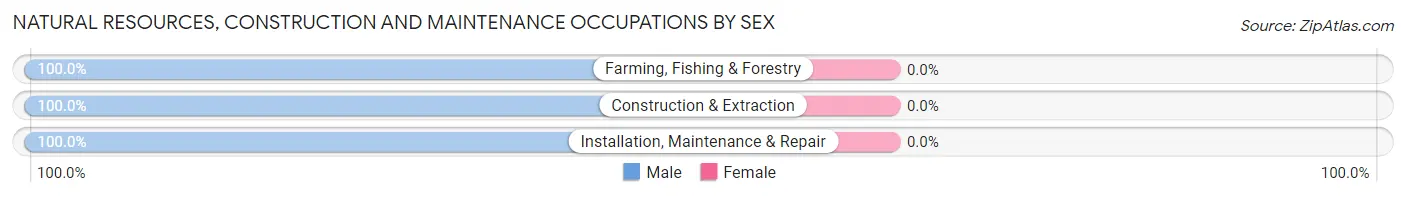
| Occupation | Male | Female |
| Farming, Fishing & Forestry | 5 (100.0%) | 0 (0.0%) |
| Construction & Extraction | 14 (100.0%) | 0 (0.0%) |
| Installation, Maintenance & Repair | 23 (100.0%) | 0 (0.0%) |
| Total (Category) | 42 (100.0%) | 0 (0.0%) |
| Total (Overall) | 161 (55.3%) | 130 (44.7%) |
Production, Transportation and Moving Occupations
The most common Production, Transportation and Moving occupations in Hankinson are Production (24 | 8.3%), Material Moving (13 | 4.5%), and Transportation (12 | 4.1%).
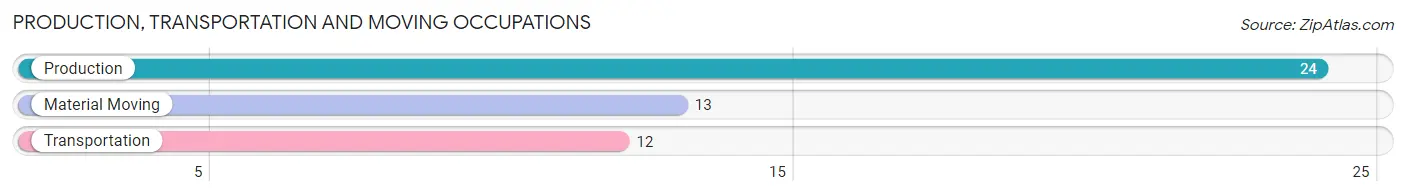
Production, Transportation and Moving Occupations by Sex
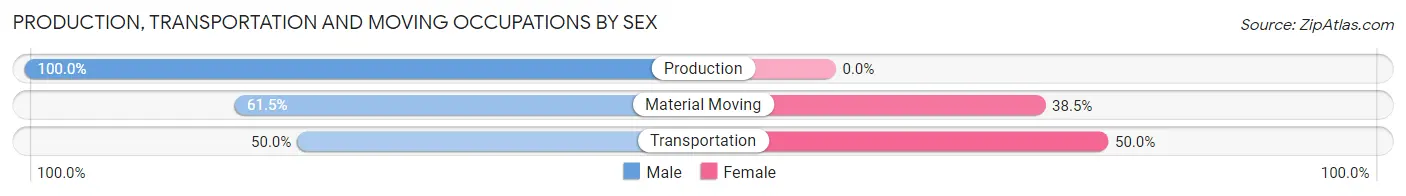
| Occupation | Male | Female |
| Production | 24 (100.0%) | 0 (0.0%) |
| Transportation | 6 (50.0%) | 6 (50.0%) |
| Material Moving | 8 (61.5%) | 5 (38.5%) |
| Total (Category) | 38 (77.5%) | 11 (22.5%) |
| Total (Overall) | 161 (55.3%) | 130 (44.7%) |
Employment Industries by Sex in Hankinson
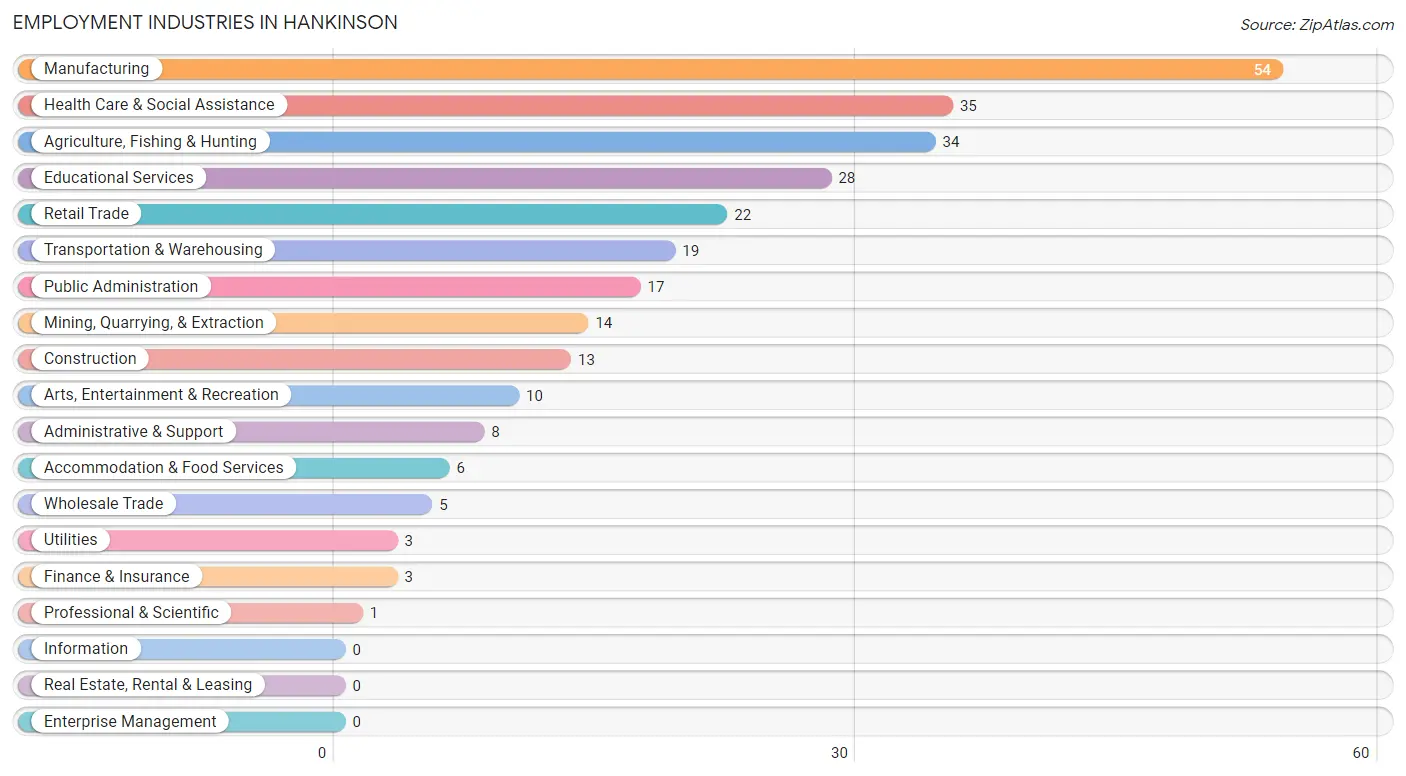
Employment Industries in Hankinson
The major employment industries in Hankinson include Manufacturing (54 | 18.6%), Health Care & Social Assistance (35 | 12.0%), Agriculture, Fishing & Hunting (34 | 11.7%), Educational Services (28 | 9.6%), and Retail Trade (22 | 7.6%).
Employment Industries by Sex in Hankinson
The Hankinson industries that see more men than women are Agriculture, Fishing & Hunting (100.0%), Utilities (100.0%), and Finance & Insurance (100.0%), whereas the industries that tend to have a higher number of women are Health Care & Social Assistance (100.0%), Arts, Entertainment & Recreation (90.0%), and Transportation & Warehousing (84.2%).
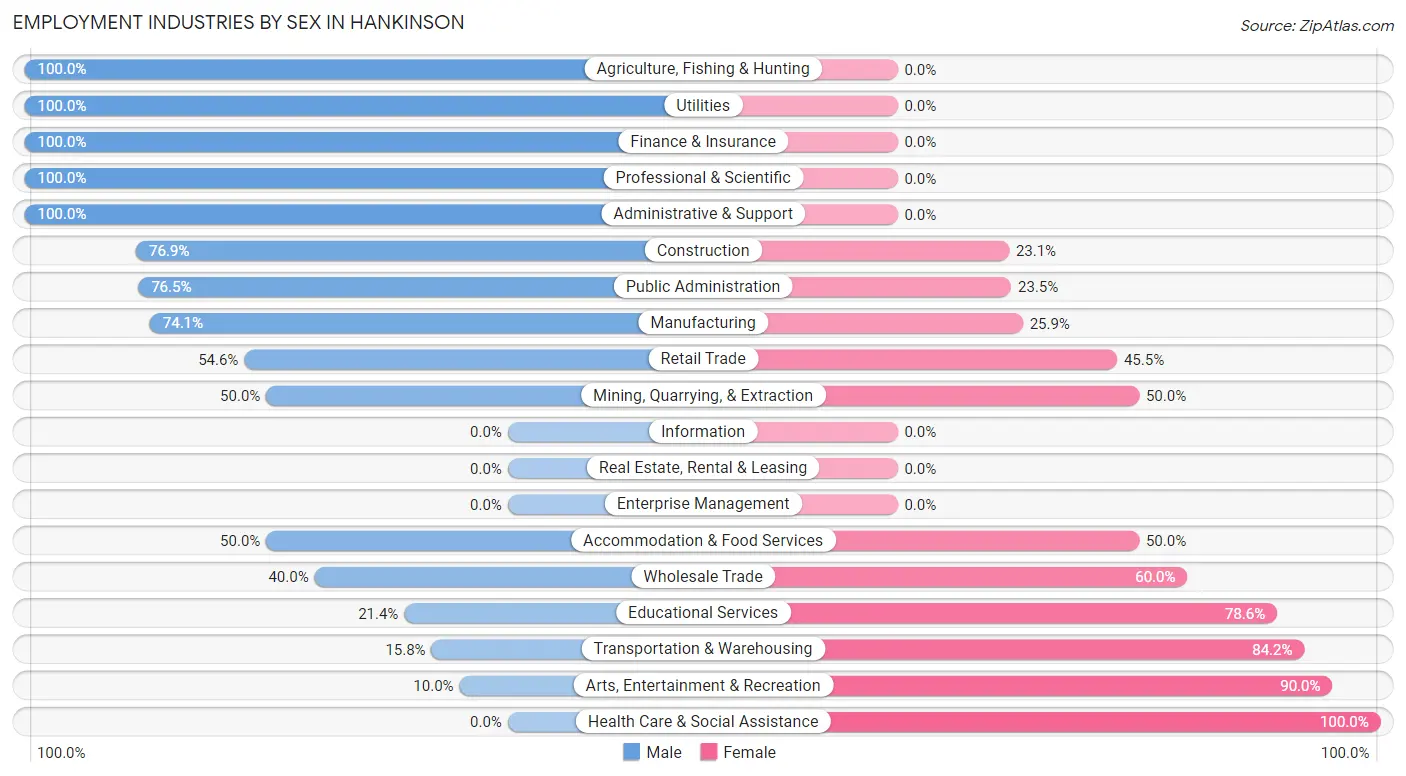
| Industry | Male | Female |
| Agriculture, Fishing & Hunting | 34 (100.0%) | 0 (0.0%) |
| Mining, Quarrying, & Extraction | 7 (50.0%) | 7 (50.0%) |
| Construction | 10 (76.9%) | 3 (23.1%) |
| Manufacturing | 40 (74.1%) | 14 (25.9%) |
| Wholesale Trade | 2 (40.0%) | 3 (60.0%) |
| Retail Trade | 12 (54.5%) | 10 (45.5%) |
| Transportation & Warehousing | 3 (15.8%) | 16 (84.2%) |
| Utilities | 3 (100.0%) | 0 (0.0%) |
| Information | 0 (0.0%) | 0 (0.0%) |
| Finance & Insurance | 3 (100.0%) | 0 (0.0%) |
| Real Estate, Rental & Leasing | 0 (0.0%) | 0 (0.0%) |
| Professional & Scientific | 1 (100.0%) | 0 (0.0%) |
| Enterprise Management | 0 (0.0%) | 0 (0.0%) |
| Administrative & Support | 8 (100.0%) | 0 (0.0%) |
| Educational Services | 6 (21.4%) | 22 (78.6%) |
| Health Care & Social Assistance | 0 (0.0%) | 35 (100.0%) |
| Arts, Entertainment & Recreation | 1 (10.0%) | 9 (90.0%) |
| Accommodation & Food Services | 3 (50.0%) | 3 (50.0%) |
| Public Administration | 13 (76.5%) | 4 (23.5%) |
| Total | 161 (55.3%) | 130 (44.7%) |
Education in Hankinson
School Enrollment in Hankinson
The most common levels of schooling among the 152 students in Hankinson are middle school (51 | 33.6%), elementary school (46 | 30.3%), and high school (27 | 17.8%).
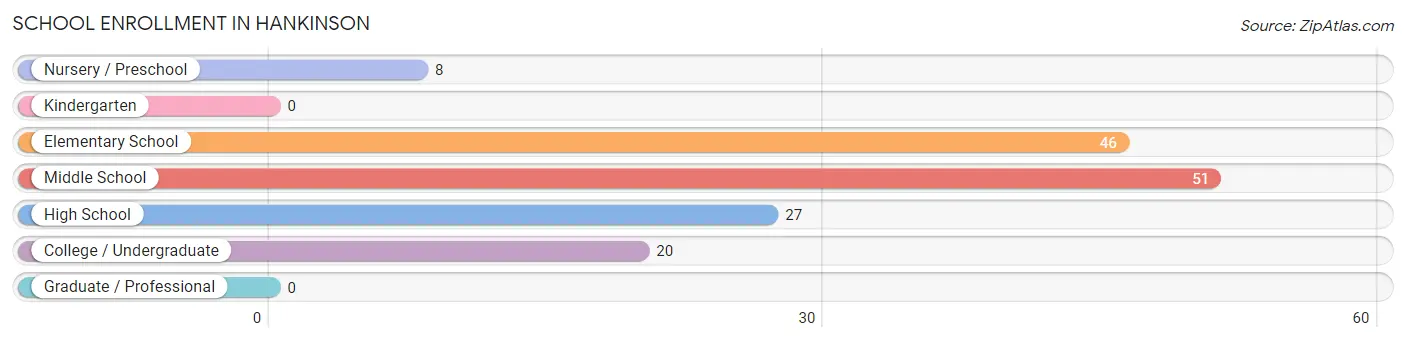
| School Level | # Students | % Students |
| Nursery / Preschool | 8 | 5.3% |
| Kindergarten | 0 | 0.0% |
| Elementary School | 46 | 30.3% |
| Middle School | 51 | 33.6% |
| High School | 27 | 17.8% |
| College / Undergraduate | 20 | 13.2% |
| Graduate / Professional | 0 | 0.0% |
| Total | 152 | 100.0% |
School Enrollment by Age by Funding Source in Hankinson
Out of a total of 152 students who are enrolled in schools in Hankinson, 8 (5.3%) attend a private institution, while the remaining 144 (94.7%) are enrolled in public schools. The age group of 25 to 34 year olds has the highest likelihood of being enrolled in private schools, with 4 (50.0% in the age bracket) enrolled. Conversely, the age group of 3 to 4 year olds has the lowest likelihood of being enrolled in a private school, with 3 (100.0% in the age bracket) attending a public institution.
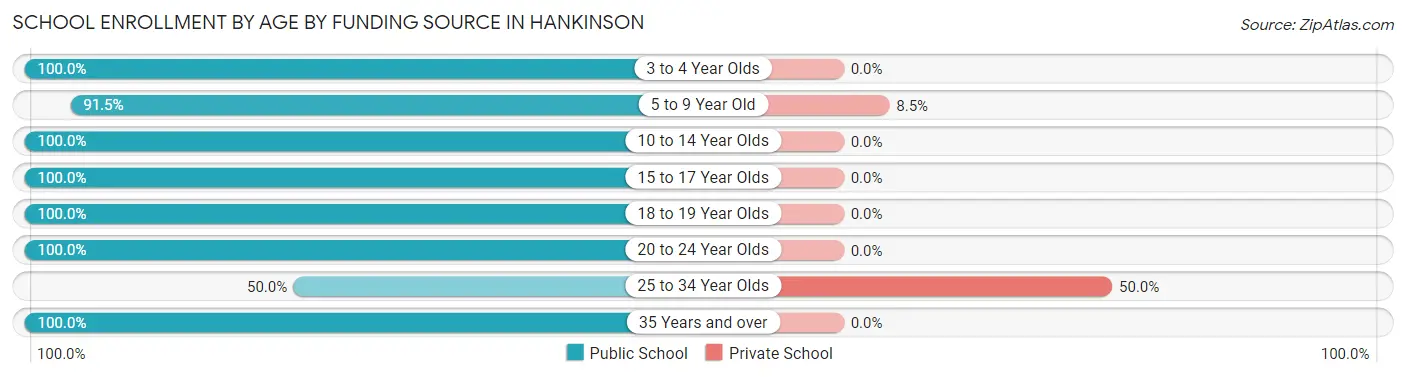
| Age Bracket | Public School | Private School |
| 3 to 4 Year Olds | 3 (100.0%) | 0 (0.0%) |
| 5 to 9 Year Old | 43 (91.5%) | 4 (8.5%) |
| 10 to 14 Year Olds | 58 (100.0%) | 0 (0.0%) |
| 15 to 17 Year Olds | 21 (100.0%) | 0 (0.0%) |
| 18 to 19 Year Olds | 3 (100.0%) | 0 (0.0%) |
| 20 to 24 Year Olds | 1 (100.0%) | 0 (0.0%) |
| 25 to 34 Year Olds | 4 (50.0%) | 4 (50.0%) |
| 35 Years and over | 11 (100.0%) | 0 (0.0%) |
| Total | 144 (94.7%) | 8 (5.3%) |
Educational Attainment by Field of Study in Hankinson
Education (40 | 27.8%), arts & humanities (22 | 15.3%), business (20 | 13.9%), science & technology (17 | 11.8%), and liberal arts & history (14 | 9.7%) are the most common fields of study among 144 individuals in Hankinson who have obtained a bachelor's degree or higher.
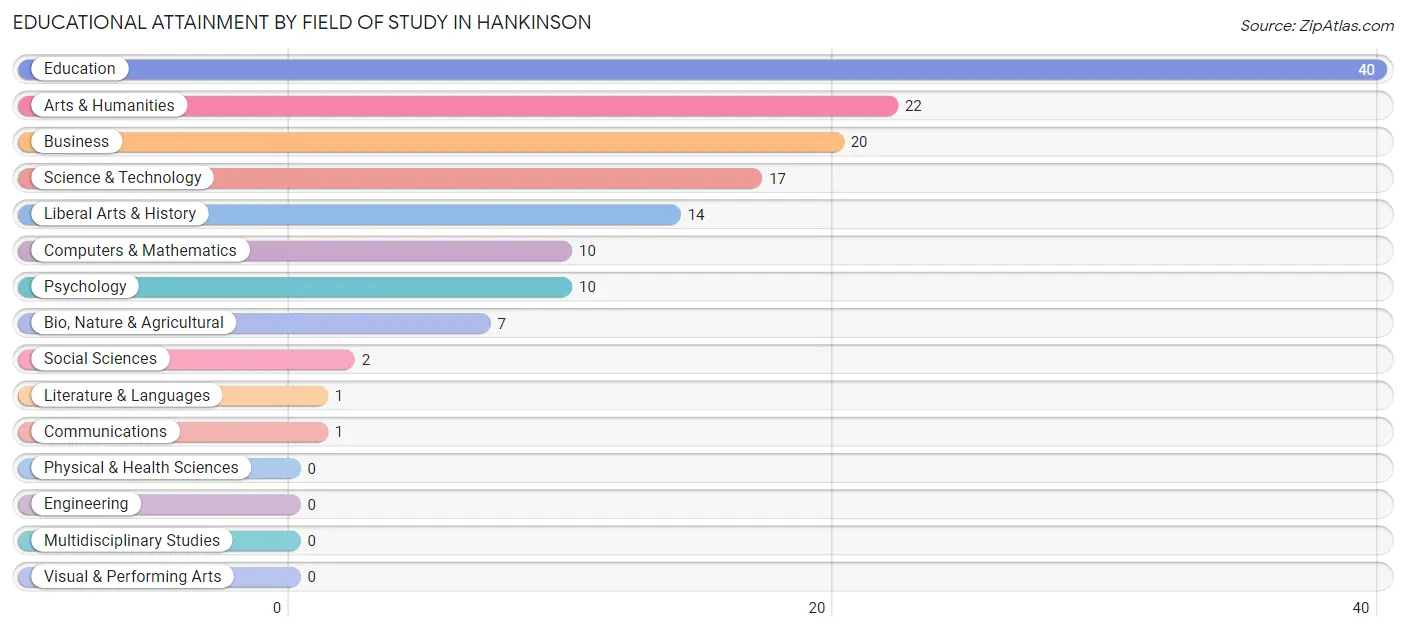
| Field of Study | # Graduates | % Graduates |
| Computers & Mathematics | 10 | 6.9% |
| Bio, Nature & Agricultural | 7 | 4.9% |
| Physical & Health Sciences | 0 | 0.0% |
| Psychology | 10 | 6.9% |
| Social Sciences | 2 | 1.4% |
| Engineering | 0 | 0.0% |
| Multidisciplinary Studies | 0 | 0.0% |
| Science & Technology | 17 | 11.8% |
| Business | 20 | 13.9% |
| Education | 40 | 27.8% |
| Literature & Languages | 1 | 0.7% |
| Liberal Arts & History | 14 | 9.7% |
| Visual & Performing Arts | 0 | 0.0% |
| Communications | 1 | 0.7% |
| Arts & Humanities | 22 | 15.3% |
| Total | 144 | 100.0% |
Transportation & Commute in Hankinson
Vehicle Availability by Sex in Hankinson
The most prevalent vehicle ownership categories in Hankinson are males with 3 vehicles (75, accounting for 47.5%) and females with 3 vehicles (63, making up 60.5%).
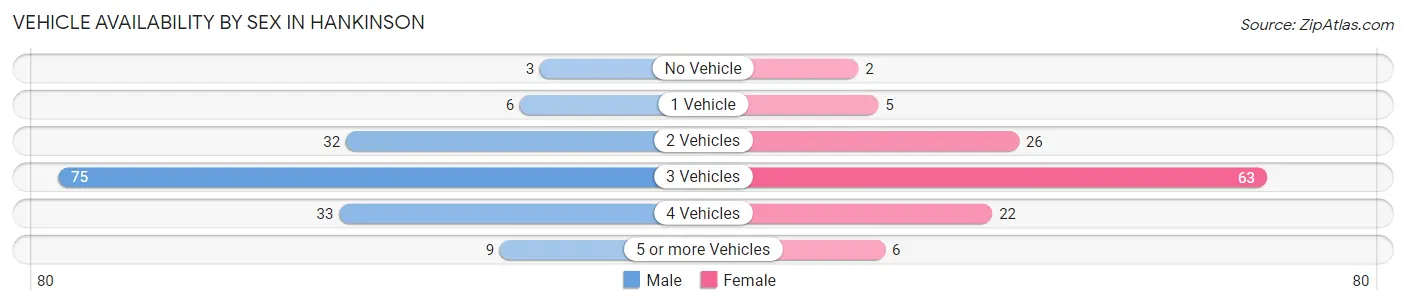
| Vehicles Available | Male | Female |
| No Vehicle | 3 (1.9%) | 2 (1.6%) |
| 1 Vehicle | 6 (3.8%) | 5 (4.0%) |
| 2 Vehicles | 32 (20.3%) | 26 (21.0%) |
| 3 Vehicles | 75 (47.5%) | 63 (50.8%) |
| 4 Vehicles | 33 (20.9%) | 22 (17.7%) |
| 5 or more Vehicles | 9 (5.7%) | 6 (4.8%) |
| Total | 158 (100.0%) | 124 (100.0%) |
Commute Time in Hankinson
The most frequently occuring commute durations in Hankinson are less than 5 minutes (80 commuters, 28.7%), 5 to 9 minutes (43 commuters, 15.4%), and 30 to 34 minutes (34 commuters, 12.2%).
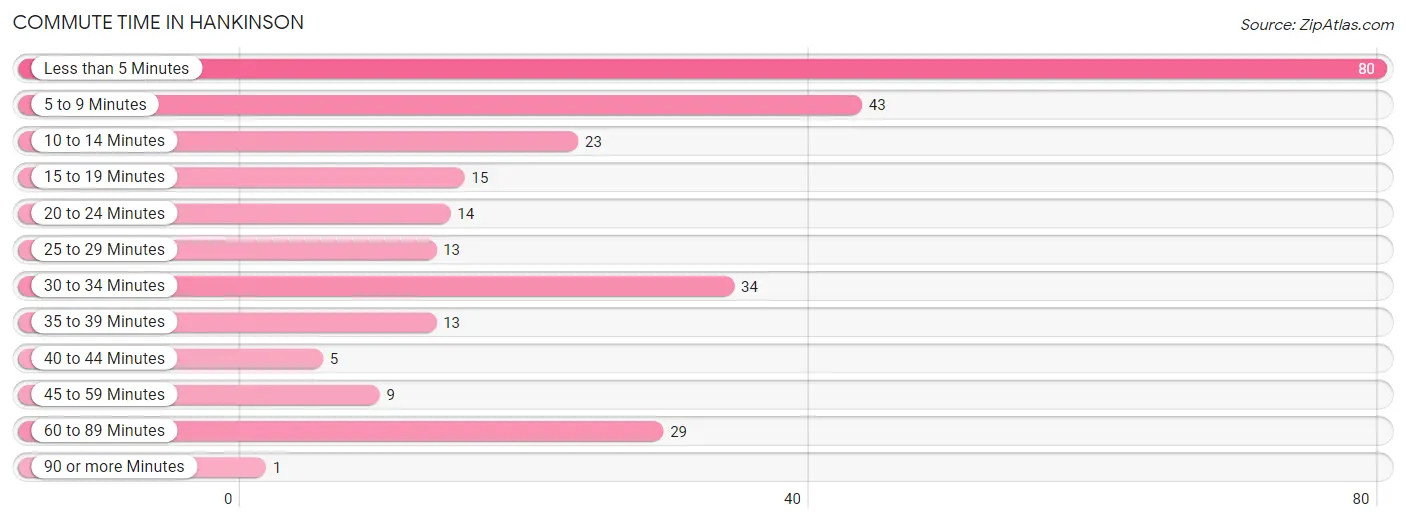
| Commute Time | # Commuters | % Commuters |
| Less than 5 Minutes | 80 | 28.7% |
| 5 to 9 Minutes | 43 | 15.4% |
| 10 to 14 Minutes | 23 | 8.2% |
| 15 to 19 Minutes | 15 | 5.4% |
| 20 to 24 Minutes | 14 | 5.0% |
| 25 to 29 Minutes | 13 | 4.7% |
| 30 to 34 Minutes | 34 | 12.2% |
| 35 to 39 Minutes | 13 | 4.7% |
| 40 to 44 Minutes | 5 | 1.8% |
| 45 to 59 Minutes | 9 | 3.2% |
| 60 to 89 Minutes | 29 | 10.4% |
| 90 or more Minutes | 1 | 0.4% |
Commute Time by Sex in Hankinson
The most common commute times in Hankinson are less than 5 minutes (41 commuters, 25.8%) for males and less than 5 minutes (39 commuters, 32.5%) for females.
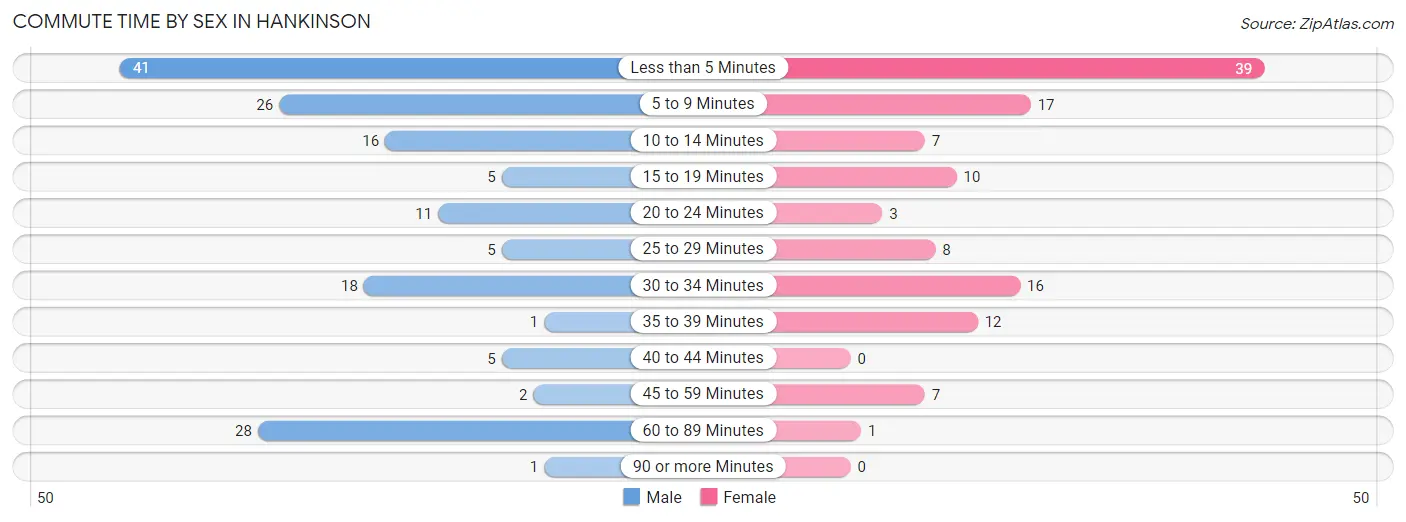
| Commute Time | Male | Female |
| Less than 5 Minutes | 41 (25.8%) | 39 (32.5%) |
| 5 to 9 Minutes | 26 (16.4%) | 17 (14.2%) |
| 10 to 14 Minutes | 16 (10.1%) | 7 (5.8%) |
| 15 to 19 Minutes | 5 (3.1%) | 10 (8.3%) |
| 20 to 24 Minutes | 11 (6.9%) | 3 (2.5%) |
| 25 to 29 Minutes | 5 (3.1%) | 8 (6.7%) |
| 30 to 34 Minutes | 18 (11.3%) | 16 (13.3%) |
| 35 to 39 Minutes | 1 (0.6%) | 12 (10.0%) |
| 40 to 44 Minutes | 5 (3.1%) | 0 (0.0%) |
| 45 to 59 Minutes | 2 (1.3%) | 7 (5.8%) |
| 60 to 89 Minutes | 28 (17.6%) | 1 (0.8%) |
| 90 or more Minutes | 1 (0.6%) | 0 (0.0%) |
Time of Departure to Work by Sex in Hankinson
The most frequent times of departure to work in Hankinson are 7:00 AM to 7:29 AM (35, 22.0%) for males and 7:00 AM to 7:29 AM (25, 20.8%) for females.
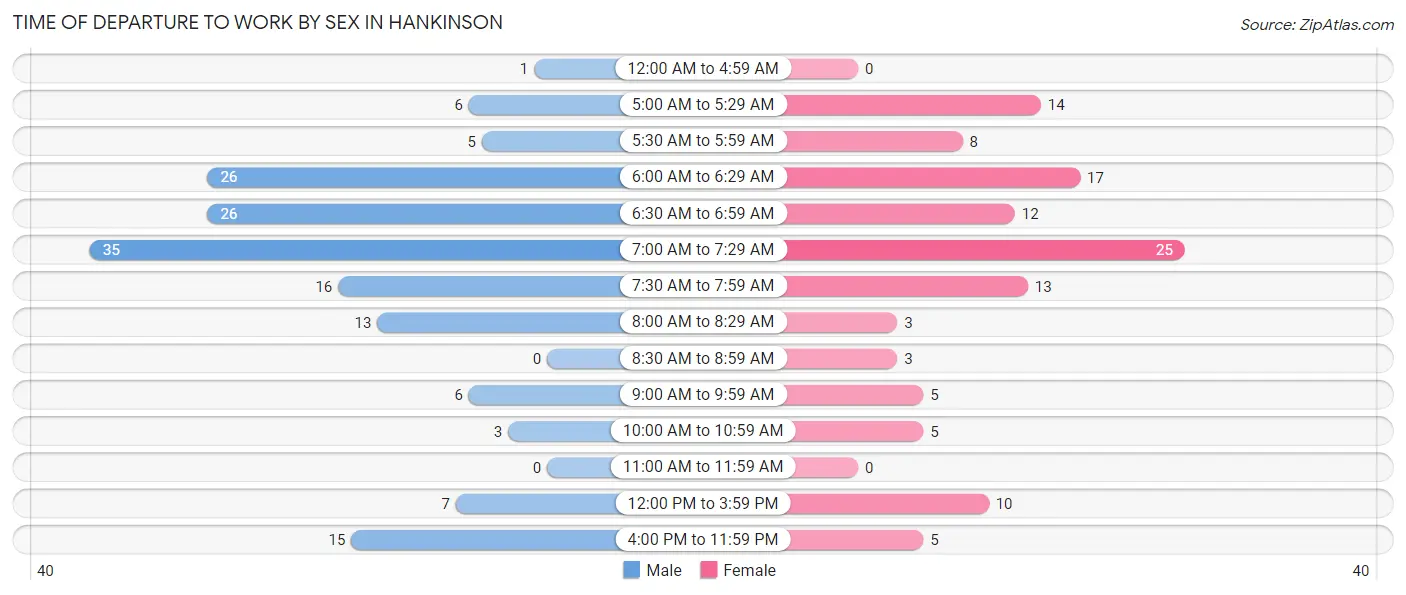
| Time of Departure | Male | Female |
| 12:00 AM to 4:59 AM | 1 (0.6%) | 0 (0.0%) |
| 5:00 AM to 5:29 AM | 6 (3.8%) | 14 (11.7%) |
| 5:30 AM to 5:59 AM | 5 (3.1%) | 8 (6.7%) |
| 6:00 AM to 6:29 AM | 26 (16.4%) | 17 (14.2%) |
| 6:30 AM to 6:59 AM | 26 (16.4%) | 12 (10.0%) |
| 7:00 AM to 7:29 AM | 35 (22.0%) | 25 (20.8%) |
| 7:30 AM to 7:59 AM | 16 (10.1%) | 13 (10.8%) |
| 8:00 AM to 8:29 AM | 13 (8.2%) | 3 (2.5%) |
| 8:30 AM to 8:59 AM | 0 (0.0%) | 3 (2.5%) |
| 9:00 AM to 9:59 AM | 6 (3.8%) | 5 (4.2%) |
| 10:00 AM to 10:59 AM | 3 (1.9%) | 5 (4.2%) |
| 11:00 AM to 11:59 AM | 0 (0.0%) | 0 (0.0%) |
| 12:00 PM to 3:59 PM | 7 (4.4%) | 10 (8.3%) |
| 4:00 PM to 11:59 PM | 15 (9.4%) | 5 (4.2%) |
| Total | 159 (100.0%) | 120 (100.0%) |
Housing Occupancy in Hankinson
Occupancy by Ownership in Hankinson
Of the total 303 dwellings in Hankinson, owner-occupied units account for 267 (88.1%), while renter-occupied units make up 36 (11.9%).
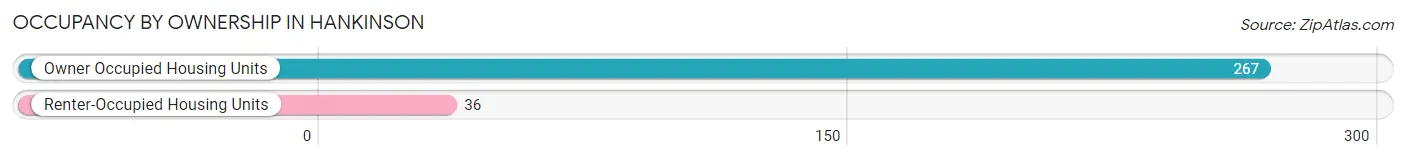
| Occupancy | # Housing Units | % Housing Units |
| Owner Occupied Housing Units | 267 | 88.1% |
| Renter-Occupied Housing Units | 36 | 11.9% |
| Total Occupied Housing Units | 303 | 100.0% |
Occupancy by Household Size in Hankinson
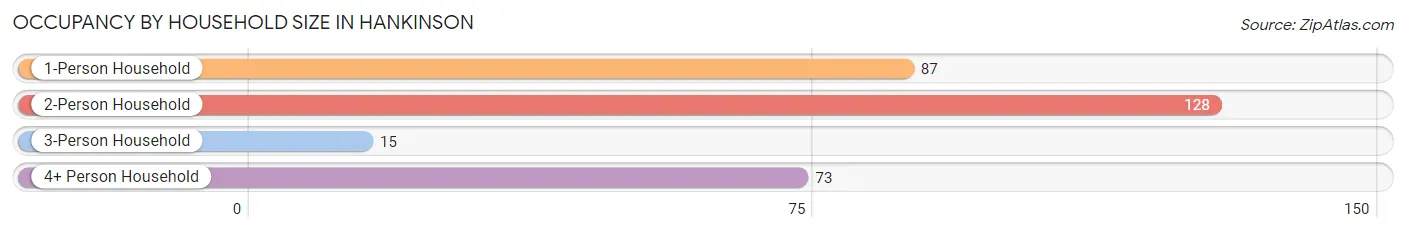
| Household Size | # Housing Units | % Housing Units |
| 1-Person Household | 87 | 28.7% |
| 2-Person Household | 128 | 42.2% |
| 3-Person Household | 15 | 5.0% |
| 4+ Person Household | 73 | 24.1% |
| Total Housing Units | 303 | 100.0% |
Occupancy by Ownership by Household Size in Hankinson
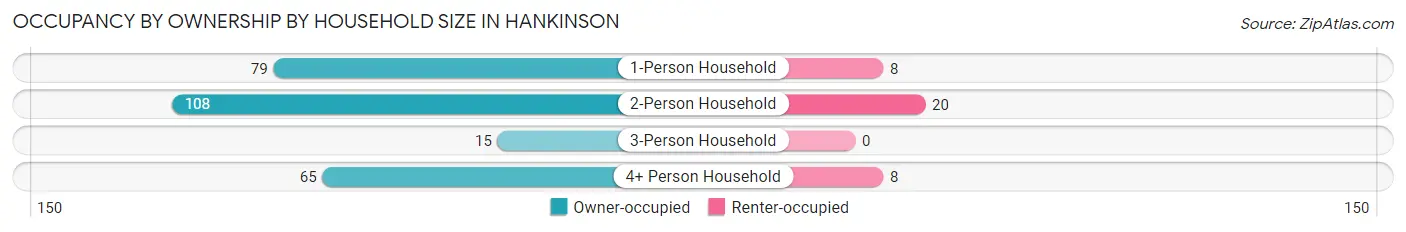
| Household Size | Owner-occupied | Renter-occupied |
| 1-Person Household | 79 (90.8%) | 8 (9.2%) |
| 2-Person Household | 108 (84.4%) | 20 (15.6%) |
| 3-Person Household | 15 (100.0%) | 0 (0.0%) |
| 4+ Person Household | 65 (89.0%) | 8 (11.0%) |
| Total Housing Units | 267 (88.1%) | 36 (11.9%) |
Occupancy by Educational Attainment in Hankinson
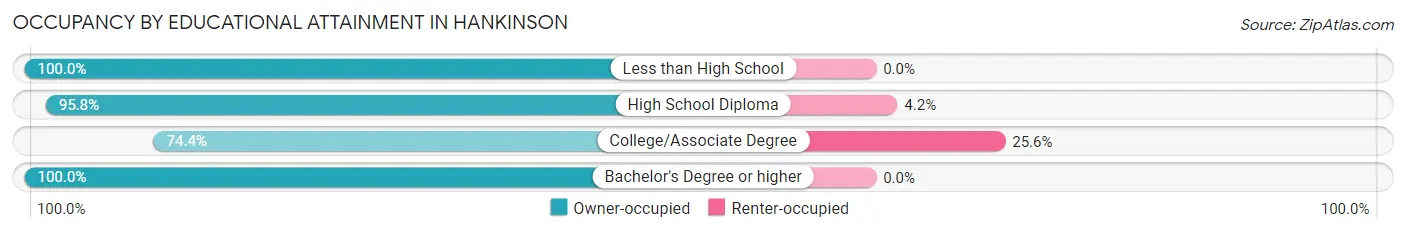
| Household Size | Owner-occupied | Renter-occupied |
| Less than High School | 22 (100.0%) | 0 (0.0%) |
| High School Diploma | 91 (95.8%) | 4 (4.2%) |
| College/Associate Degree | 93 (74.4%) | 32 (25.6%) |
| Bachelor's Degree or higher | 61 (100.0%) | 0 (0.0%) |
Occupancy by Age of Householder in Hankinson
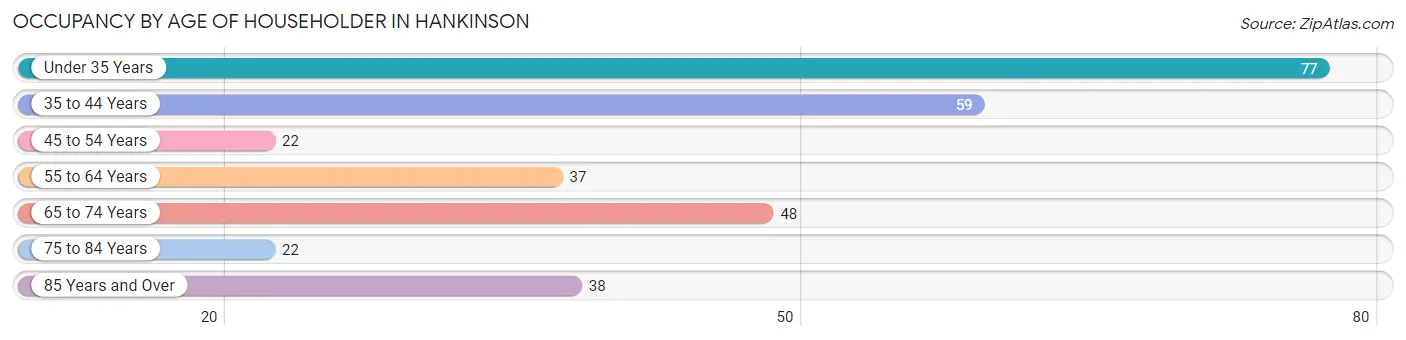
| Age Bracket | # Households | % Households |
| Under 35 Years | 77 | 25.4% |
| 35 to 44 Years | 59 | 19.5% |
| 45 to 54 Years | 22 | 7.3% |
| 55 to 64 Years | 37 | 12.2% |
| 65 to 74 Years | 48 | 15.8% |
| 75 to 84 Years | 22 | 7.3% |
| 85 Years and Over | 38 | 12.5% |
| Total | 303 | 100.0% |
Housing Finances in Hankinson
Median Income by Occupancy in Hankinson
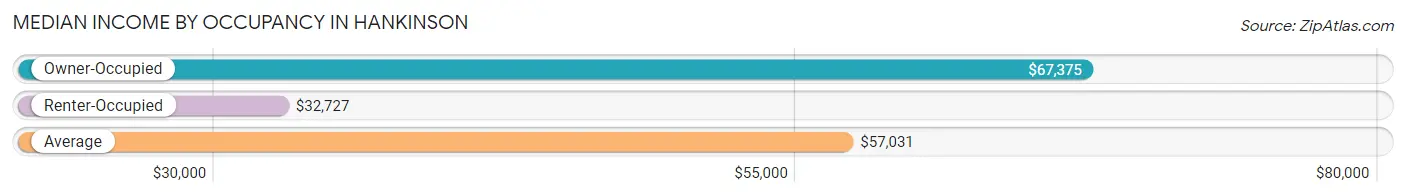
| Occupancy Type | # Households | Median Income |
| Owner-Occupied | 267 (88.1%) | $67,375 |
| Renter-Occupied | 36 (11.9%) | $32,727 |
| Average | 303 (100.0%) | $57,031 |
Occupancy by Householder Income Bracket in Hankinson
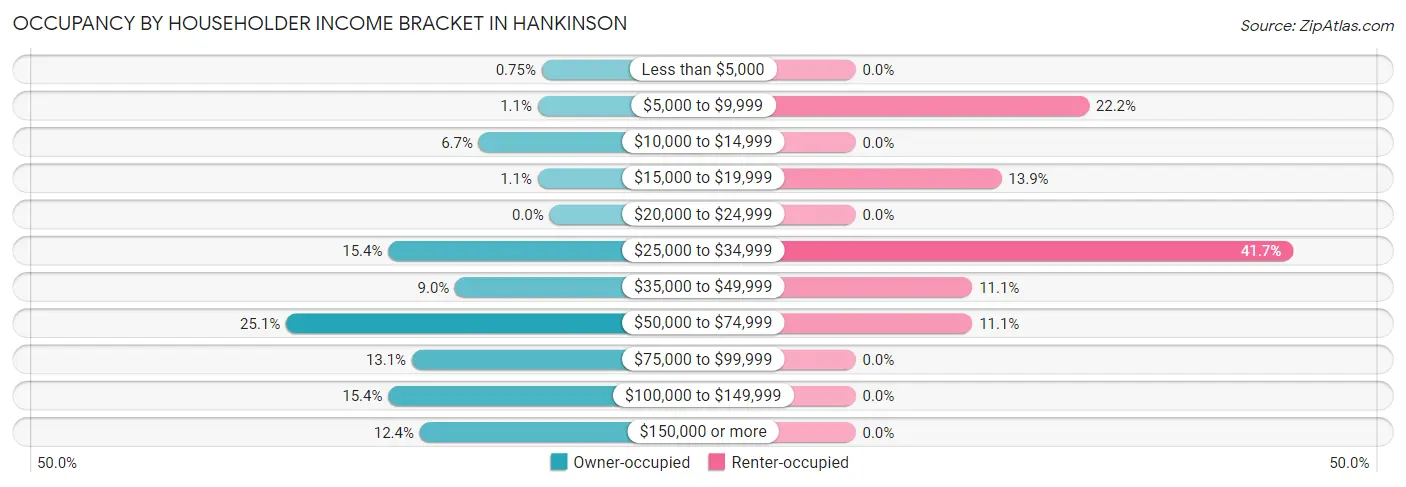
| Income Bracket | Owner-occupied | Renter-occupied |
| Less than $5,000 | 2 (0.7%) | 0 (0.0%) |
| $5,000 to $9,999 | 3 (1.1%) | 8 (22.2%) |
| $10,000 to $14,999 | 18 (6.7%) | 0 (0.0%) |
| $15,000 to $19,999 | 3 (1.1%) | 5 (13.9%) |
| $20,000 to $24,999 | 0 (0.0%) | 0 (0.0%) |
| $25,000 to $34,999 | 41 (15.4%) | 15 (41.7%) |
| $35,000 to $49,999 | 24 (9.0%) | 4 (11.1%) |
| $50,000 to $74,999 | 67 (25.1%) | 4 (11.1%) |
| $75,000 to $99,999 | 35 (13.1%) | 0 (0.0%) |
| $100,000 to $149,999 | 41 (15.4%) | 0 (0.0%) |
| $150,000 or more | 33 (12.4%) | 0 (0.0%) |
| Total | 267 (100.0%) | 36 (100.0%) |
Monthly Housing Cost Tiers in Hankinson
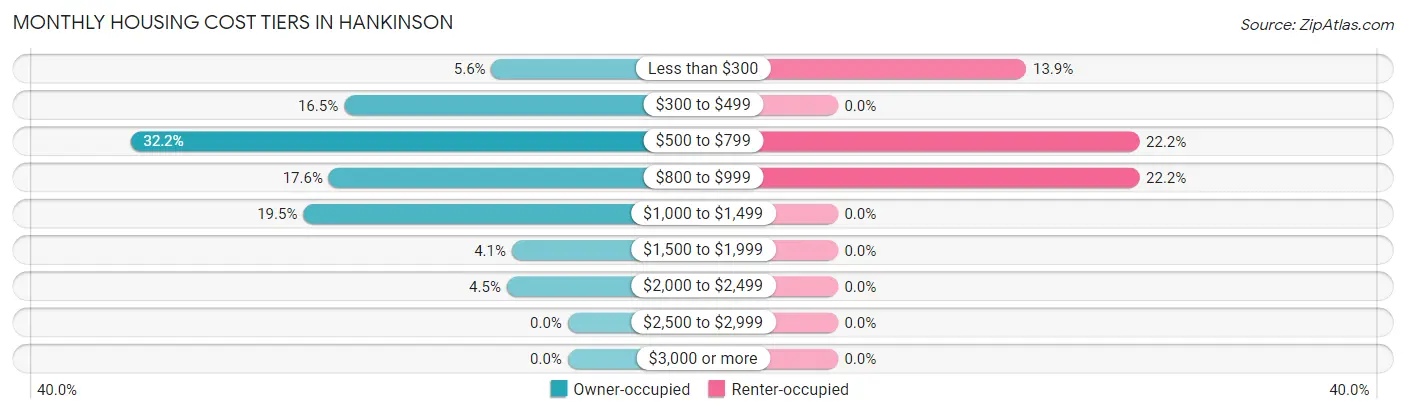
| Monthly Cost | Owner-occupied | Renter-occupied |
| Less than $300 | 15 (5.6%) | 5 (13.9%) |
| $300 to $499 | 44 (16.5%) | 0 (0.0%) |
| $500 to $799 | 86 (32.2%) | 8 (22.2%) |
| $800 to $999 | 47 (17.6%) | 8 (22.2%) |
| $1,000 to $1,499 | 52 (19.5%) | 0 (0.0%) |
| $1,500 to $1,999 | 11 (4.1%) | 0 (0.0%) |
| $2,000 to $2,499 | 12 (4.5%) | 0 (0.0%) |
| $2,500 to $2,999 | 0 (0.0%) | 0 (0.0%) |
| $3,000 or more | 0 (0.0%) | 0 (0.0%) |
| Total | 267 (100.0%) | 36 (100.0%) |
Physical Housing Characteristics in Hankinson
Housing Structures in Hankinson
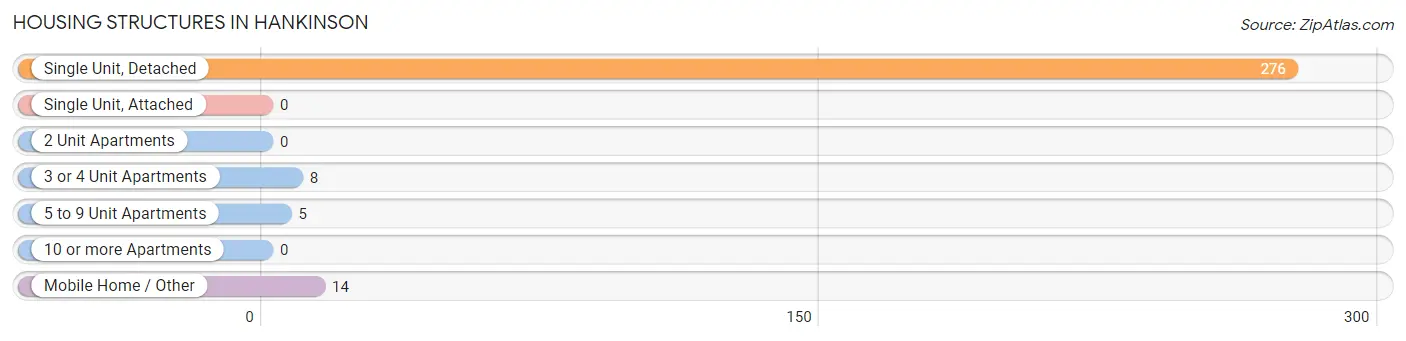
| Structure Type | # Housing Units | % Housing Units |
| Single Unit, Detached | 276 | 91.1% |
| Single Unit, Attached | 0 | 0.0% |
| 2 Unit Apartments | 0 | 0.0% |
| 3 or 4 Unit Apartments | 8 | 2.6% |
| 5 to 9 Unit Apartments | 5 | 1.7% |
| 10 or more Apartments | 0 | 0.0% |
| Mobile Home / Other | 14 | 4.6% |
| Total | 303 | 100.0% |
Housing Structures by Occupancy in Hankinson
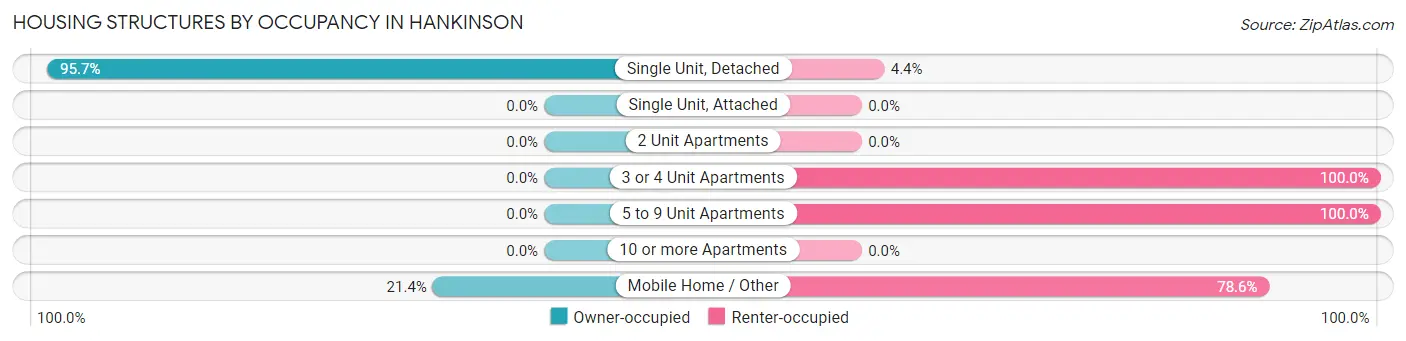
| Structure Type | Owner-occupied | Renter-occupied |
| Single Unit, Detached | 264 (95.7%) | 12 (4.3%) |
| Single Unit, Attached | 0 (0.0%) | 0 (0.0%) |
| 2 Unit Apartments | 0 (0.0%) | 0 (0.0%) |
| 3 or 4 Unit Apartments | 0 (0.0%) | 8 (100.0%) |
| 5 to 9 Unit Apartments | 0 (0.0%) | 5 (100.0%) |
| 10 or more Apartments | 0 (0.0%) | 0 (0.0%) |
| Mobile Home / Other | 3 (21.4%) | 11 (78.6%) |
| Total | 267 (88.1%) | 36 (11.9%) |
Housing Structures by Number of Rooms in Hankinson
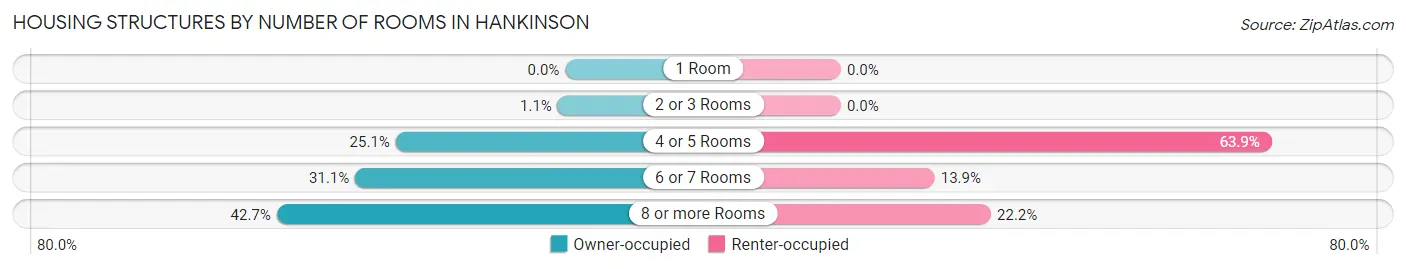
| Number of Rooms | Owner-occupied | Renter-occupied |
| 1 Room | 0 (0.0%) | 0 (0.0%) |
| 2 or 3 Rooms | 3 (1.1%) | 0 (0.0%) |
| 4 or 5 Rooms | 67 (25.1%) | 23 (63.9%) |
| 6 or 7 Rooms | 83 (31.1%) | 5 (13.9%) |
| 8 or more Rooms | 114 (42.7%) | 8 (22.2%) |
| Total | 267 (100.0%) | 36 (100.0%) |
Housing Structure by Heating Type in Hankinson
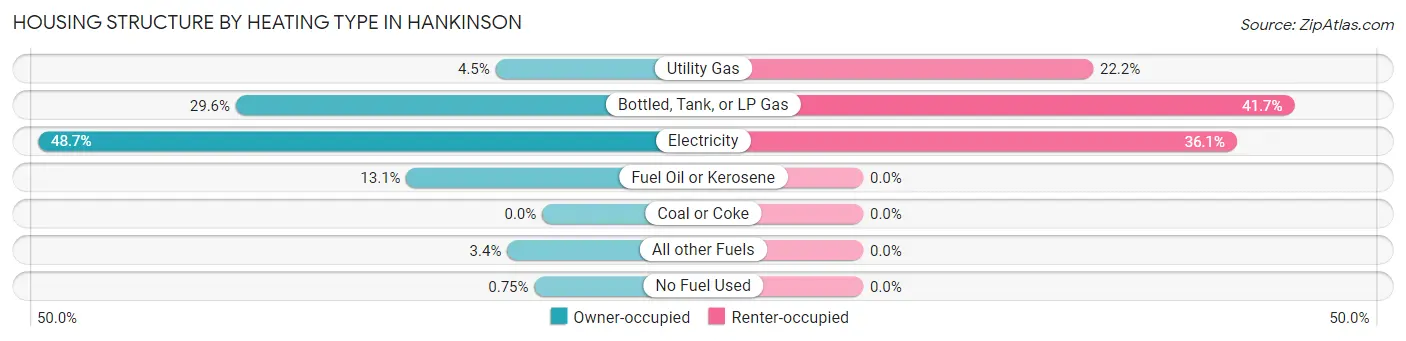
| Heating Type | Owner-occupied | Renter-occupied |
| Utility Gas | 12 (4.5%) | 8 (22.2%) |
| Bottled, Tank, or LP Gas | 79 (29.6%) | 15 (41.7%) |
| Electricity | 130 (48.7%) | 13 (36.1%) |
| Fuel Oil or Kerosene | 35 (13.1%) | 0 (0.0%) |
| Coal or Coke | 0 (0.0%) | 0 (0.0%) |
| All other Fuels | 9 (3.4%) | 0 (0.0%) |
| No Fuel Used | 2 (0.7%) | 0 (0.0%) |
| Total | 267 (100.0%) | 36 (100.0%) |
Household Vehicle Usage in Hankinson
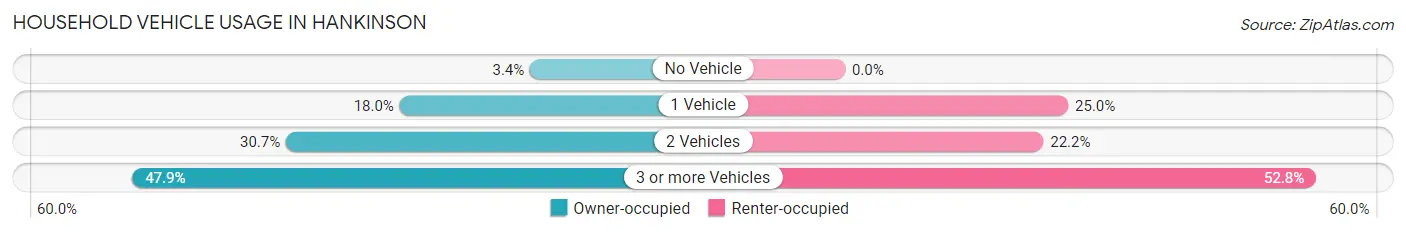
| Vehicles per Household | Owner-occupied | Renter-occupied |
| No Vehicle | 9 (3.4%) | 0 (0.0%) |
| 1 Vehicle | 48 (18.0%) | 9 (25.0%) |
| 2 Vehicles | 82 (30.7%) | 8 (22.2%) |
| 3 or more Vehicles | 128 (47.9%) | 19 (52.8%) |
| Total | 267 (100.0%) | 36 (100.0%) |
Real Estate & Mortgages in Hankinson
Real Estate and Mortgage Overview in Hankinson
| Characteristic | Without Mortgage | With Mortgage |
| Housing Units | 155 | 112 |
| Median Property Value | $99,200 | $115,600 |
| Median Household Income | $55,938 | $26 |
| Monthly Housing Costs | $558 | $0 |
| Real Estate Taxes | $1,342 | $0 |
Property Value by Mortgage Status in Hankinson
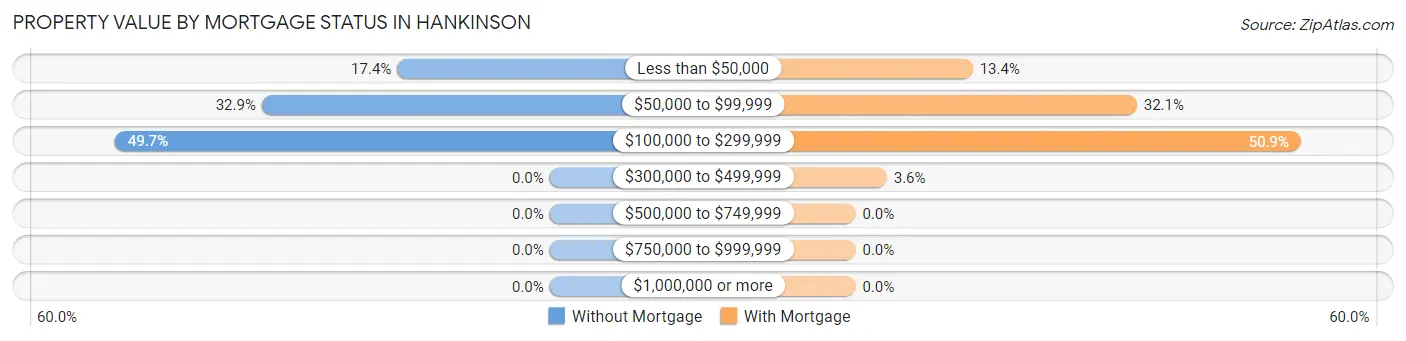
| Property Value | Without Mortgage | With Mortgage |
| Less than $50,000 | 27 (17.4%) | 15 (13.4%) |
| $50,000 to $99,999 | 51 (32.9%) | 36 (32.1%) |
| $100,000 to $299,999 | 77 (49.7%) | 57 (50.9%) |
| $300,000 to $499,999 | 0 (0.0%) | 4 (3.6%) |
| $500,000 to $749,999 | 0 (0.0%) | 0 (0.0%) |
| $750,000 to $999,999 | 0 (0.0%) | 0 (0.0%) |
| $1,000,000 or more | 0 (0.0%) | 0 (0.0%) |
| Total | 155 (100.0%) | 112 (100.0%) |
Household Income by Mortgage Status in Hankinson
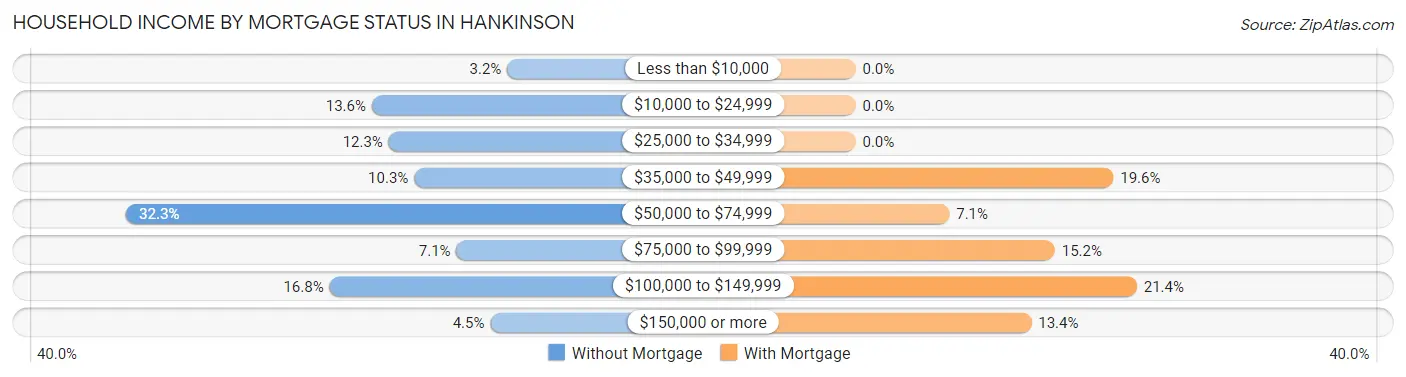
| Household Income | Without Mortgage | With Mortgage |
| Less than $10,000 | 5 (3.2%) | 0 (0.0%) |
| $10,000 to $24,999 | 21 (13.6%) | 0 (0.0%) |
| $25,000 to $34,999 | 19 (12.3%) | 0 (0.0%) |
| $35,000 to $49,999 | 16 (10.3%) | 22 (19.6%) |
| $50,000 to $74,999 | 50 (32.3%) | 8 (7.1%) |
| $75,000 to $99,999 | 11 (7.1%) | 17 (15.2%) |
| $100,000 to $149,999 | 26 (16.8%) | 24 (21.4%) |
| $150,000 or more | 7 (4.5%) | 15 (13.4%) |
| Total | 155 (100.0%) | 112 (100.0%) |
Property Value to Household Income Ratio in Hankinson
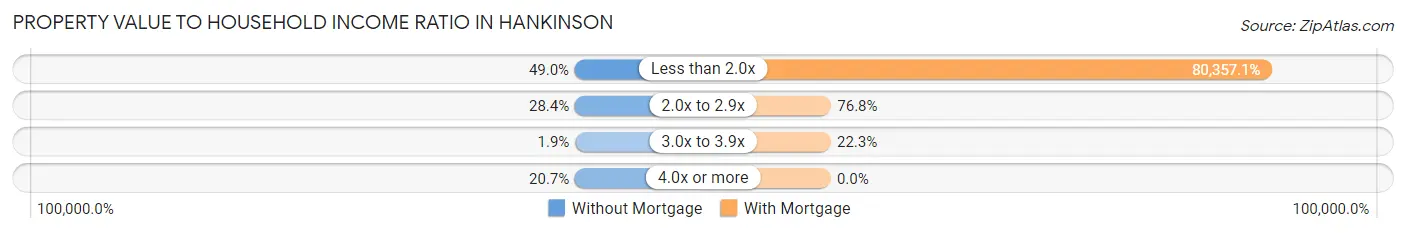
| Value-to-Income Ratio | Without Mortgage | With Mortgage |
| Less than 2.0x | 76 (49.0%) | 90,000 (80,357.1%) |
| 2.0x to 2.9x | 44 (28.4%) | 86 (76.8%) |
| 3.0x to 3.9x | 3 (1.9%) | 25 (22.3%) |
| 4.0x or more | 32 (20.6%) | 0 (0.0%) |
| Total | 155 (100.0%) | 112 (100.0%) |
Real Estate Taxes by Mortgage Status in Hankinson
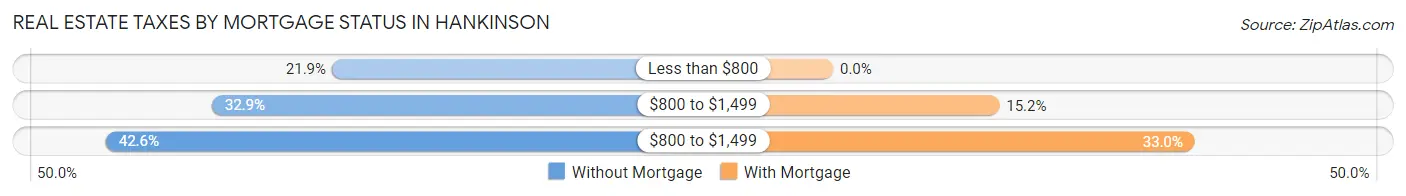
| Property Taxes | Without Mortgage | With Mortgage |
| Less than $800 | 34 (21.9%) | 0 (0.0%) |
| $800 to $1,499 | 51 (32.9%) | 17 (15.2%) |
| $800 to $1,499 | 66 (42.6%) | 37 (33.0%) |
| Total | 155 (100.0%) | 112 (100.0%) |
Health & Disability in Hankinson
Health Insurance Coverage by Age in Hankinson
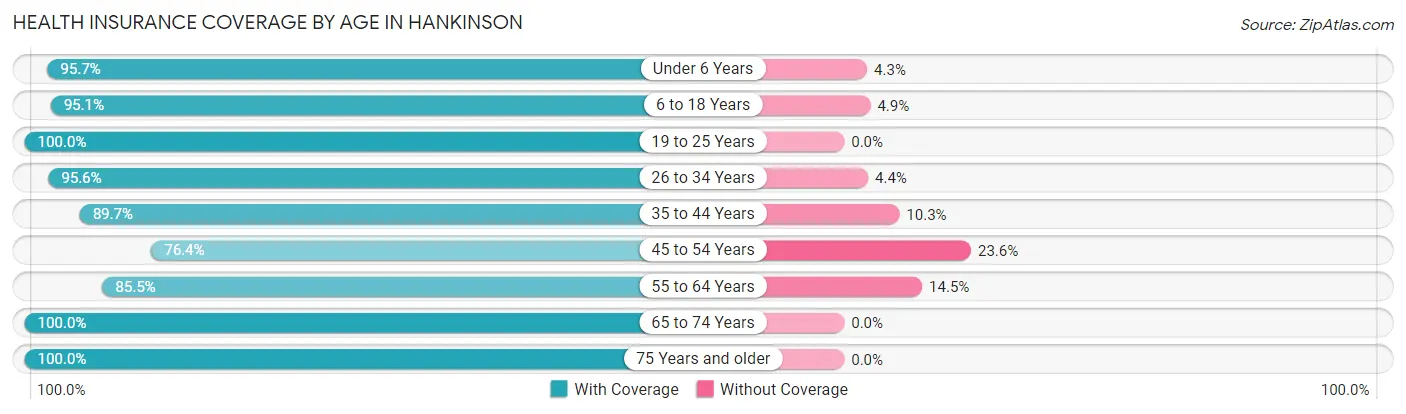
| Age Bracket | With Coverage | Without Coverage |
| Under 6 Years | 90 (95.7%) | 4 (4.3%) |
| 6 to 18 Years | 117 (95.1%) | 6 (4.9%) |
| 19 to 25 Years | 33 (100.0%) | 0 (0.0%) |
| 26 to 34 Years | 86 (95.6%) | 4 (4.4%) |
| 35 to 44 Years | 96 (89.7%) | 11 (10.3%) |
| 45 to 54 Years | 42 (76.4%) | 13 (23.6%) |
| 55 to 64 Years | 53 (85.5%) | 9 (14.5%) |
| 65 to 74 Years | 90 (100.0%) | 0 (0.0%) |
| 75 Years and older | 90 (100.0%) | 0 (0.0%) |
| Total | 697 (93.7%) | 47 (6.3%) |
Health Insurance Coverage by Citizenship Status in Hankinson
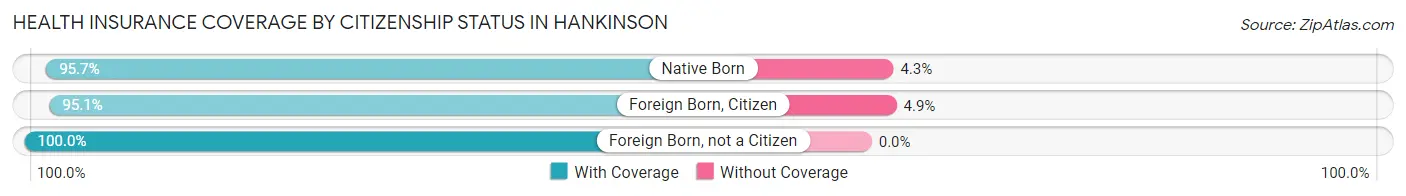
| Citizenship Status | With Coverage | Without Coverage |
| Native Born | 90 (95.7%) | 4 (4.3%) |
| Foreign Born, Citizen | 117 (95.1%) | 6 (4.9%) |
| Foreign Born, not a Citizen | 33 (100.0%) | 0 (0.0%) |
Health Insurance Coverage by Household Income in Hankinson
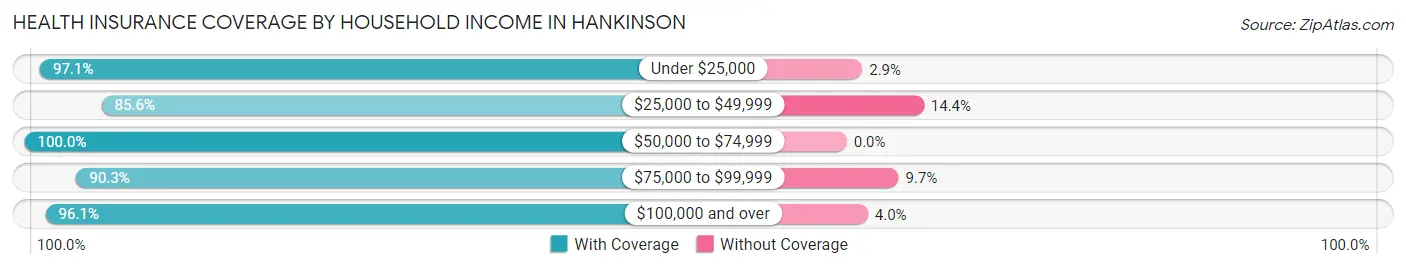
| Household Income | With Coverage | Without Coverage |
| Under $25,000 | 67 (97.1%) | 2 (2.9%) |
| $25,000 to $49,999 | 154 (85.6%) | 26 (14.4%) |
| $50,000 to $74,999 | 145 (100.0%) | 0 (0.0%) |
| $75,000 to $99,999 | 93 (90.3%) | 10 (9.7%) |
| $100,000 and over | 219 (96.1%) | 9 (4.0%) |
Public vs Private Health Insurance Coverage by Age in Hankinson

| Age Bracket | Public Insurance | Private Insurance |
| Under 6 | 18 (19.2%) | 90 (95.7%) |
| 6 to 18 Years | 43 (35.0%) | 97 (78.9%) |
| 19 to 25 Years | 1 (3.0%) | 32 (97.0%) |
| 25 to 34 Years | 21 (23.3%) | 67 (74.4%) |
| 35 to 44 Years | 13 (12.1%) | 88 (82.2%) |
| 45 to 54 Years | 1 (1.8%) | 41 (74.6%) |
| 55 to 64 Years | 10 (16.1%) | 43 (69.4%) |
| 65 to 74 Years | 90 (100.0%) | 48 (53.3%) |
| 75 Years and over | 90 (100.0%) | 50 (55.6%) |
| Total | 287 (38.6%) | 556 (74.7%) |
Disability Status by Sex by Age in Hankinson
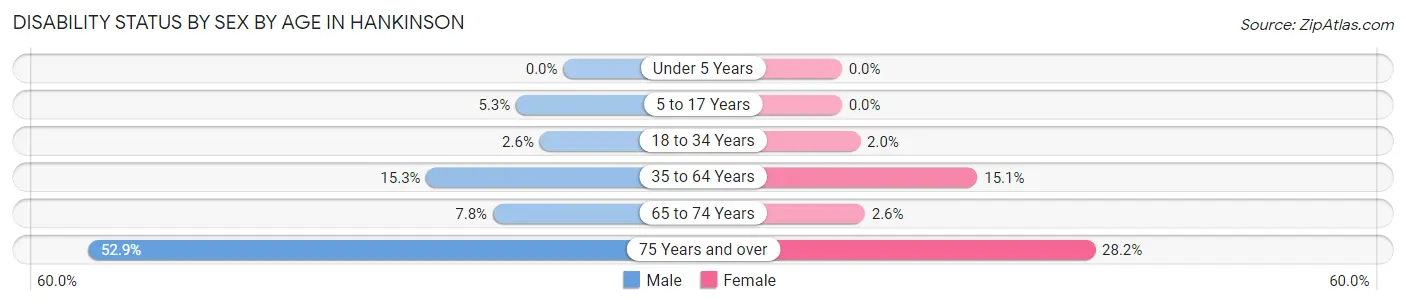
| Age Bracket | Male | Female |
| Under 5 Years | 0 (0.0%) | 0 (0.0%) |
| 5 to 17 Years | 3 (5.3%) | 0 (0.0%) |
| 18 to 34 Years | 2 (2.6%) | 1 (2.0%) |
| 35 to 64 Years | 18 (15.2%) | 16 (15.1%) |
| 65 to 74 Years | 4 (7.8%) | 1 (2.6%) |
| 75 Years and over | 27 (52.9%) | 11 (28.2%) |
Disability Class by Sex by Age in Hankinson
Disability Class: Hearing Difficulty
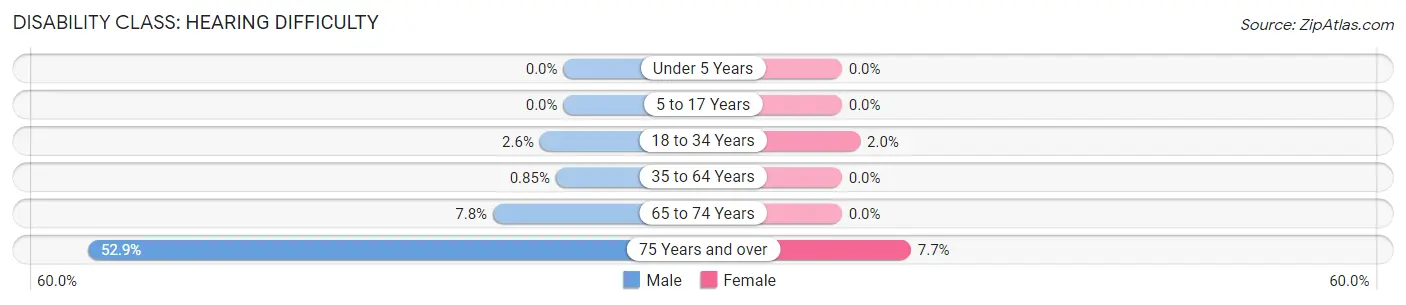
| Age Bracket | Male | Female |
| Under 5 Years | 0 (0.0%) | 0 (0.0%) |
| 5 to 17 Years | 0 (0.0%) | 0 (0.0%) |
| 18 to 34 Years | 2 (2.6%) | 1 (2.0%) |
| 35 to 64 Years | 1 (0.9%) | 0 (0.0%) |
| 65 to 74 Years | 4 (7.8%) | 0 (0.0%) |
| 75 Years and over | 27 (52.9%) | 3 (7.7%) |
Disability Class: Vision Difficulty
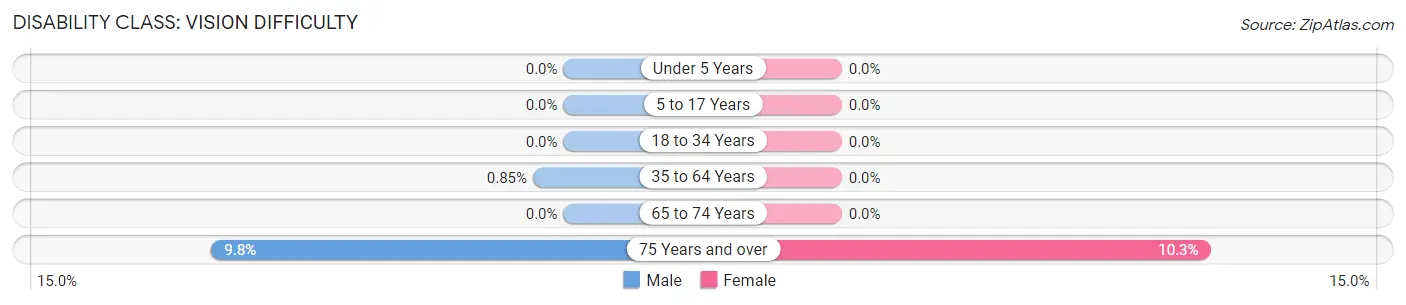
| Age Bracket | Male | Female |
| Under 5 Years | 0 (0.0%) | 0 (0.0%) |
| 5 to 17 Years | 0 (0.0%) | 0 (0.0%) |
| 18 to 34 Years | 0 (0.0%) | 0 (0.0%) |
| 35 to 64 Years | 1 (0.9%) | 0 (0.0%) |
| 65 to 74 Years | 0 (0.0%) | 0 (0.0%) |
| 75 Years and over | 5 (9.8%) | 4 (10.3%) |
Disability Class: Cognitive Difficulty
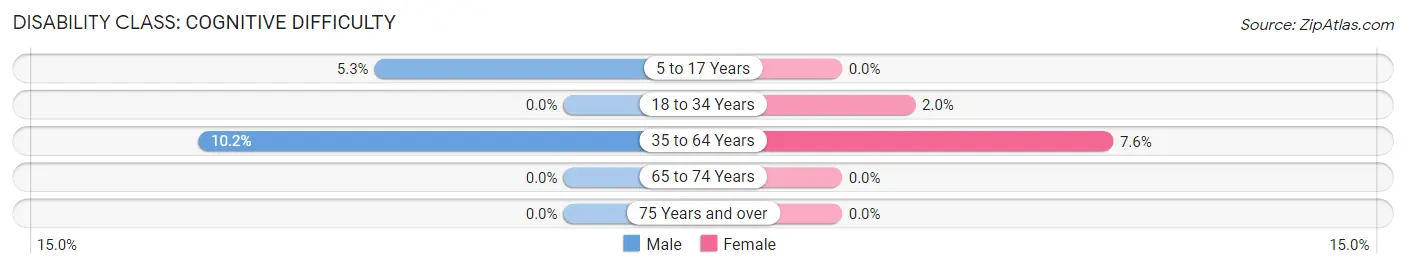
| Age Bracket | Male | Female |
| 5 to 17 Years | 3 (5.3%) | 0 (0.0%) |
| 18 to 34 Years | 0 (0.0%) | 1 (2.0%) |
| 35 to 64 Years | 12 (10.2%) | 8 (7.5%) |
| 65 to 74 Years | 0 (0.0%) | 0 (0.0%) |
| 75 Years and over | 0 (0.0%) | 0 (0.0%) |
Disability Class: Ambulatory Difficulty
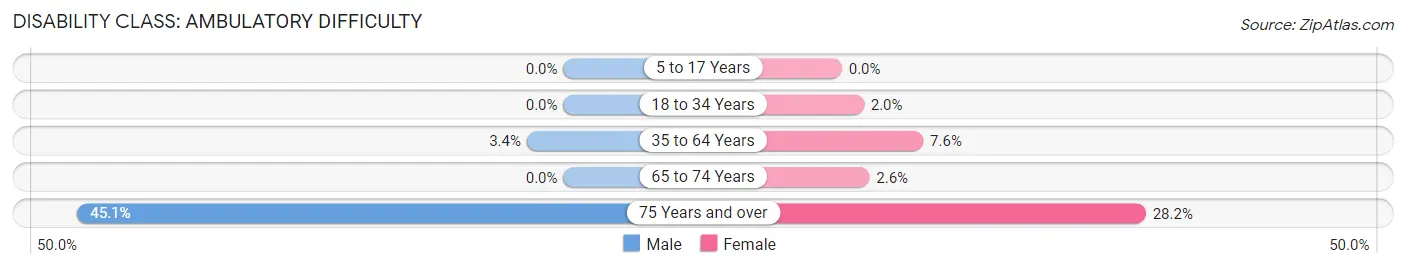
| Age Bracket | Male | Female |
| 5 to 17 Years | 0 (0.0%) | 0 (0.0%) |
| 18 to 34 Years | 0 (0.0%) | 1 (2.0%) |
| 35 to 64 Years | 4 (3.4%) | 8 (7.5%) |
| 65 to 74 Years | 0 (0.0%) | 1 (2.6%) |
| 75 Years and over | 23 (45.1%) | 11 (28.2%) |
Disability Class: Self-Care Difficulty
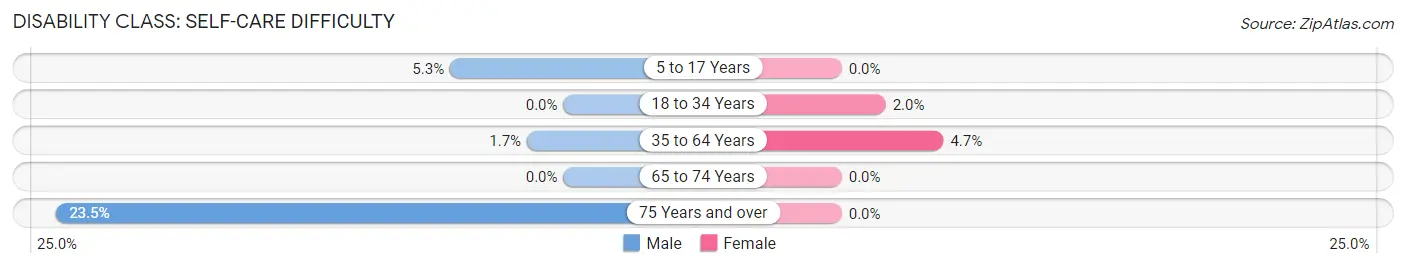
| Age Bracket | Male | Female |
| 5 to 17 Years | 3 (5.3%) | 0 (0.0%) |
| 18 to 34 Years | 0 (0.0%) | 1 (2.0%) |
| 35 to 64 Years | 2 (1.7%) | 5 (4.7%) |
| 65 to 74 Years | 0 (0.0%) | 0 (0.0%) |
| 75 Years and over | 12 (23.5%) | 0 (0.0%) |
Technology Access in Hankinson
Computing Device Access in Hankinson
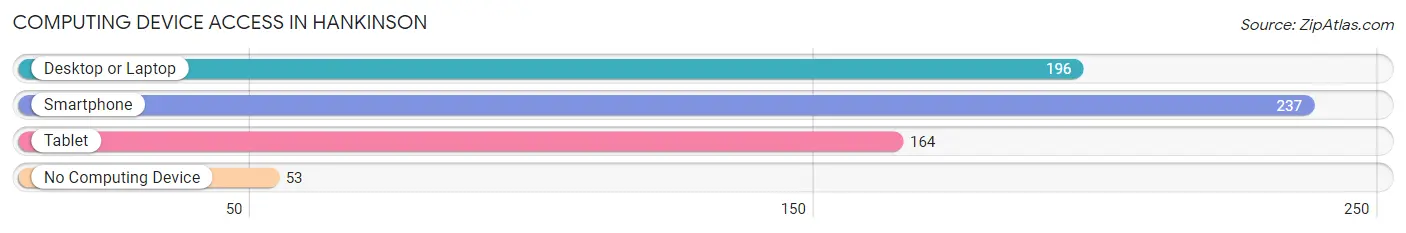
| Device Type | # Households | % Households |
| Desktop or Laptop | 196 | 64.7% |
| Smartphone | 237 | 78.2% |
| Tablet | 164 | 54.1% |
| No Computing Device | 53 | 17.5% |
| Total | 303 | 100.0% |
Internet Access in Hankinson
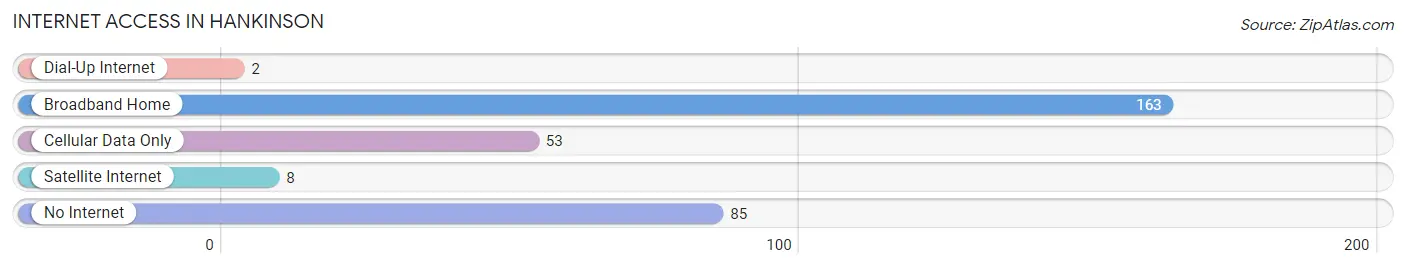
| Internet Type | # Households | % Households |
| Dial-Up Internet | 2 | 0.7% |
| Broadband Home | 163 | 53.8% |
| Cellular Data Only | 53 | 17.5% |
| Satellite Internet | 8 | 2.6% |
| No Internet | 85 | 28.1% |
| Total | 303 | 100.0% |
Hankinson Summary
Hankinson is a small city located in Richland County, North Dakota. It is situated on the banks of the Wild Rice River, approximately 30 miles south of Fargo. The city has a population of 1,541 as of the 2010 census, making it the smallest city in the state.
Hankinson was founded in 1882 by a group of settlers from Wisconsin. The city was named after the first postmaster, John Hankinson. The city was incorporated in 1887 and has since grown to become a thriving community.
Geography
Hankinson is located in the Red River Valley, a flat, fertile region of the Great Plains. The city is situated on the banks of the Wild Rice River, which flows through the city and is a major source of water for the area. The city is surrounded by agricultural land, with corn, soybeans, and wheat being the main crops.
The climate in Hankinson is continental, with cold winters and hot summers. The average annual temperature is 45°F (7°C). The average annual precipitation is 22 inches (56 cm).
Economy
Hankinson’s economy is largely based on agriculture. The city is home to several grain elevators, which store and process grain for local farmers. The city also has a number of small businesses, including a grocery store, a hardware store, and a few restaurants.
The city is also home to a number of manufacturing companies, including a plastics factory and a metal fabrication plant. The city is also home to a number of service-based businesses, such as auto repair shops and a medical clinic.
Demographics
As of the 2010 census, the population of Hankinson was 1,541. The racial makeup of the city was 97.3% White, 0.7% African American, 0.3% Native American, 0.2% Asian, 0.1% Pacific Islander, and 1.4% from other races. The median household income was $41,944, and the median family income was $50,944.
The city is served by the Richland County School District, which includes two elementary schools, one middle school, and one high school. The city also has a public library and a number of churches.
Hankinson is a small city with a rich history and a vibrant economy. The city is home to a diverse population and is a great place to live and work. With its close proximity to Fargo, it is a great place to raise a family and enjoy the rural lifestyle.
Common Questions
What is the Total Population of Hankinson?
Total Population of Hankinson is 790.
What is the Total Male Population of Hankinson?
Total Male Population of Hankinson is 411.
What is the Total Female Population of Hankinson?
Total Female Population of Hankinson is 379.
What is the Ratio of Males per 100 Females in Hankinson?
There are 108.44 Males per 100 Females in Hankinson.
What is the Ratio of Females per 100 Males in Hankinson?
There are 92.21 Females per 100 Males in Hankinson.
What is the Median Population Age in Hankinson?
Median Population Age in Hankinson is 39.7 Years.
What is the Average Family Size in Hankinson
Average Family Size in Hankinson is 3.0 People.
What is the Average Household Size in Hankinson
Average Household Size in Hankinson is 2.4 People.
What is Per Capita Income in Hankinson?
Per Capita income in Hankinson is $28,406.
What is the Median Family Income in Hankinson?
Median Family Income in Hankinson is $73,594.
What is the Median Household income in Hankinson?
Median Household Income in Hankinson is $57,031.
What is Income or Wage Gap in Hankinson?
Income or Wage Gap in Hankinson is 4.5%.
Women in Hankinson earn 95.5 cents for every dollar earned by a man.
What is Inequality or Gini Index in Hankinson?
Inequality or Gini Index in Hankinson is 0.39.
How Large is the Labor Force in Hankinson?
There are 302 People in the Labor Forcein in Hankinson.
What is the Percentage of People in the Labor Force in Hankinson?
51.4% of People are in the Labor Force in Hankinson.
What is the Unemployment Rate in Hankinson?
Unemployment Rate in Hankinson is 3.6%.