Merriam Woods, MO
Merriam Woods Map
Merriam Woods Overview
2,153
TOTAL POPULATION
1,123
MALE POPULATION
1,030
FEMALE POPULATION
109.03
MALES / 100 FEMALES
91.72
FEMALES / 100 MALES
35.3
MEDIAN AGE
4.0
AVG FAMILY SIZE
3.4
AVG HOUSEHOLD SIZE
$19,878
PER CAPITA INCOME
$50,250
AVG FAMILY INCOME
$48,750
AVG HOUSEHOLD INCOME
32.0%
WAGE / INCOME GAP [ % ]
68.0¢/ $1
WAGE / INCOME GAP [ $ ]
0.40
INEQUALITY / GINI INDEX
1,089
LABOR FORCE [ PEOPLE ]
67.2%
PERCENT IN LABOR FORCE
12.5%
UNEMPLOYMENT RATE
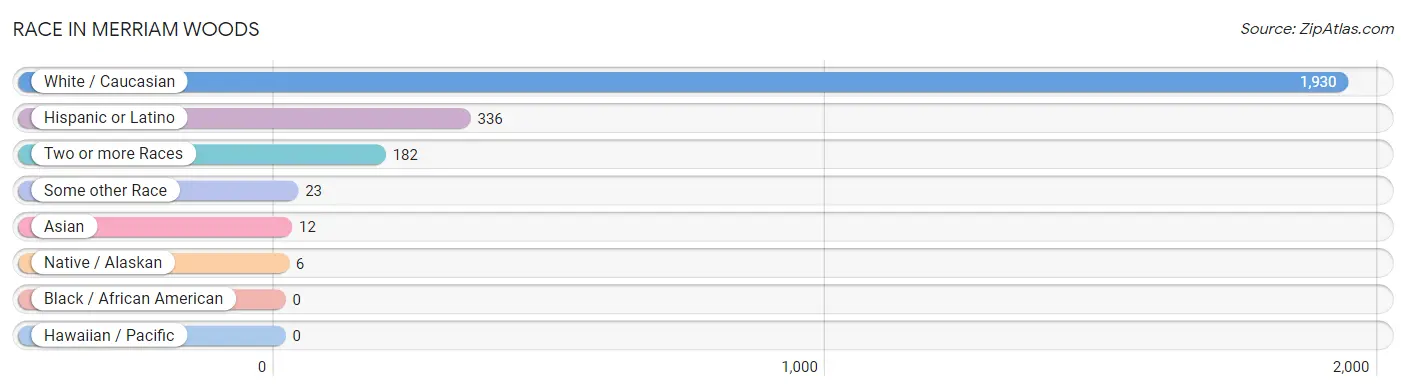
Race in Merriam Woods
The most populous races in Merriam Woods are White / Caucasian (1,930 | 89.6%), Hispanic or Latino (336 | 15.6%), and Two or more Races (182 | 8.5%).
| Race | # Population | % Population |
| Asian | 12 | 0.6% |
| Black / African American | 0 | 0.0% |
| Hawaiian / Pacific | 0 | 0.0% |
| Hispanic or Latino | 336 | 15.6% |
| Native / Alaskan | 6 | 0.3% |
| White / Caucasian | 1,930 | 89.6% |
| Two or more Races | 182 | 8.5% |
| Some other Race | 23 | 1.1% |
| Total | 2,153 | 100.0% |
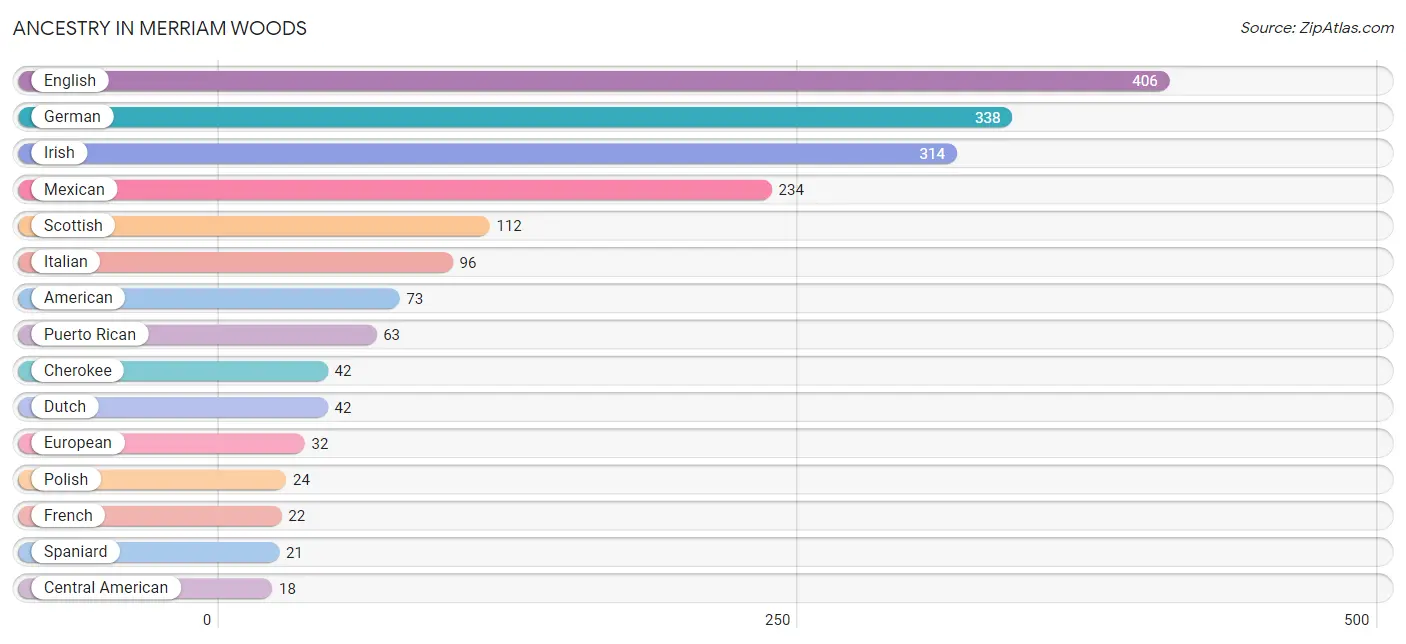
Ancestry in Merriam Woods
The most populous ancestries reported in Merriam Woods are English (406 | 18.9%), German (338 | 15.7%), Irish (314 | 14.6%), Mexican (234 | 10.9%), and Scottish (112 | 5.2%), together accounting for 65.2% of all Merriam Woods residents.
| Ancestry | # Population | % Population |
| African | 2 | 0.1% |
| American | 73 | 3.4% |
| Arab | 4 | 0.2% |
| British | 3 | 0.1% |
| Cajun | 5 | 0.2% |
| Central American | 18 | 0.8% |
| Cherokee | 42 | 1.9% |
| Chickasaw | 2 | 0.1% |
| Creek | 7 | 0.3% |
| Crow | 4 | 0.2% |
| Danish | 2 | 0.1% |
| Dutch | 42 | 1.9% |
| English | 406 | 18.9% |
| European | 32 | 1.5% |
| French | 22 | 1.0% |
| German | 338 | 15.7% |
| Greek | 17 | 0.8% |
| Guatemalan | 2 | 0.1% |
| Indian (Asian) | 9 | 0.4% |
| Irish | 314 | 14.6% |
| Italian | 96 | 4.5% |
| Jordanian | 4 | 0.2% |
| Korean | 3 | 0.1% |
| Mexican | 234 | 10.9% |
| Polish | 24 | 1.1% |
| Puerto Rican | 63 | 2.9% |
| Russian | 7 | 0.3% |
| Salvadoran | 16 | 0.7% |
| Scandinavian | 2 | 0.1% |
| Scotch-Irish | 7 | 0.3% |
| Scottish | 112 | 5.2% |
| Spaniard | 21 | 1.0% |
| Subsaharan African | 2 | 0.1% |
| Swedish | 17 | 0.8% |
| Welsh | 11 | 0.5% | View All 35 Rows |
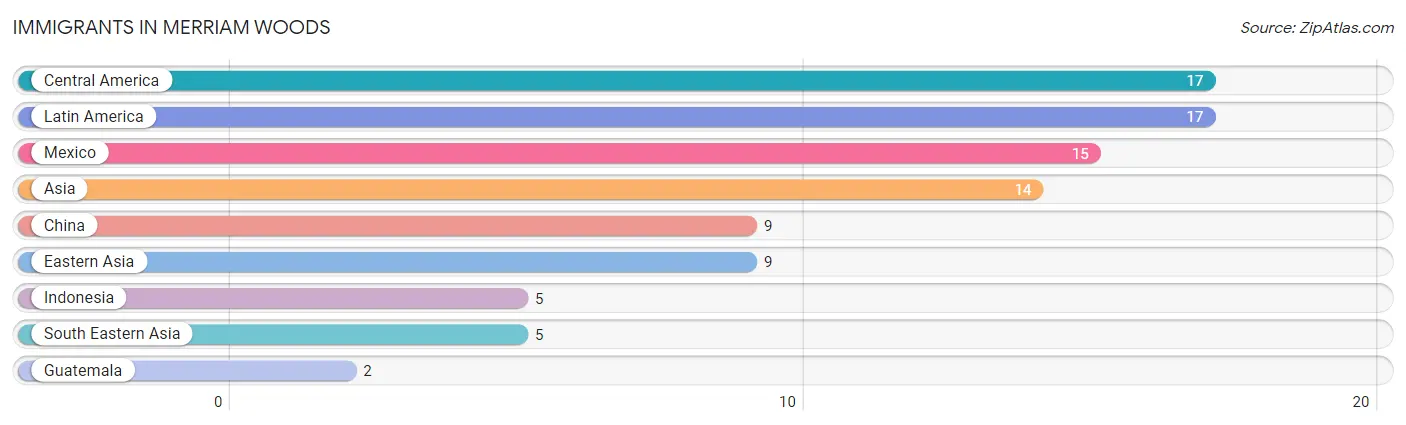
Immigrants in Merriam Woods
The most numerous immigrant groups reported in Merriam Woods came from Central America (17 | 0.8%), Latin America (17 | 0.8%), Mexico (15 | 0.7%), Asia (14 | 0.6%), and China (9 | 0.4%), together accounting for 3.4% of all Merriam Woods residents.
| Immigration Origin | # Population | % Population |
| Asia | 14 | 0.6% |
| Central America | 17 | 0.8% |
| China | 9 | 0.4% |
| Eastern Asia | 9 | 0.4% |
| Guatemala | 2 | 0.1% |
| Indonesia | 5 | 0.2% |
| Latin America | 17 | 0.8% |
| Mexico | 15 | 0.7% |
| South Eastern Asia | 5 | 0.2% | View All 9 Rows |
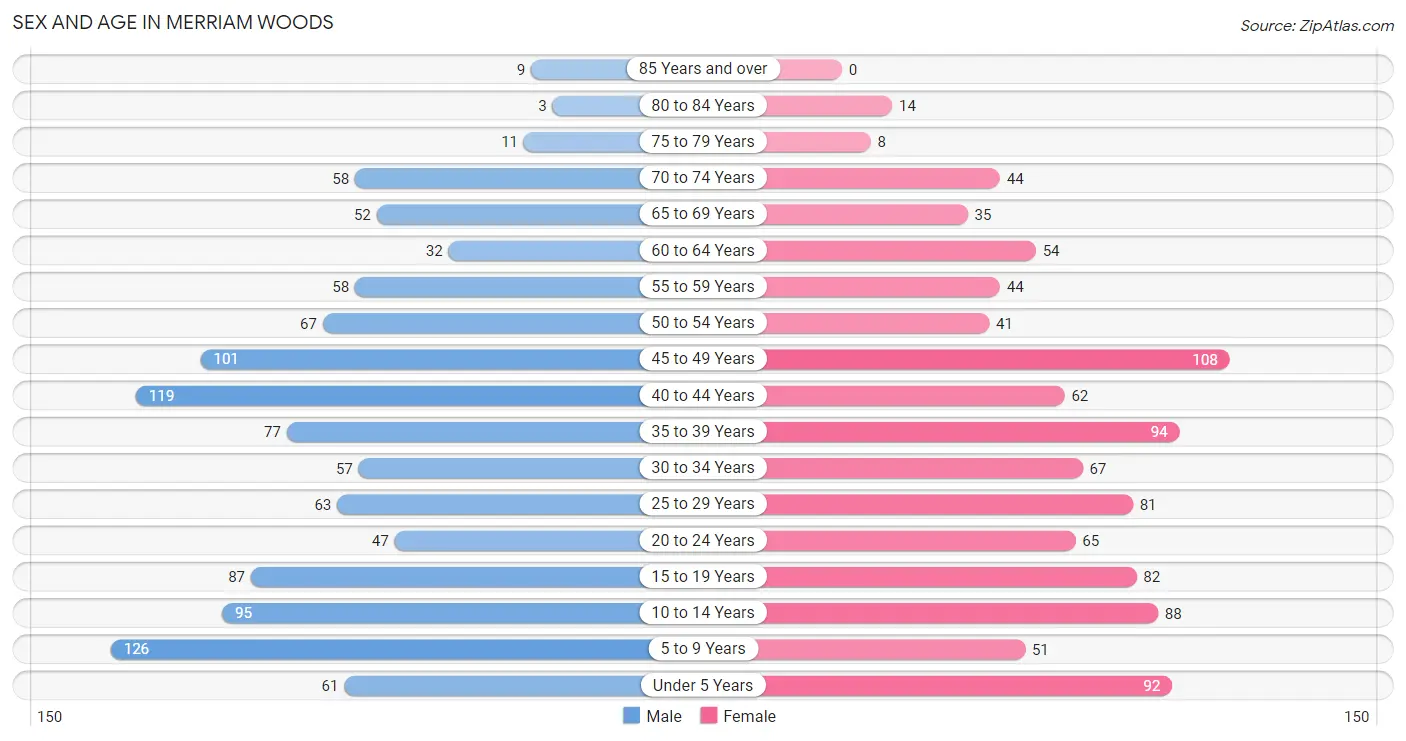
Sex and Age in Merriam Woods
Sex and Age in Merriam Woods
The most populous age groups in Merriam Woods are 5 to 9 Years (126 | 11.2%) for men and 45 to 49 Years (108 | 10.5%) for women.
| Age Bracket | Male | Female |
| Under 5 Years | 61 (5.4%) | 92 (8.9%) |
| 5 to 9 Years | 126 (11.2%) | 51 (5.0%) |
| 10 to 14 Years | 95 (8.5%) | 88 (8.5%) |
| 15 to 19 Years | 87 (7.7%) | 82 (8.0%) |
| 20 to 24 Years | 47 (4.2%) | 65 (6.3%) |
| 25 to 29 Years | 63 (5.6%) | 81 (7.9%) |
| 30 to 34 Years | 57 (5.1%) | 67 (6.5%) |
| 35 to 39 Years | 77 (6.9%) | 94 (9.1%) |
| 40 to 44 Years | 119 (10.6%) | 62 (6.0%) |
| 45 to 49 Years | 101 (9.0%) | 108 (10.5%) |
| 50 to 54 Years | 67 (6.0%) | 41 (4.0%) |
| 55 to 59 Years | 58 (5.2%) | 44 (4.3%) |
| 60 to 64 Years | 32 (2.9%) | 54 (5.2%) |
| 65 to 69 Years | 52 (4.6%) | 35 (3.4%) |
| 70 to 74 Years | 58 (5.2%) | 44 (4.3%) |
| 75 to 79 Years | 11 (1.0%) | 8 (0.8%) |
| 80 to 84 Years | 3 (0.3%) | 14 (1.4%) |
| 85 Years and over | 9 (0.8%) | 0 (0.0%) |
| Total | 1,123 (100.0%) | 1,030 (100.0%) |
Families and Households in Merriam Woods
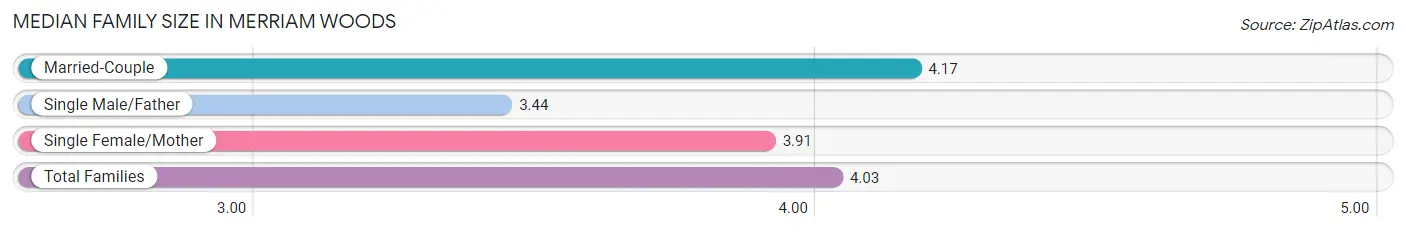
Median Family Size in Merriam Woods
The median family size in Merriam Woods is 4.03 persons per family, with married-couple families (319 | 68.9%) accounting for the largest median family size of 4.17 persons per family. On the other hand, single male/father families (62 | 13.4%) represent the smallest median family size with 3.44 persons per family.
| Family Type | # Families | Family Size |
| Married-Couple | 319 (68.9%) | 4.17 |
| Single Male/Father | 62 (13.4%) | 3.44 |
| Single Female/Mother | 82 (17.7%) | 3.91 |
| Total Families | 463 (100.0%) | 4.03 |
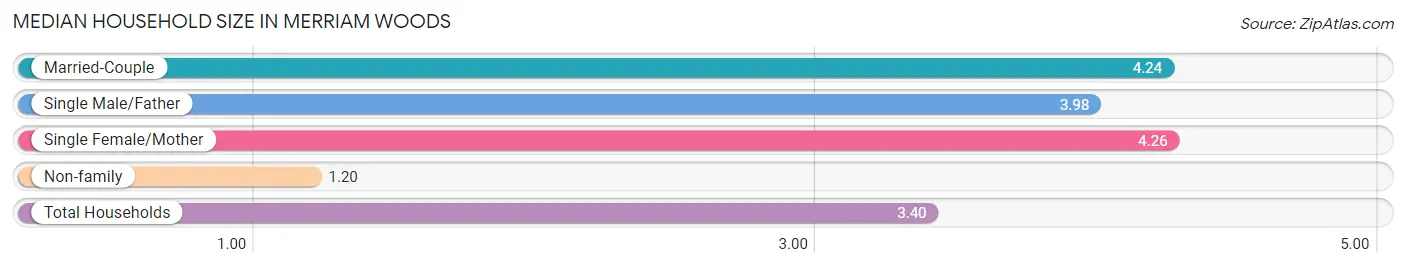
Median Household Size in Merriam Woods
The median household size in Merriam Woods is 3.40 persons per household, with single female/mother households (82 | 12.9%) accounting for the largest median household size of 4.26 persons per household. non-family households (171 | 27.0%) represent the smallest median household size with 1.20 persons per household.
| Household Type | # Households | Household Size |
| Married-Couple | 319 (50.3%) | 4.24 |
| Single Male/Father | 62 (9.8%) | 3.98 |
| Single Female/Mother | 82 (12.9%) | 4.26 |
| Non-family | 171 (27.0%) | 1.20 |
| Total Households | 634 (100.0%) | 3.40 |
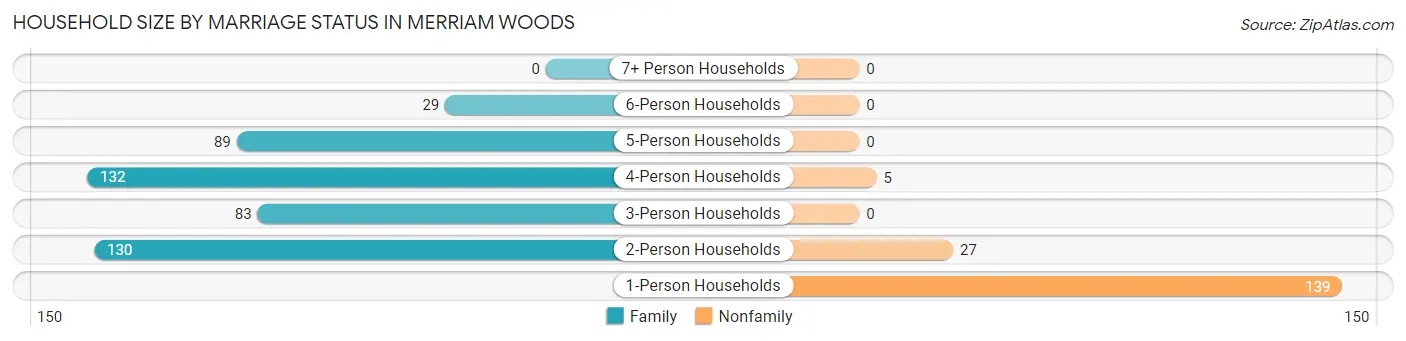
Household Size by Marriage Status in Merriam Woods
Out of a total of 634 households in Merriam Woods, 463 (73.0%) are family households, while 171 (27.0%) are nonfamily households. The most numerous type of family households are 4-person households, comprising 132, and the most common type of nonfamily households are 1-person households, comprising 139.
| Household Size | Family Households | Nonfamily Households |
| 1-Person Households | - | 139 (21.9%) |
| 2-Person Households | 130 (20.5%) | 27 (4.3%) |
| 3-Person Households | 83 (13.1%) | 0 (0.0%) |
| 4-Person Households | 132 (20.8%) | 5 (0.8%) |
| 5-Person Households | 89 (14.0%) | 0 (0.0%) |
| 6-Person Households | 29 (4.6%) | 0 (0.0%) |
| 7+ Person Households | 0 (0.0%) | 0 (0.0%) |
| Total | 463 (73.0%) | 171 (27.0%) |
Female Fertility in Merriam Woods
Fertility by Age in Merriam Woods
Average fertility rate in Merriam Woods is 63.0 births per 1,000 women. Women in the age bracket of 20 to 34 years have the highest fertility rate with 169.0 births per 1,000 women. Women in the age bracket of 20 to 34 years acount for 100.0% of all women with births.
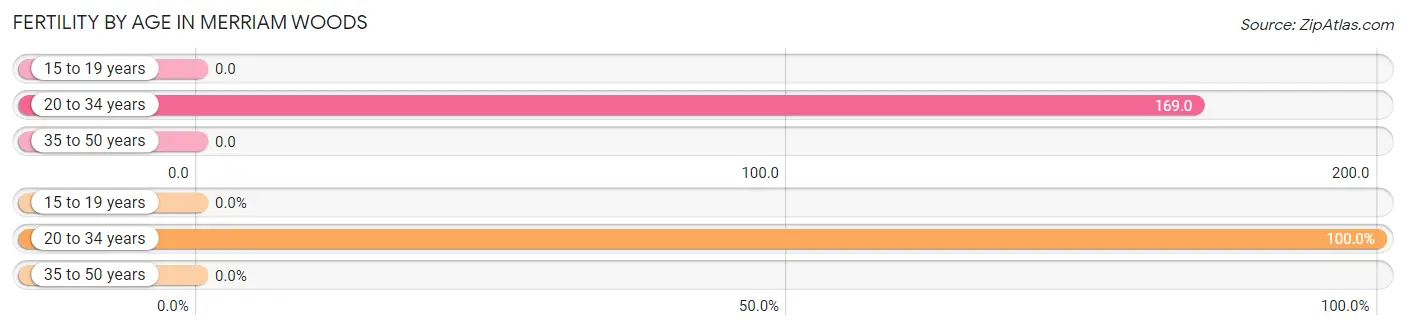
| Age Bracket | Women with Births | Births / 1,000 Women |
| 15 to 19 years | 0 (0.0%) | 0.0 |
| 20 to 34 years | 36 (100.0%) | 169.0 |
| 35 to 50 years | 0 (0.0%) | 0.0 |
| Total | 36 (100.0%) | 63.0 |
Fertility by Age by Marriage Status in Merriam Woods
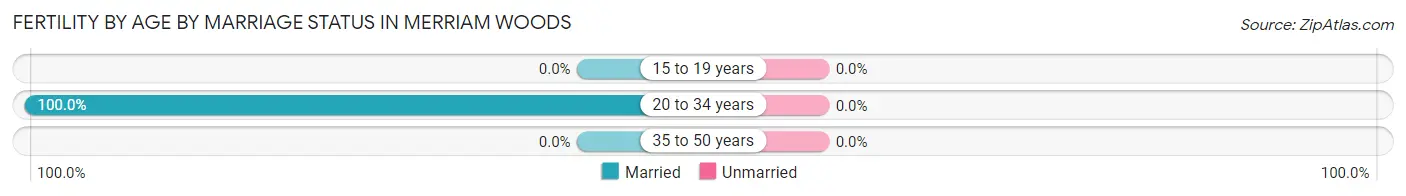
| Age Bracket | Married | Unmarried |
| 15 to 19 years | 0 (0.0%) | 0 (0.0%) |
| 20 to 34 years | 36 (100.0%) | 0 (0.0%) |
| 35 to 50 years | 0 (0.0%) | 0 (0.0%) |
| Total | 36 (100.0%) | 0 (0.0%) |
Fertility by Education in Merriam Woods
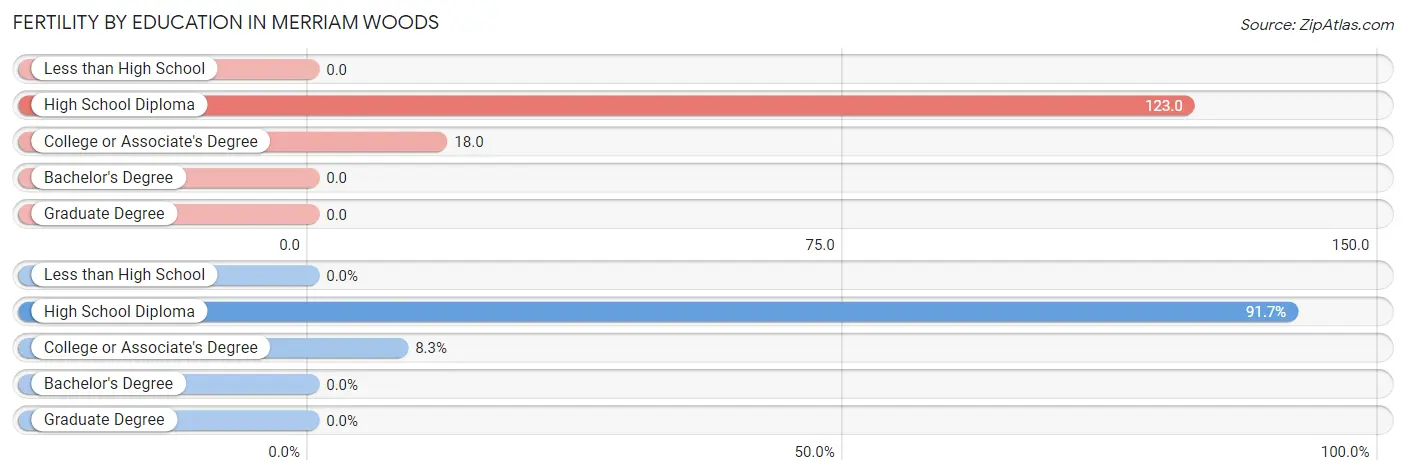
| Educational Attainment | Women with Births | Births / 1,000 Women |
| Less than High School | 0 (0.0%) | 0.0 |
| High School Diploma | 33 (91.7%) | 123.0 |
| College or Associate's Degree | 3 (8.3%) | 18.0 |
| Bachelor's Degree | 0 (0.0%) | 0.0 |
| Graduate Degree | 0 (0.0%) | 0.0 |
| Total | 36 (100.0%) | 63.0 |
Fertility by Education by Marriage Status in Merriam Woods
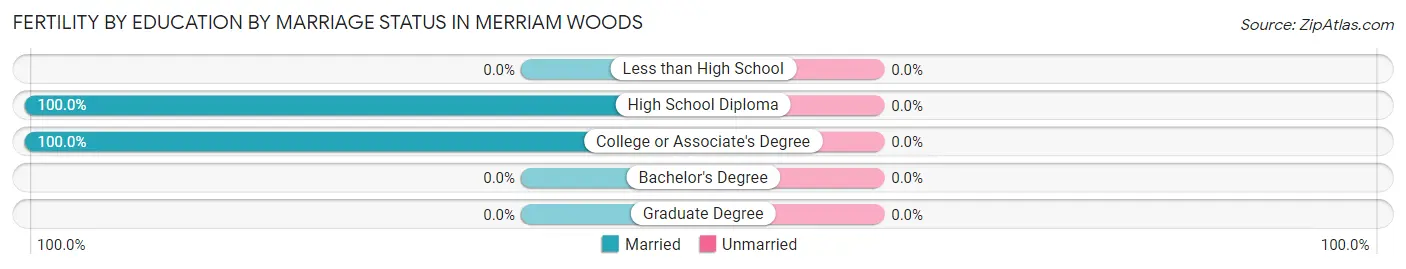
| Educational Attainment | Married | Unmarried |
| Less than High School | 0 (0.0%) | 0 (0.0%) |
| High School Diploma | 33 (100.0%) | 0 (0.0%) |
| College or Associate's Degree | 3 (100.0%) | 0 (0.0%) |
| Bachelor's Degree | 0 (0.0%) | 0 (0.0%) |
| Graduate Degree | 0 (0.0%) | 0 (0.0%) |
| Total | 36 (100.0%) | 0 (0.0%) |
Income in Merriam Woods
Income Overview in Merriam Woods
Per Capita Income in Merriam Woods is $19,878, while median incomes of families and households are $50,250 and $48,750 respectively.
| Characteristic | Number | Measure |
| Per Capita Income | 2,153 | $19,878 |
| Median Family Income | 463 | $50,250 |
| Mean Family Income | 463 | $65,789 |
| Median Household Income | 634 | $48,750 |
| Mean Household Income | 634 | $60,443 |
| Income Deficit | 463 | $0 |
| Wage / Income Gap (%) | 2,153 | 31.99% |
| Wage / Income Gap ($) | 2,153 | 68.01¢ per $1 |
| Gini / Inequality Index | 2,153 | 0.40 |
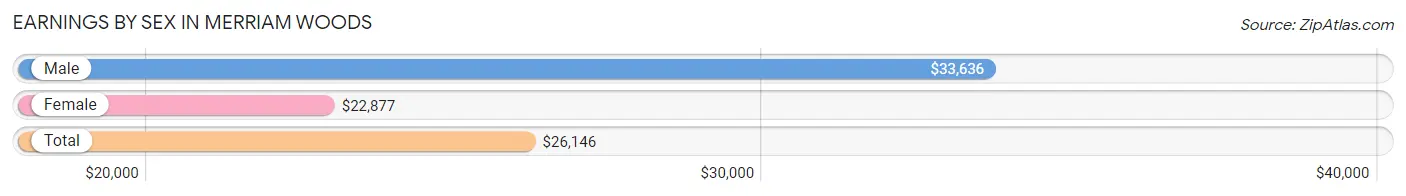
Earnings by Sex in Merriam Woods
Average Earnings in Merriam Woods are $26,146, $33,636 for men and $22,877 for women, a difference of 32.0%.
| Sex | Number | Average Earnings |
| Male | 602 (53.9%) | $33,636 |
| Female | 514 (46.1%) | $22,877 |
| Total | 1,116 (100.0%) | $26,146 |
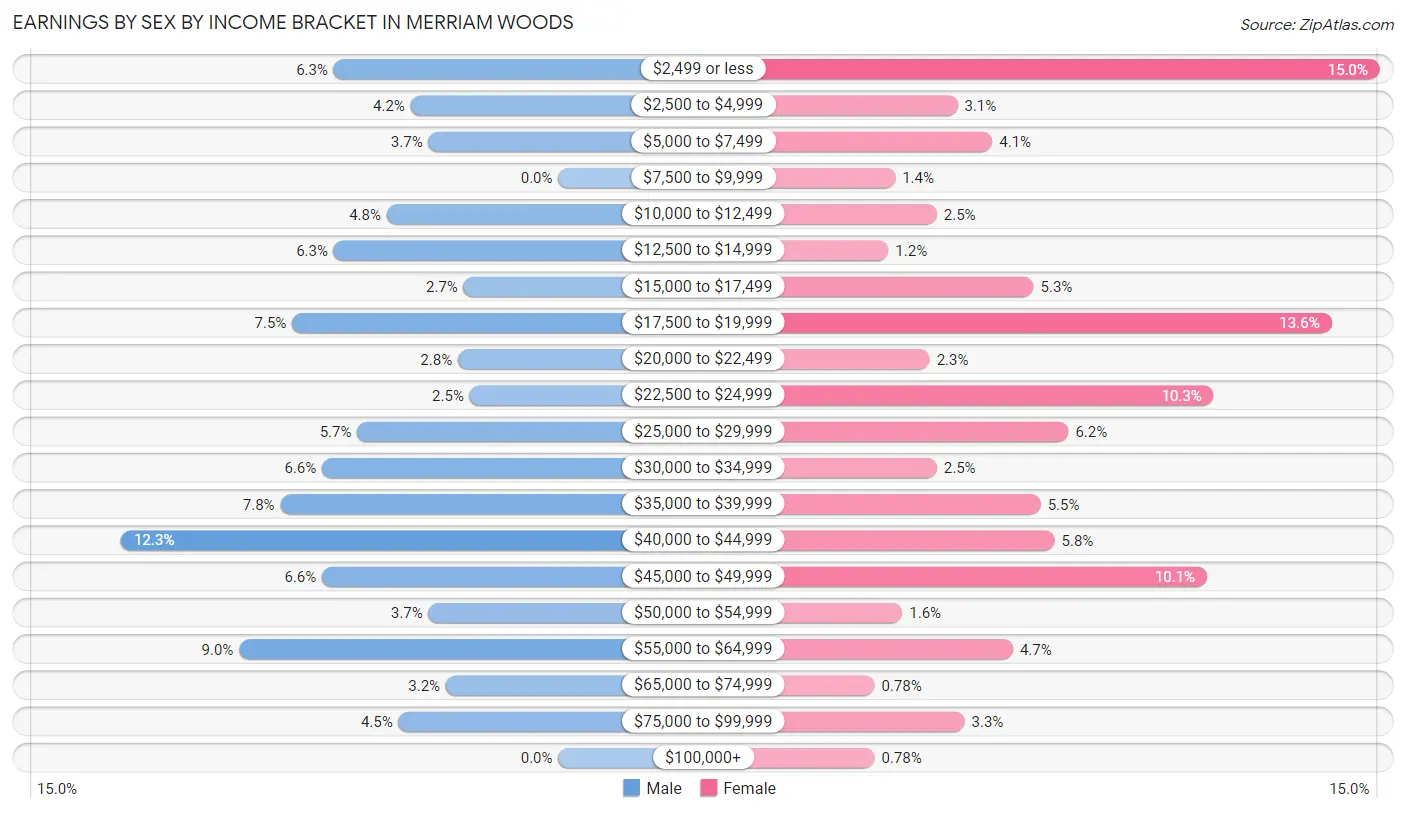
Earnings by Sex by Income Bracket in Merriam Woods
The most common earnings brackets in Merriam Woods are $40,000 to $44,999 for men (74 | 12.3%) and $2,499 or less for women (77 | 15.0%).
| Income | Male | Female |
| $2,499 or less | 38 (6.3%) | 77 (15.0%) |
| $2,500 to $4,999 | 25 (4.2%) | 16 (3.1%) |
| $5,000 to $7,499 | 22 (3.6%) | 21 (4.1%) |
| $7,500 to $9,999 | 0 (0.0%) | 7 (1.4%) |
| $10,000 to $12,499 | 29 (4.8%) | 13 (2.5%) |
| $12,500 to $14,999 | 38 (6.3%) | 6 (1.2%) |
| $15,000 to $17,499 | 16 (2.7%) | 27 (5.2%) |
| $17,500 to $19,999 | 45 (7.5%) | 70 (13.6%) |
| $20,000 to $22,499 | 17 (2.8%) | 12 (2.3%) |
| $22,500 to $24,999 | 15 (2.5%) | 53 (10.3%) |
| $25,000 to $29,999 | 34 (5.7%) | 32 (6.2%) |
| $30,000 to $34,999 | 40 (6.6%) | 13 (2.5%) |
| $35,000 to $39,999 | 47 (7.8%) | 28 (5.4%) |
| $40,000 to $44,999 | 74 (12.3%) | 30 (5.8%) |
| $45,000 to $49,999 | 40 (6.6%) | 52 (10.1%) |
| $50,000 to $54,999 | 22 (3.6%) | 8 (1.6%) |
| $55,000 to $64,999 | 54 (9.0%) | 24 (4.7%) |
| $65,000 to $74,999 | 19 (3.2%) | 4 (0.8%) |
| $75,000 to $99,999 | 27 (4.5%) | 17 (3.3%) |
| $100,000+ | 0 (0.0%) | 4 (0.8%) |
| Total | 602 (100.0%) | 514 (100.0%) |
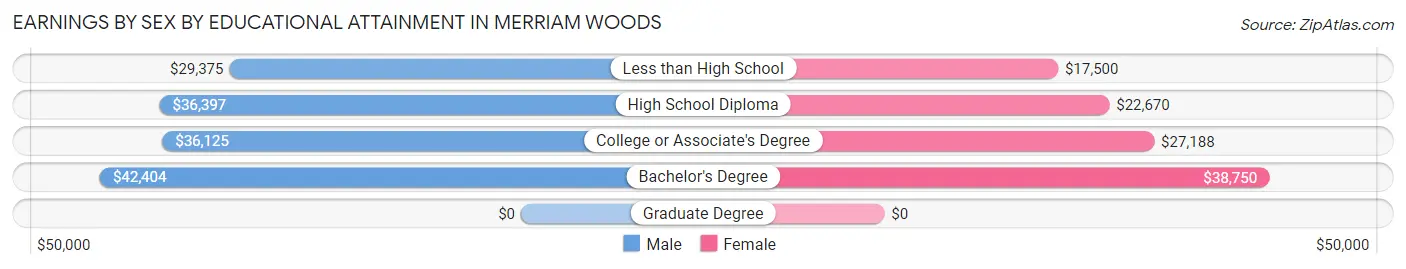
Earnings by Sex by Educational Attainment in Merriam Woods
Average earnings in Merriam Woods are $36,588 for men and $23,406 for women, a difference of 36.0%. Men with an educational attainment of bachelor's degree enjoy the highest average annual earnings of $42,404, while those with less than high school education earn the least with $29,375. Women with an educational attainment of bachelor's degree earn the most with the average annual earnings of $38,750, while those with less than high school education have the smallest earnings of $17,500.
| Educational Attainment | Male Income | Female Income |
| Less than High School | $29,375 | $17,500 |
| High School Diploma | $36,397 | $22,670 |
| College or Associate's Degree | $36,125 | $27,188 |
| Bachelor's Degree | $42,404 | $38,750 |
| Graduate Degree | - | - |
| Total | $36,588 | $23,406 |
Family Income in Merriam Woods
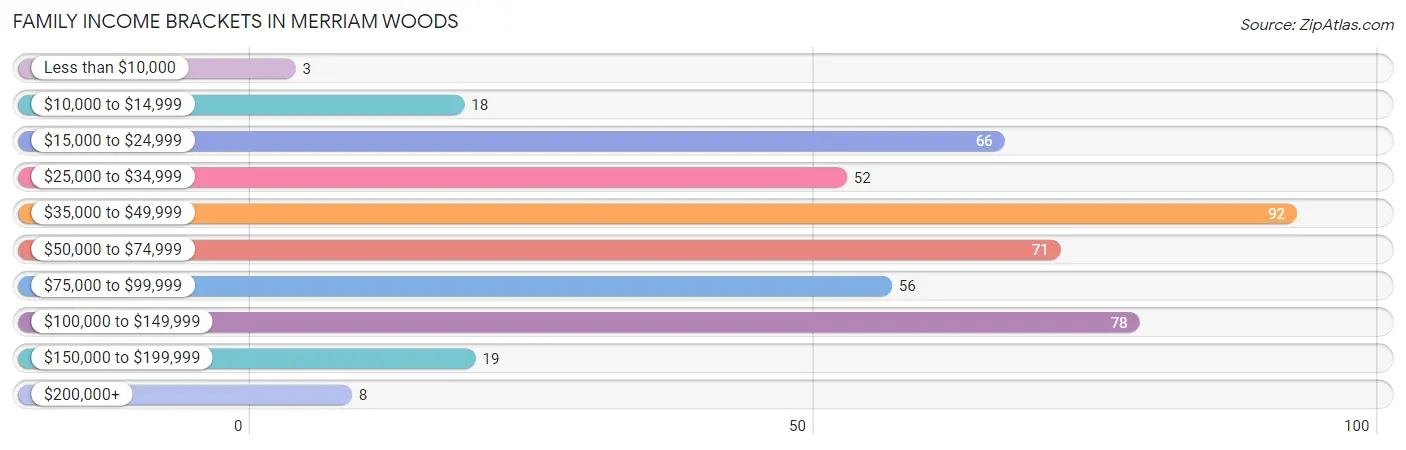
Family Income Brackets in Merriam Woods
According to the Merriam Woods family income data, there are 92 families falling into the $35,000 to $49,999 income range, which is the most common income bracket and makes up 19.9% of all families. Conversely, the less than $10,000 income bracket is the least frequent group with only 3 families (0.6%) belonging to this category.
| Income Bracket | # Families | % Families |
| Less than $10,000 | 3 | 0.6% |
| $10,000 to $14,999 | 18 | 3.9% |
| $15,000 to $24,999 | 66 | 14.3% |
| $25,000 to $34,999 | 52 | 11.2% |
| $35,000 to $49,999 | 92 | 19.9% |
| $50,000 to $74,999 | 71 | 15.3% |
| $75,000 to $99,999 | 56 | 12.1% |
| $100,000 to $149,999 | 78 | 16.8% |
| $150,000 to $199,999 | 19 | 4.1% |
| $200,000+ | 8 | 1.7% |
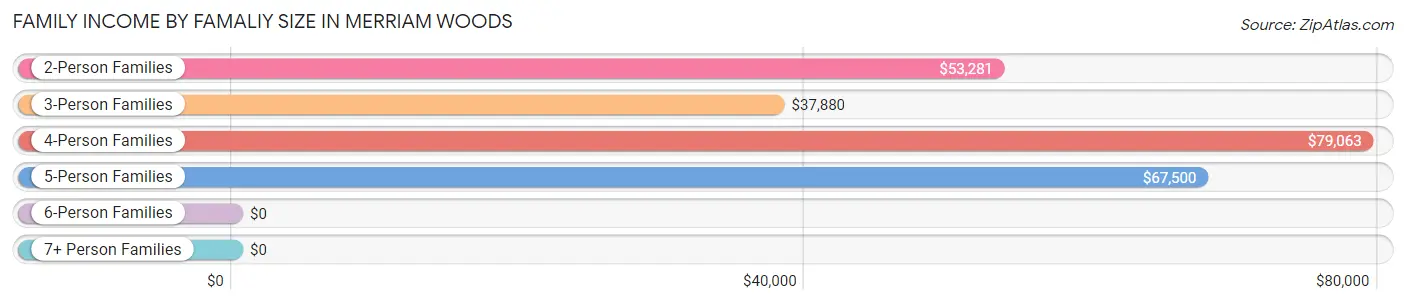
Family Income by Famaliy Size in Merriam Woods
4-person families (83 | 17.9%) account for the highest median family income in Merriam Woods with $79,063 per family, while 2-person families (135 | 29.2%) have the highest median income of $26,640 per family member.
| Income Bracket | # Families | Median Income |
| 2-Person Families | 135 (29.2%) | $53,281 |
| 3-Person Families | 127 (27.4%) | $37,880 |
| 4-Person Families | 83 (17.9%) | $79,063 |
| 5-Person Families | 108 (23.3%) | $67,500 |
| 6-Person Families | 10 (2.2%) | $0 |
| 7+ Person Families | 0 (0.0%) | $0 |
| Total | 463 (100.0%) | $50,250 |
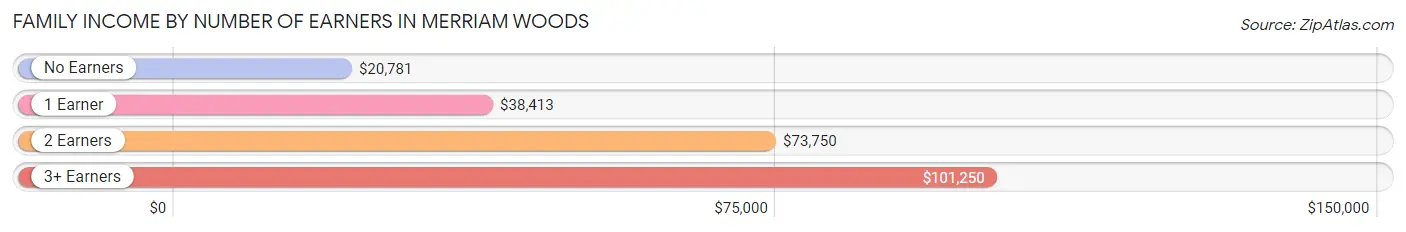
Family Income by Number of Earners in Merriam Woods
The median family income in Merriam Woods is $50,250, with families comprising 3+ earners (65) having the highest median family income of $101,250, while families with no earners (57) have the lowest median family income of $20,781, accounting for 14.0% and 12.3% of families, respectively.
| Number of Earners | # Families | Median Income |
| No Earners | 57 (12.3%) | $20,781 |
| 1 Earner | 155 (33.5%) | $38,413 |
| 2 Earners | 186 (40.2%) | $73,750 |
| 3+ Earners | 65 (14.0%) | $101,250 |
| Total | 463 (100.0%) | $50,250 |
Household Income in Merriam Woods
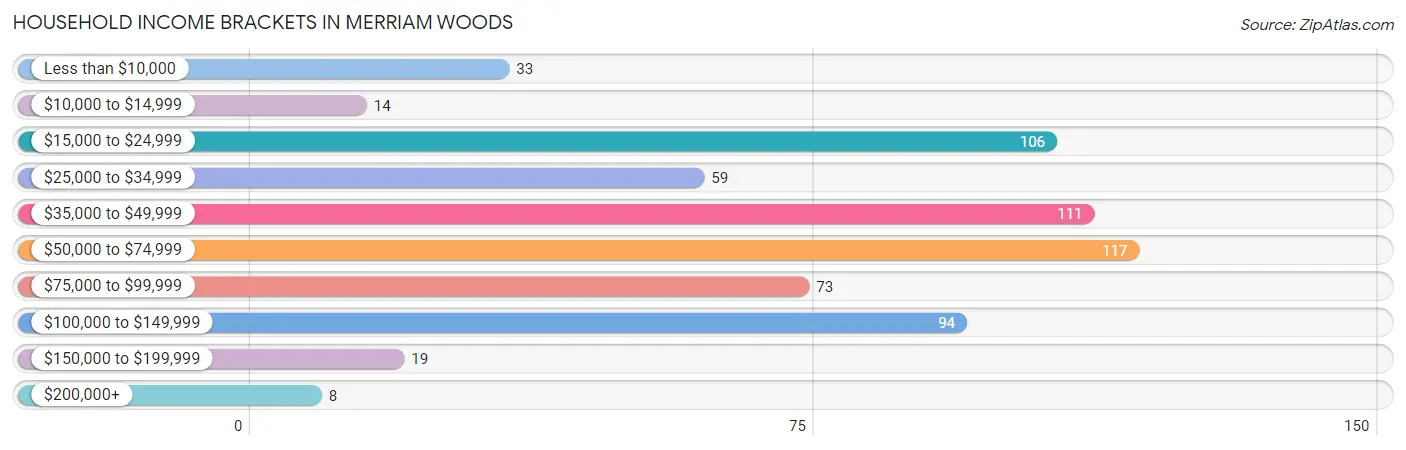
Household Income Brackets in Merriam Woods
With 117 households falling in the category, the $50,000 to $74,999 income range is the most frequent in Merriam Woods, accounting for 18.4% of all households. In contrast, only 8 households (1.3%) fall into the $200,000+ income bracket, making it the least populous group.
| Income Bracket | # Households | % Households |
| Less than $10,000 | 33 | 5.2% |
| $10,000 to $14,999 | 14 | 2.2% |
| $15,000 to $24,999 | 106 | 16.7% |
| $25,000 to $34,999 | 59 | 9.3% |
| $35,000 to $49,999 | 111 | 17.5% |
| $50,000 to $74,999 | 117 | 18.5% |
| $75,000 to $99,999 | 73 | 11.5% |
| $100,000 to $149,999 | 94 | 14.8% |
| $150,000 to $199,999 | 19 | 3.0% |
| $200,000+ | 8 | 1.3% |
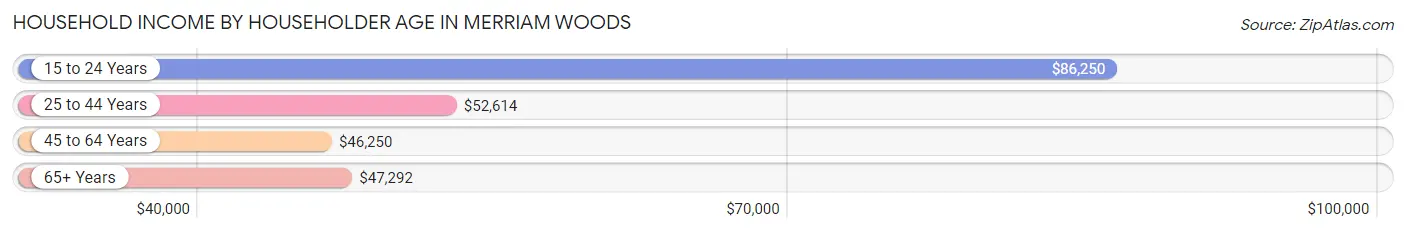
Household Income by Householder Age in Merriam Woods
The median household income in Merriam Woods is $48,750, with the highest median household income of $86,250 found in the 15 to 24 years age bracket for the primary householder. A total of 12 households (1.9%) fall into this category. Meanwhile, the 45 to 64 years age bracket for the primary householder has the lowest median household income of $46,250, with 198 households (31.2%) in this group.
| Income Bracket | # Households | Median Income |
| 15 to 24 Years | 12 (1.9%) | $86,250 |
| 25 to 44 Years | 261 (41.2%) | $52,614 |
| 45 to 64 Years | 198 (31.2%) | $46,250 |
| 65+ Years | 163 (25.7%) | $47,292 |
| Total | 634 (100.0%) | $48,750 |
Poverty in Merriam Woods
Income Below Poverty by Sex and Age in Merriam Woods
With 19.4% poverty level for males and 21.2% for females among the residents of Merriam Woods, 5 year old males and 16 and 17 year old females are the most vulnerable to poverty, with 13 males (100.0%) and 41 females (63.1%) in their respective age groups living below the poverty level.
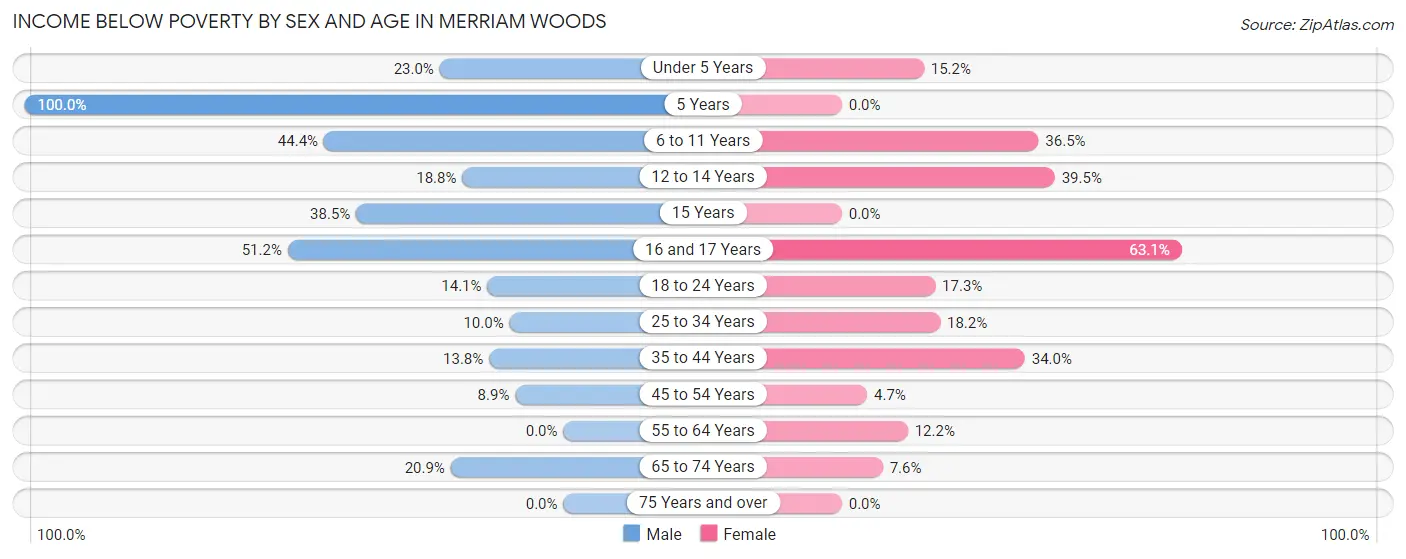
| Age Bracket | Male | Female |
| Under 5 Years | 14 (23.0%) | 14 (15.2%) |
| 5 Years | 13 (100.0%) | 0 (0.0%) |
| 6 to 11 Years | 64 (44.4%) | 27 (36.5%) |
| 12 to 14 Years | 12 (18.8%) | 17 (39.5%) |
| 15 Years | 5 (38.5%) | 0 (0.0%) |
| 16 and 17 Years | 22 (51.2%) | 41 (63.1%) |
| 18 to 24 Years | 11 (14.1%) | 13 (17.3%) |
| 25 to 34 Years | 12 (10.0%) | 27 (18.2%) |
| 35 to 44 Years | 27 (13.8%) | 53 (34.0%) |
| 45 to 54 Years | 15 (8.9%) | 7 (4.7%) |
| 55 to 64 Years | 0 (0.0%) | 12 (12.2%) |
| 65 to 74 Years | 23 (20.9%) | 6 (7.6%) |
| 75 Years and over | 0 (0.0%) | 0 (0.0%) |
| Total | 218 (19.4%) | 217 (21.2%) |
Income Above Poverty by Sex and Age in Merriam Woods
According to the poverty statistics in Merriam Woods, males aged 55 to 64 years and females aged 5 years are the age groups that are most secure financially, with 100.0% of males and 100.0% of females in these age groups living above the poverty line.
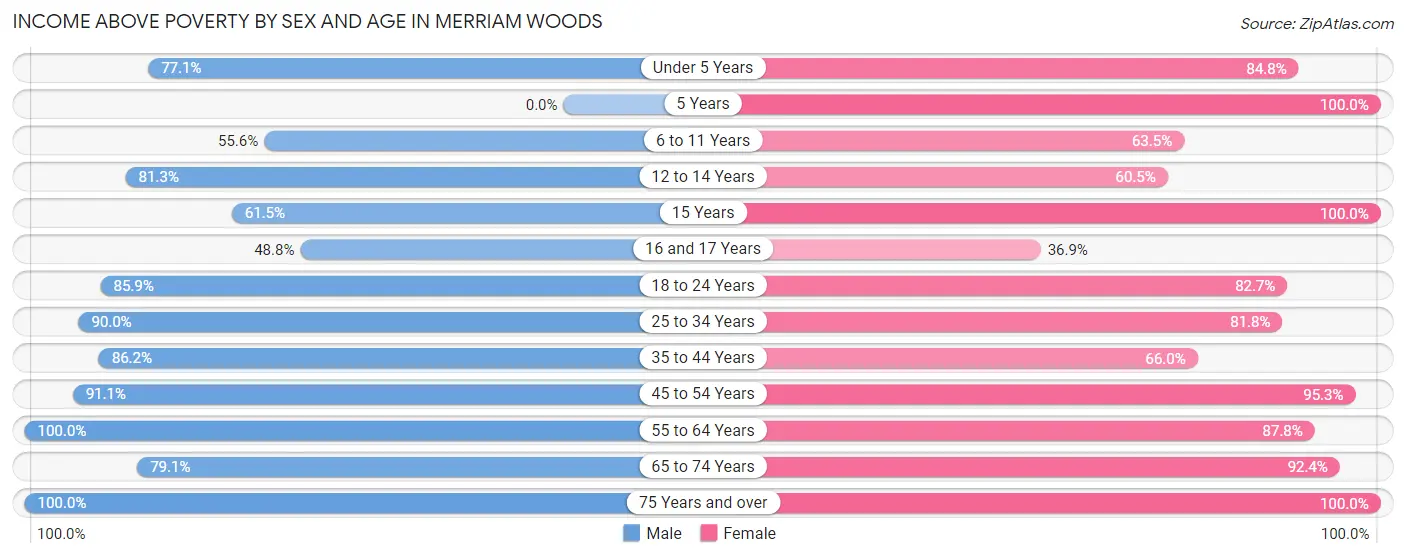
| Age Bracket | Male | Female |
| Under 5 Years | 47 (77.0%) | 78 (84.8%) |
| 5 Years | 0 (0.0%) | 17 (100.0%) |
| 6 to 11 Years | 80 (55.6%) | 47 (63.5%) |
| 12 to 14 Years | 52 (81.2%) | 26 (60.5%) |
| 15 Years | 8 (61.5%) | 7 (100.0%) |
| 16 and 17 Years | 21 (48.8%) | 24 (36.9%) |
| 18 to 24 Years | 67 (85.9%) | 62 (82.7%) |
| 25 to 34 Years | 108 (90.0%) | 121 (81.8%) |
| 35 to 44 Years | 169 (86.2%) | 103 (66.0%) |
| 45 to 54 Years | 153 (91.1%) | 142 (95.3%) |
| 55 to 64 Years | 90 (100.0%) | 86 (87.8%) |
| 65 to 74 Years | 87 (79.1%) | 73 (92.4%) |
| 75 Years and over | 23 (100.0%) | 22 (100.0%) |
| Total | 905 (80.6%) | 808 (78.8%) |
Income Below Poverty Among Married-Couple Families in Merriam Woods
The poverty statistics for married-couple families in Merriam Woods show that 11.6% or 37 of the total 319 families live below the poverty line. Families with 3 or 4 children have the highest poverty rate of 21.7%, comprising of 10 families. On the other hand, families with no children have the lowest poverty rate of 5.4%, which includes 10 families.
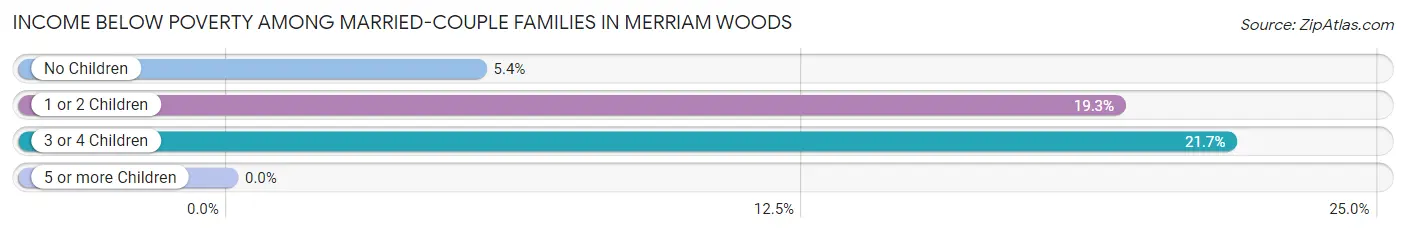
| Children | Above Poverty | Below Poverty |
| No Children | 175 (94.6%) | 10 (5.4%) |
| 1 or 2 Children | 71 (80.7%) | 17 (19.3%) |
| 3 or 4 Children | 36 (78.3%) | 10 (21.7%) |
| 5 or more Children | 0 (0.0%) | 0 (0.0%) |
| Total | 282 (88.4%) | 37 (11.6%) |
Income Below Poverty Among Single-Parent Households in Merriam Woods
According to the poverty data in Merriam Woods, 8.1% or 5 single-father households and 56.1% or 46 single-mother households are living below the poverty line. Among single-father households, those with 3 or 4 children have the highest poverty rate, with 5 households (31.2%) experiencing poverty. Likewise, among single-mother households, those with 3 or 4 children have the highest poverty rate, with 21 households (100.0%) falling below the poverty line.
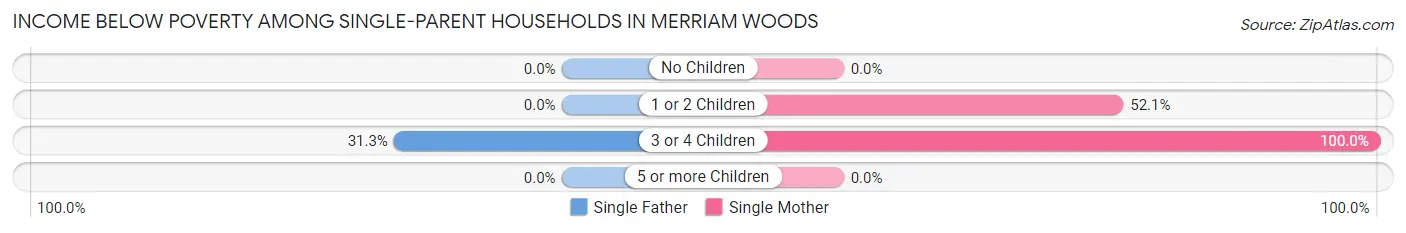
| Children | Single Father | Single Mother |
| No Children | 0 (0.0%) | 0 (0.0%) |
| 1 or 2 Children | 0 (0.0%) | 25 (52.1%) |
| 3 or 4 Children | 5 (31.2%) | 21 (100.0%) |
| 5 or more Children | 0 (0.0%) | 0 (0.0%) |
| Total | 5 (8.1%) | 46 (56.1%) |
Income Below Poverty Among Married-Couple vs Single-Parent Households in Merriam Woods
The poverty data for Merriam Woods shows that 37 of the married-couple family households (11.6%) and 51 of the single-parent households (35.4%) are living below the poverty level. Within the married-couple family households, those with 3 or 4 children have the highest poverty rate, with 10 households (21.7%) falling below the poverty line. Among the single-parent households, those with 3 or 4 children have the highest poverty rate, with 26 household (70.3%) living below poverty.
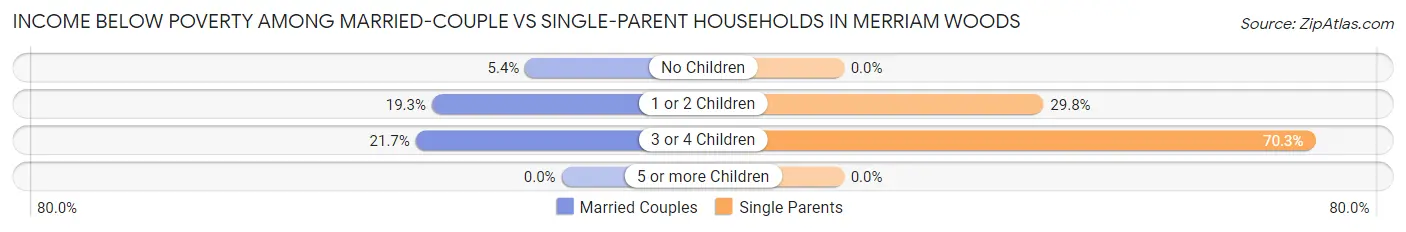
| Children | Married-Couple Families | Single-Parent Households |
| No Children | 10 (5.4%) | 0 (0.0%) |
| 1 or 2 Children | 17 (19.3%) | 25 (29.8%) |
| 3 or 4 Children | 10 (21.7%) | 26 (70.3%) |
| 5 or more Children | 0 (0.0%) | 0 (0.0%) |
| Total | 37 (11.6%) | 51 (35.4%) |
Employment Characteristics in Merriam Woods
Employment by Class of Employer in Merriam Woods
Among the 923 employed individuals in Merriam Woods, private company employees (768 | 83.2%), not-for-profit organizations (51 | 5.5%), and local government employees (44 | 4.8%) make up the most common classes of employment.
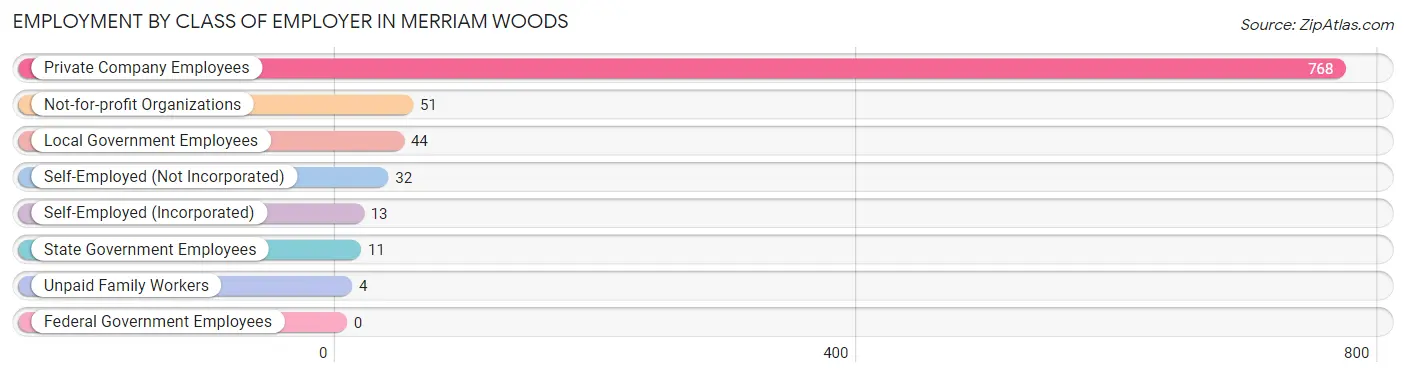
| Employer Class | # Employees | % Employees |
| Private Company Employees | 768 | 83.2% |
| Self-Employed (Incorporated) | 13 | 1.4% |
| Self-Employed (Not Incorporated) | 32 | 3.5% |
| Not-for-profit Organizations | 51 | 5.5% |
| Local Government Employees | 44 | 4.8% |
| State Government Employees | 11 | 1.2% |
| Federal Government Employees | 0 | 0.0% |
| Unpaid Family Workers | 4 | 0.4% |
| Total | 923 | 100.0% |
Employment Status by Age in Merriam Woods
According to the labor force statistics for Merriam Woods, out of the total population over 16 years of age (1,620), 67.2% or 1,089 individuals are in the labor force, with 12.5% or 136 of them unemployed. The age group with the highest labor force participation rate is 30 to 34 years, with 87.1% or 108 individuals in the labor force. Within the labor force, the 20 to 24 years age range has the highest percentage of unemployed individuals, with 26.8% or 15 of them being unemployed.
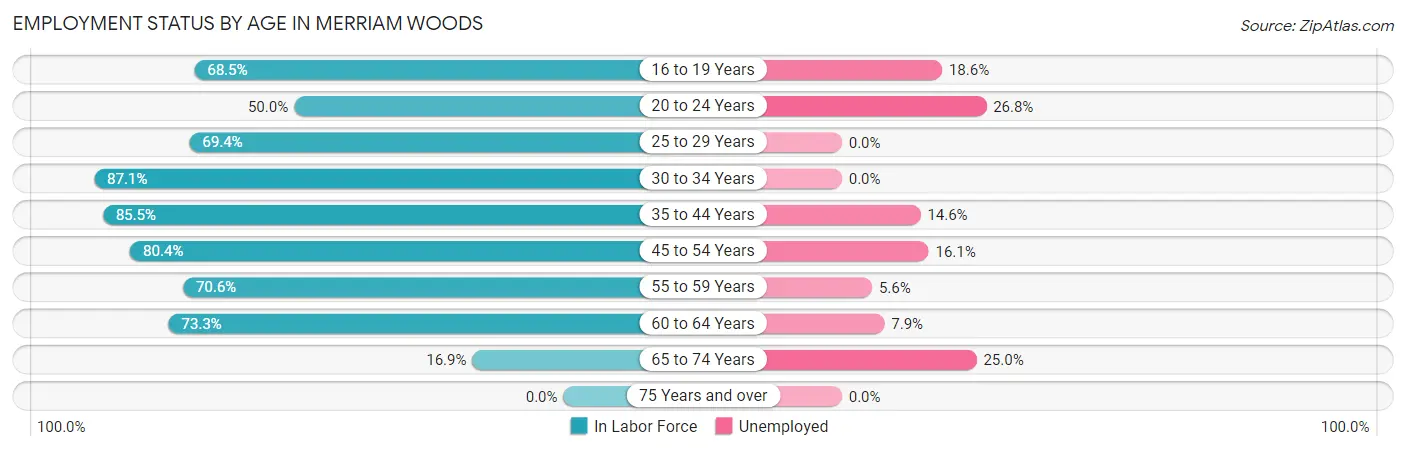
| Age Bracket | In Labor Force | Unemployed |
| 16 to 19 Years | 102 (68.5%) | 19 (18.6%) |
| 20 to 24 Years | 56 (50.0%) | 15 (26.8%) |
| 25 to 29 Years | 100 (69.4%) | 0 (0.0%) |
| 30 to 34 Years | 108 (87.1%) | 0 (0.0%) |
| 35 to 44 Years | 301 (85.5%) | 44 (14.6%) |
| 45 to 54 Years | 255 (80.4%) | 41 (16.1%) |
| 55 to 59 Years | 72 (70.6%) | 4 (5.6%) |
| 60 to 64 Years | 63 (73.3%) | 5 (7.9%) |
| 65 to 74 Years | 32 (16.9%) | 8 (25.0%) |
| 75 Years and over | 0 (0.0%) | 0 (0.0%) |
| Total | 1,089 (67.2%) | 136 (12.5%) |
Employment Status by Educational Attainment in Merriam Woods
According to labor force statistics for Merriam Woods, 79.9% of individuals (899) out of the total population between 25 and 64 years of age (1,125) are in the labor force, with 10.5% or 94 of them being unemployed. The group with the highest labor force participation rate are those with the educational attainment of bachelor's degree or higher, with 94.3% or 100 individuals in the labor force. Within the labor force, individuals with high school diploma education have the highest percentage of unemployment, with 13.2% or 49 of them being unemployed.
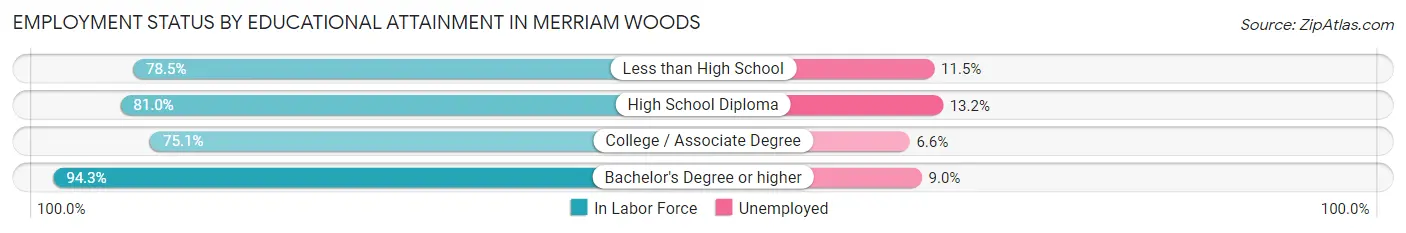
| Educational Attainment | In Labor Force | Unemployed |
| Less than High School | 157 (78.5%) | 23 (11.5%) |
| High School Diploma | 371 (81.0%) | 60 (13.2%) |
| College / Associate Degree | 271 (75.1%) | 24 (6.6%) |
| Bachelor's Degree or higher | 100 (94.3%) | 10 (9.0%) |
| Total | 899 (79.9%) | 118 (10.5%) |
Employment Occupations by Sex in Merriam Woods
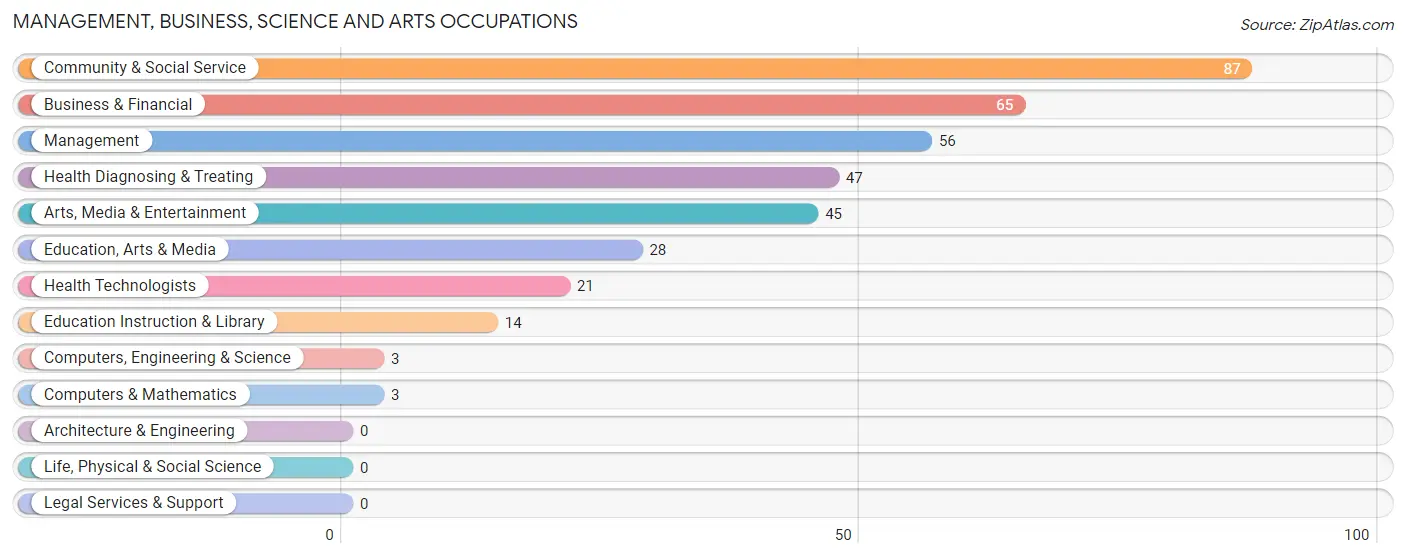
Management, Business, Science and Arts Occupations
The most common Management, Business, Science and Arts occupations in Merriam Woods are Community & Social Service (87 | 9.1%), Business & Financial (65 | 6.8%), Management (56 | 5.9%), Health Diagnosing & Treating (47 | 4.9%), and Arts, Media & Entertainment (45 | 4.7%).
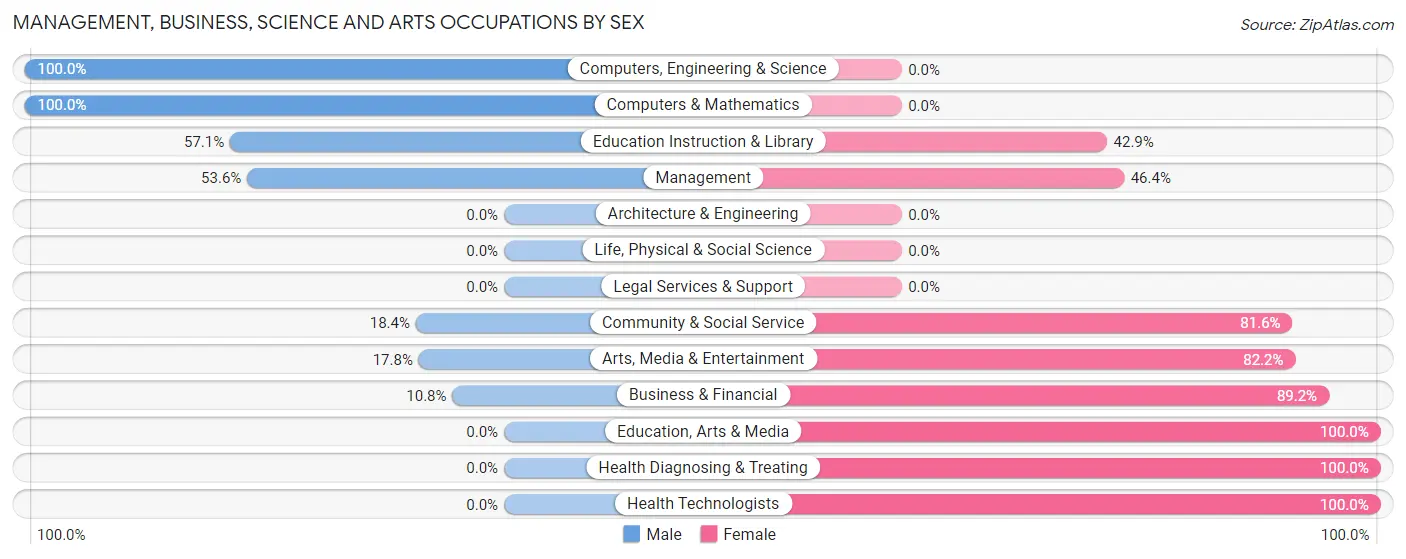
Management, Business, Science and Arts Occupations by Sex
Within the Management, Business, Science and Arts occupations in Merriam Woods, the most male-oriented occupations are Computers, Engineering & Science (100.0%), Computers & Mathematics (100.0%), and Education Instruction & Library (57.1%), while the most female-oriented occupations are Education, Arts & Media (100.0%), Health Diagnosing & Treating (100.0%), and Health Technologists (100.0%).
| Occupation | Male | Female |
| Management | 30 (53.6%) | 26 (46.4%) |
| Business & Financial | 7 (10.8%) | 58 (89.2%) |
| Computers, Engineering & Science | 3 (100.0%) | 0 (0.0%) |
| Computers & Mathematics | 3 (100.0%) | 0 (0.0%) |
| Architecture & Engineering | 0 (0.0%) | 0 (0.0%) |
| Life, Physical & Social Science | 0 (0.0%) | 0 (0.0%) |
| Community & Social Service | 16 (18.4%) | 71 (81.6%) |
| Education, Arts & Media | 0 (0.0%) | 28 (100.0%) |
| Legal Services & Support | 0 (0.0%) | 0 (0.0%) |
| Education Instruction & Library | 8 (57.1%) | 6 (42.9%) |
| Arts, Media & Entertainment | 8 (17.8%) | 37 (82.2%) |
| Health Diagnosing & Treating | 0 (0.0%) | 47 (100.0%) |
| Health Technologists | 0 (0.0%) | 21 (100.0%) |
| Total (Category) | 56 (21.7%) | 202 (78.3%) |
| Total (Overall) | 505 (53.0%) | 448 (47.0%) |
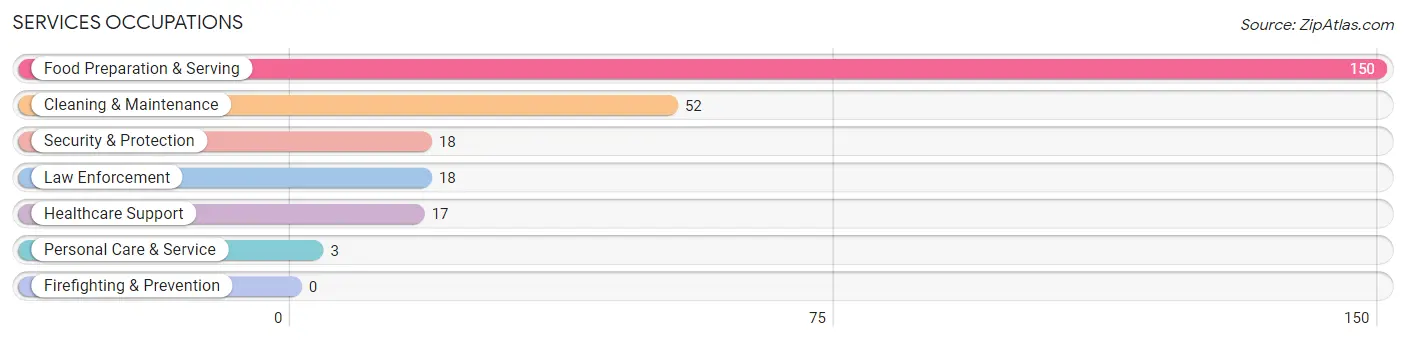
Services Occupations
The most common Services occupations in Merriam Woods are Food Preparation & Serving (150 | 15.7%), Cleaning & Maintenance (52 | 5.5%), Security & Protection (18 | 1.9%), Law Enforcement (18 | 1.9%), and Healthcare Support (17 | 1.8%).
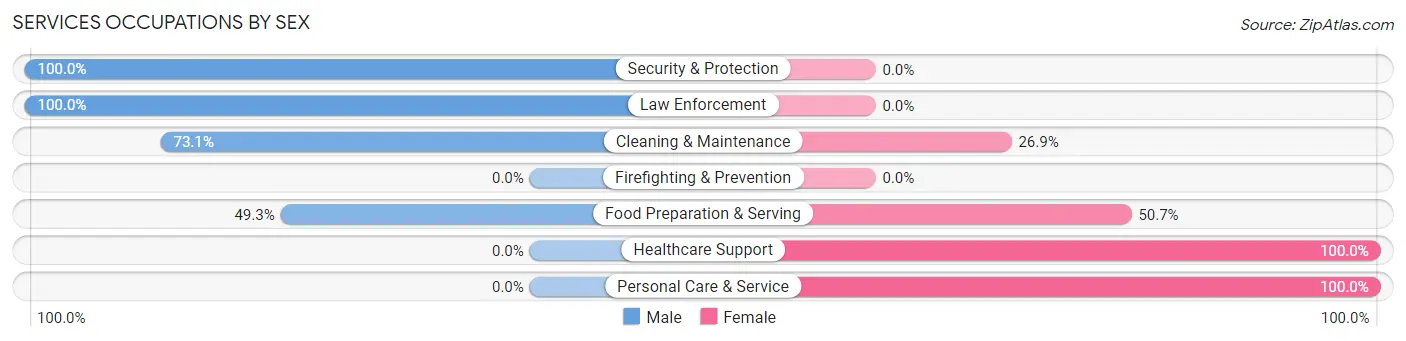
Services Occupations by Sex
Within the Services occupations in Merriam Woods, the most male-oriented occupations are Security & Protection (100.0%), Law Enforcement (100.0%), and Cleaning & Maintenance (73.1%), while the most female-oriented occupations are Healthcare Support (100.0%), Personal Care & Service (100.0%), and Food Preparation & Serving (50.7%).
| Occupation | Male | Female |
| Healthcare Support | 0 (0.0%) | 17 (100.0%) |
| Security & Protection | 18 (100.0%) | 0 (0.0%) |
| Firefighting & Prevention | 0 (0.0%) | 0 (0.0%) |
| Law Enforcement | 18 (100.0%) | 0 (0.0%) |
| Food Preparation & Serving | 74 (49.3%) | 76 (50.7%) |
| Cleaning & Maintenance | 38 (73.1%) | 14 (26.9%) |
| Personal Care & Service | 0 (0.0%) | 3 (100.0%) |
| Total (Category) | 130 (54.2%) | 110 (45.8%) |
| Total (Overall) | 505 (53.0%) | 448 (47.0%) |
Sales and Office Occupations
The most common Sales and Office occupations in Merriam Woods are Sales & Related (111 | 11.7%), and Office & Administration (57 | 6.0%).
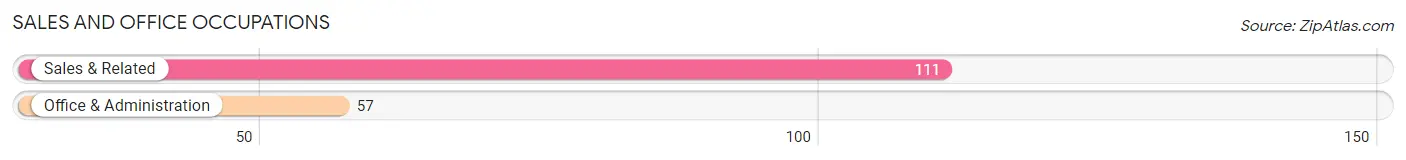
Sales and Office Occupations by Sex
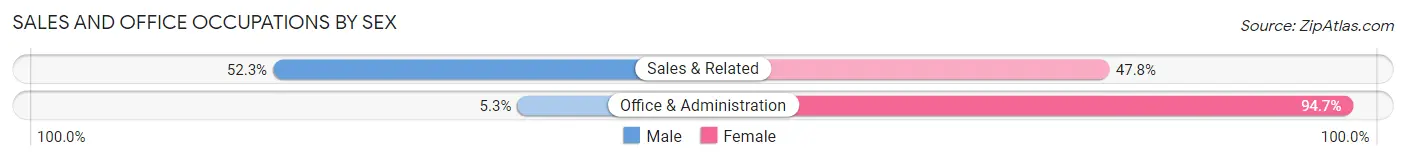
| Occupation | Male | Female |
| Sales & Related | 58 (52.2%) | 53 (47.7%) |
| Office & Administration | 3 (5.3%) | 54 (94.7%) |
| Total (Category) | 61 (36.3%) | 107 (63.7%) |
| Total (Overall) | 505 (53.0%) | 448 (47.0%) |
Natural Resources, Construction and Maintenance Occupations
The most common Natural Resources, Construction and Maintenance occupations in Merriam Woods are Construction & Extraction (95 | 10.0%), Installation, Maintenance & Repair (42 | 4.4%), and Farming, Fishing & Forestry (3 | 0.3%).
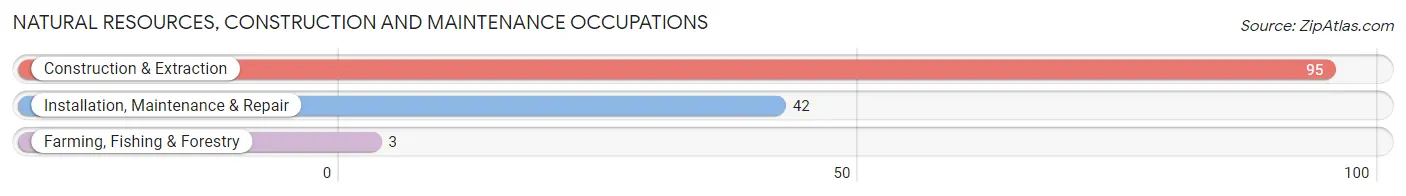
Natural Resources, Construction and Maintenance Occupations by Sex
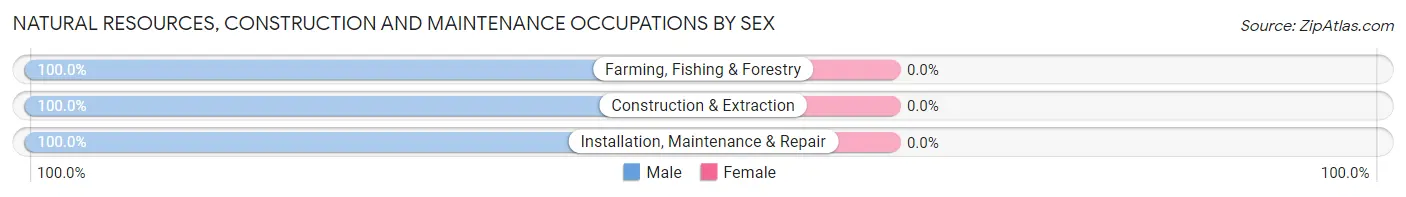
| Occupation | Male | Female |
| Farming, Fishing & Forestry | 3 (100.0%) | 0 (0.0%) |
| Construction & Extraction | 95 (100.0%) | 0 (0.0%) |
| Installation, Maintenance & Repair | 42 (100.0%) | 0 (0.0%) |
| Total (Category) | 140 (100.0%) | 0 (0.0%) |
| Total (Overall) | 505 (53.0%) | 448 (47.0%) |
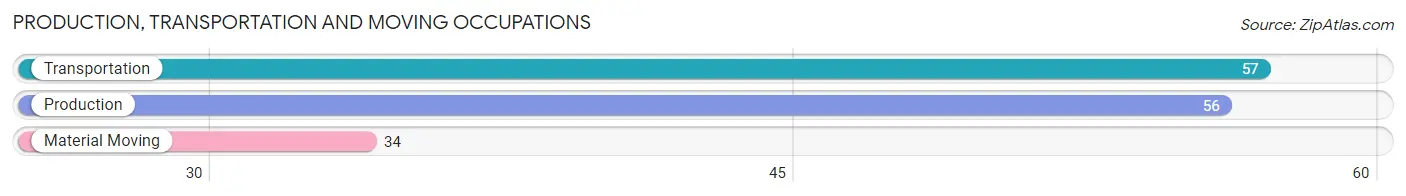
Production, Transportation and Moving Occupations
The most common Production, Transportation and Moving occupations in Merriam Woods are Transportation (57 | 6.0%), Production (56 | 5.9%), and Material Moving (34 | 3.6%).
Production, Transportation and Moving Occupations by Sex
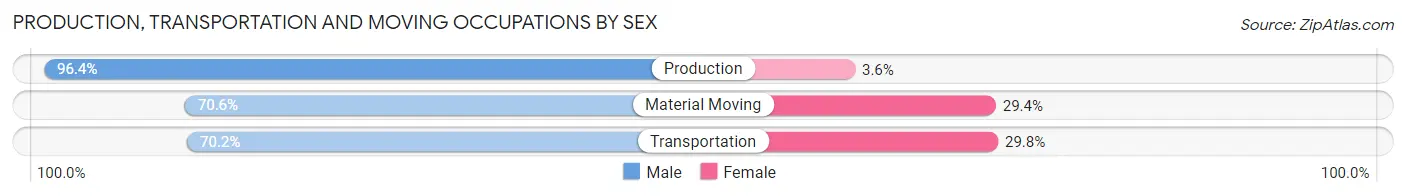
| Occupation | Male | Female |
| Production | 54 (96.4%) | 2 (3.6%) |
| Transportation | 40 (70.2%) | 17 (29.8%) |
| Material Moving | 24 (70.6%) | 10 (29.4%) |
| Total (Category) | 118 (80.3%) | 29 (19.7%) |
| Total (Overall) | 505 (53.0%) | 448 (47.0%) |
Employment Industries by Sex in Merriam Woods
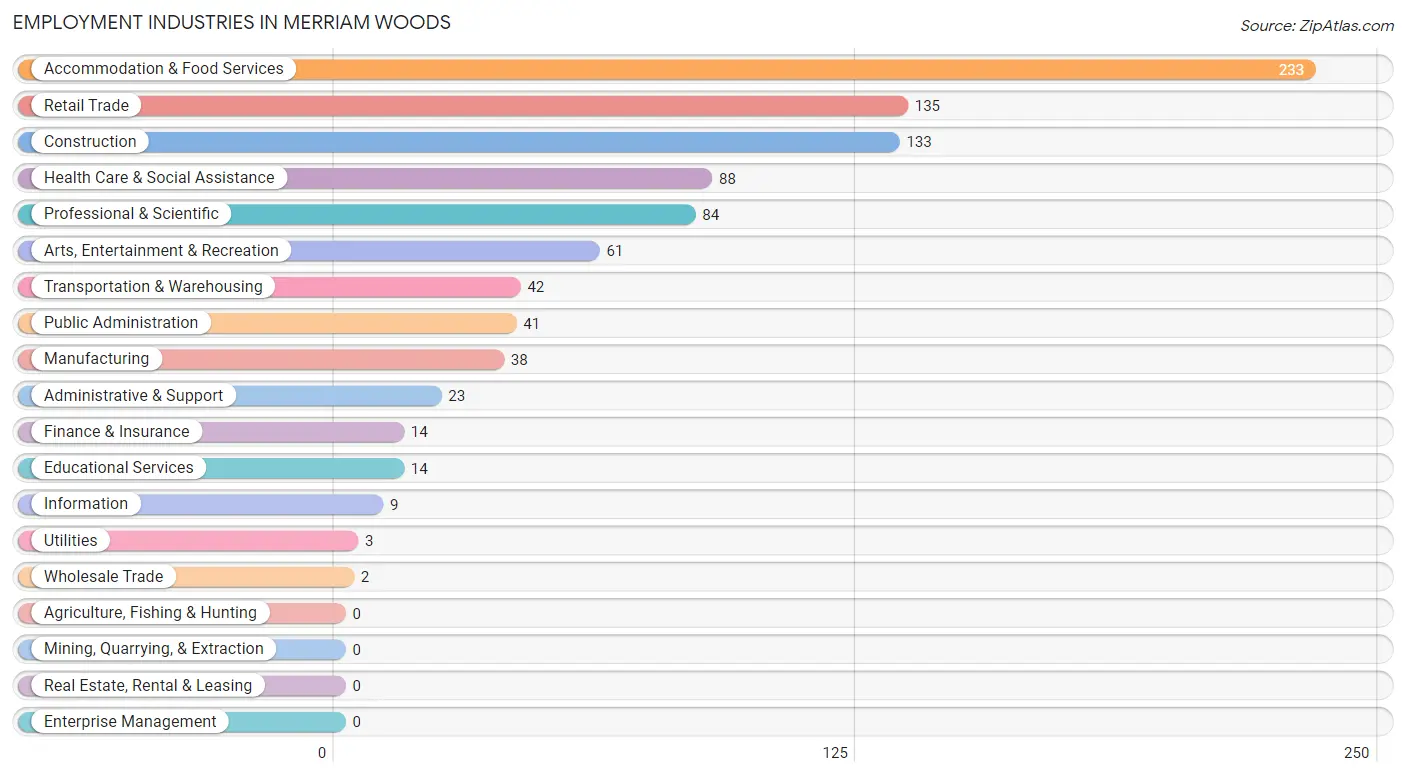
Employment Industries in Merriam Woods
The major employment industries in Merriam Woods include Accommodation & Food Services (233 | 24.4%), Retail Trade (135 | 14.2%), Construction (133 | 14.0%), Health Care & Social Assistance (88 | 9.2%), and Professional & Scientific (84 | 8.8%).
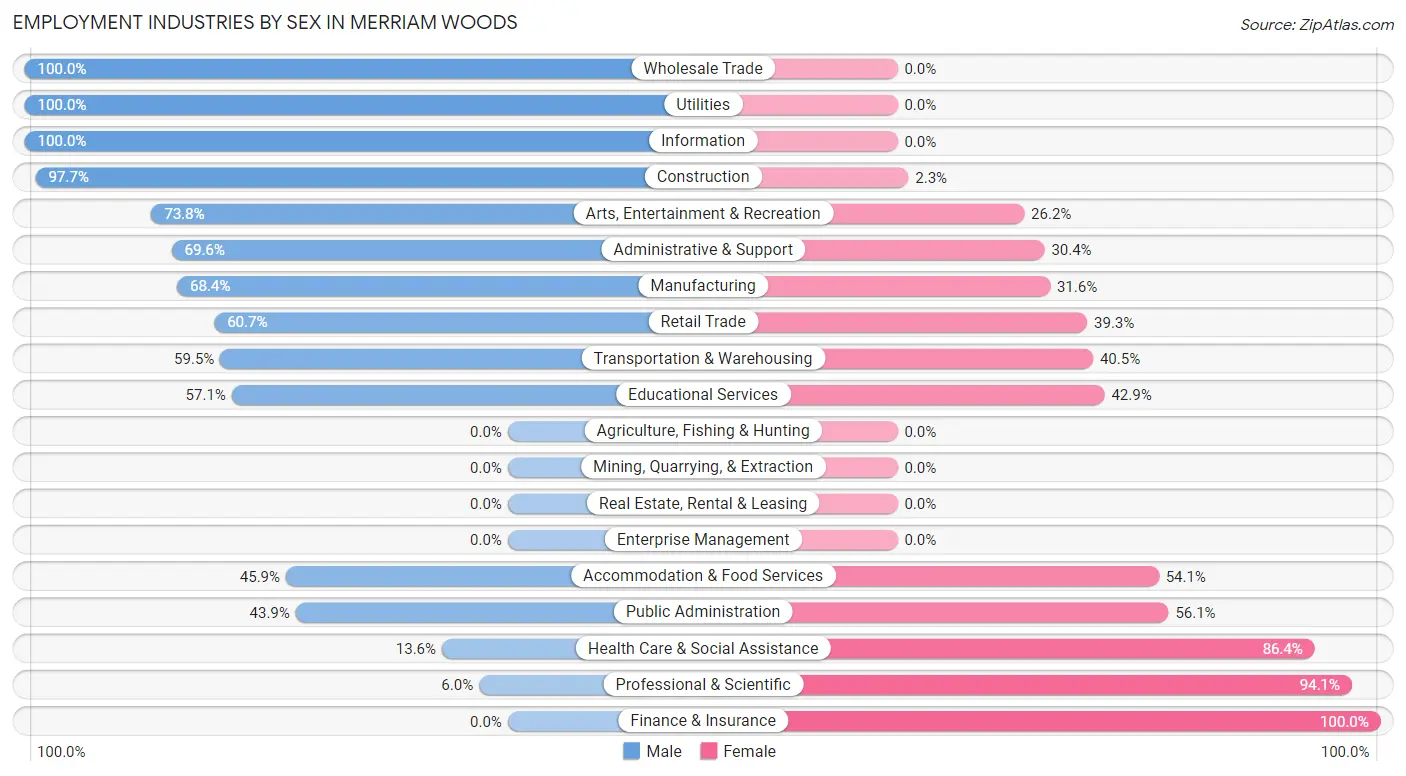
Employment Industries by Sex in Merriam Woods
The Merriam Woods industries that see more men than women are Wholesale Trade (100.0%), Utilities (100.0%), and Information (100.0%), whereas the industries that tend to have a higher number of women are Finance & Insurance (100.0%), Professional & Scientific (94.1%), and Health Care & Social Assistance (86.4%).
| Industry | Male | Female |
| Agriculture, Fishing & Hunting | 0 (0.0%) | 0 (0.0%) |
| Mining, Quarrying, & Extraction | 0 (0.0%) | 0 (0.0%) |
| Construction | 130 (97.7%) | 3 (2.3%) |
| Manufacturing | 26 (68.4%) | 12 (31.6%) |
| Wholesale Trade | 2 (100.0%) | 0 (0.0%) |
| Retail Trade | 82 (60.7%) | 53 (39.3%) |
| Transportation & Warehousing | 25 (59.5%) | 17 (40.5%) |
| Utilities | 3 (100.0%) | 0 (0.0%) |
| Information | 9 (100.0%) | 0 (0.0%) |
| Finance & Insurance | 0 (0.0%) | 14 (100.0%) |
| Real Estate, Rental & Leasing | 0 (0.0%) | 0 (0.0%) |
| Professional & Scientific | 5 (5.9%) | 79 (94.1%) |
| Enterprise Management | 0 (0.0%) | 0 (0.0%) |
| Administrative & Support | 16 (69.6%) | 7 (30.4%) |
| Educational Services | 8 (57.1%) | 6 (42.9%) |
| Health Care & Social Assistance | 12 (13.6%) | 76 (86.4%) |
| Arts, Entertainment & Recreation | 45 (73.8%) | 16 (26.2%) |
| Accommodation & Food Services | 107 (45.9%) | 126 (54.1%) |
| Public Administration | 18 (43.9%) | 23 (56.1%) |
| Total | 505 (53.0%) | 448 (47.0%) |
Education in Merriam Woods
School Enrollment in Merriam Woods
The most common levels of schooling among the 560 students in Merriam Woods are elementary school (181 | 32.3%), high school (144 | 25.7%), and middle school (123 | 22.0%).
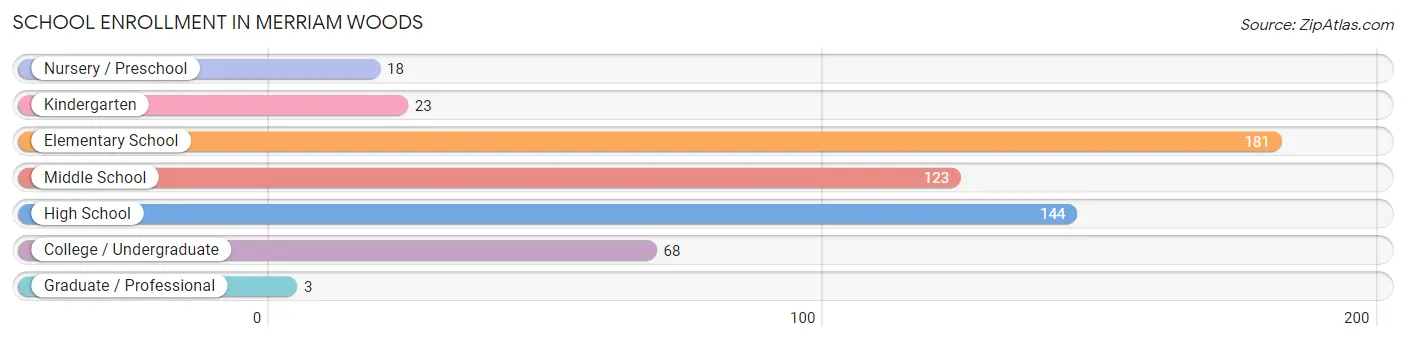
| School Level | # Students | % Students |
| Nursery / Preschool | 18 | 3.2% |
| Kindergarten | 23 | 4.1% |
| Elementary School | 181 | 32.3% |
| Middle School | 123 | 22.0% |
| High School | 144 | 25.7% |
| College / Undergraduate | 68 | 12.1% |
| Graduate / Professional | 3 | 0.5% |
| Total | 560 | 100.0% |
School Enrollment by Age by Funding Source in Merriam Woods
Out of a total of 560 students who are enrolled in schools in Merriam Woods, 34 (6.1%) attend a private institution, while the remaining 526 (93.9%) are enrolled in public schools. The age group of 3 to 4 year olds has the highest likelihood of being enrolled in private schools, with 5 (38.5% in the age bracket) enrolled. Conversely, the age group of 18 to 19 year olds has the lowest likelihood of being enrolled in a private school, with 34 (100.0% in the age bracket) attending a public institution.
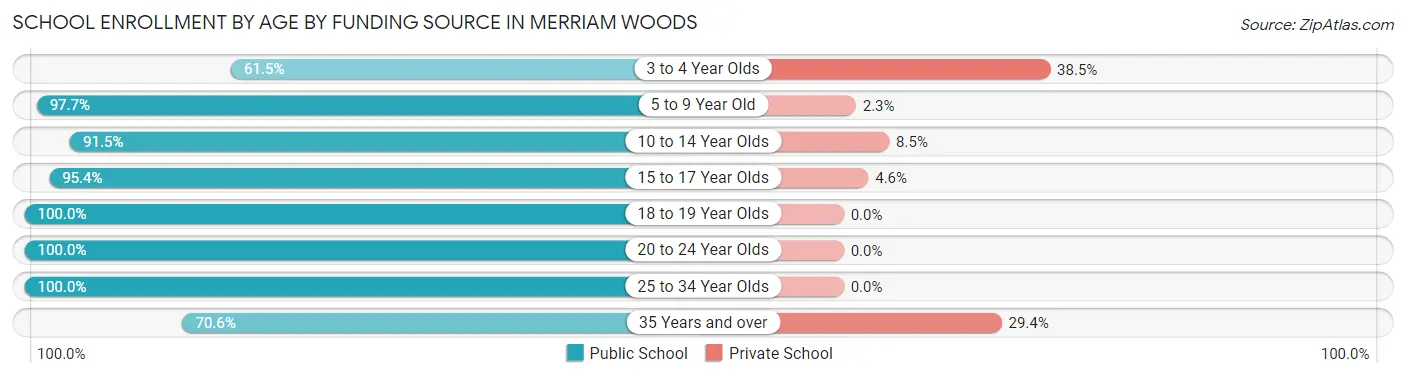
| Age Bracket | Public School | Private School |
| 3 to 4 Year Olds | 8 (61.5%) | 5 (38.5%) |
| 5 to 9 Year Old | 173 (97.7%) | 4 (2.3%) |
| 10 to 14 Year Olds | 162 (91.5%) | 15 (8.5%) |
| 15 to 17 Year Olds | 104 (95.4%) | 5 (4.6%) |
| 18 to 19 Year Olds | 34 (100.0%) | 0 (0.0%) |
| 20 to 24 Year Olds | 12 (100.0%) | 0 (0.0%) |
| 25 to 34 Year Olds | 21 (100.0%) | 0 (0.0%) |
| 35 Years and over | 12 (70.6%) | 5 (29.4%) |
| Total | 526 (93.9%) | 34 (6.1%) |
Educational Attainment by Field of Study in Merriam Woods
Business (32 | 21.9%), social sciences (28 | 19.2%), arts & humanities (20 | 13.7%), education (19 | 13.0%), and visual & performing arts (16 | 11.0%) are the most common fields of study among 146 individuals in Merriam Woods who have obtained a bachelor's degree or higher.

| Field of Study | # Graduates | % Graduates |
| Computers & Mathematics | 3 | 2.1% |
| Bio, Nature & Agricultural | 5 | 3.4% |
| Physical & Health Sciences | 11 | 7.5% |
| Psychology | 6 | 4.1% |
| Social Sciences | 28 | 19.2% |
| Engineering | 0 | 0.0% |
| Multidisciplinary Studies | 0 | 0.0% |
| Science & Technology | 4 | 2.7% |
| Business | 32 | 21.9% |
| Education | 19 | 13.0% |
| Literature & Languages | 0 | 0.0% |
| Liberal Arts & History | 2 | 1.4% |
| Visual & Performing Arts | 16 | 11.0% |
| Communications | 0 | 0.0% |
| Arts & Humanities | 20 | 13.7% |
| Total | 146 | 100.0% |
Transportation & Commute in Merriam Woods
Vehicle Availability by Sex in Merriam Woods
The most prevalent vehicle ownership categories in Merriam Woods are males with 2 vehicles (166, accounting for 33.5%) and females with 2 vehicles (128, making up 38.9%).
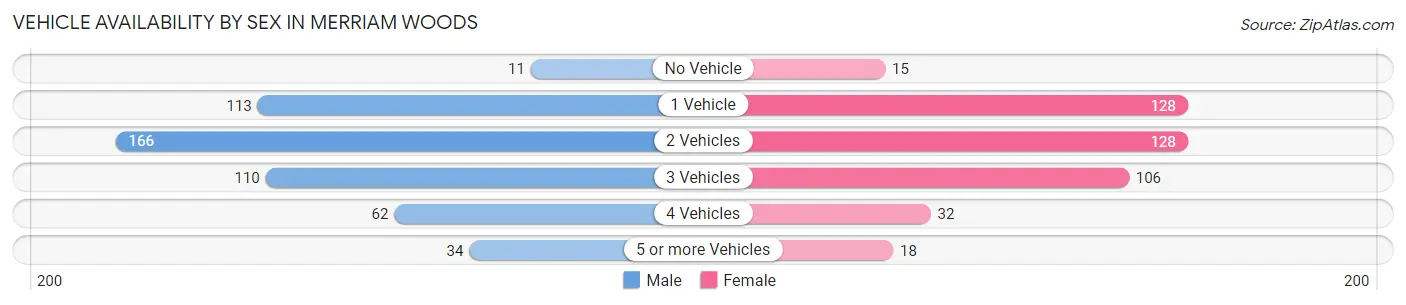
| Vehicles Available | Male | Female |
| No Vehicle | 11 (2.2%) | 15 (3.5%) |
| 1 Vehicle | 113 (22.8%) | 128 (30.0%) |
| 2 Vehicles | 166 (33.5%) | 128 (30.0%) |
| 3 Vehicles | 110 (22.2%) | 106 (24.8%) |
| 4 Vehicles | 62 (12.5%) | 32 (7.5%) |
| 5 or more Vehicles | 34 (6.9%) | 18 (4.2%) |
| Total | 496 (100.0%) | 427 (100.0%) |
Commute Time in Merriam Woods
The most frequently occuring commute durations in Merriam Woods are 20 to 24 minutes (277 commuters, 30.8%), 15 to 19 minutes (233 commuters, 25.9%), and 10 to 14 minutes (64 commuters, 7.1%).
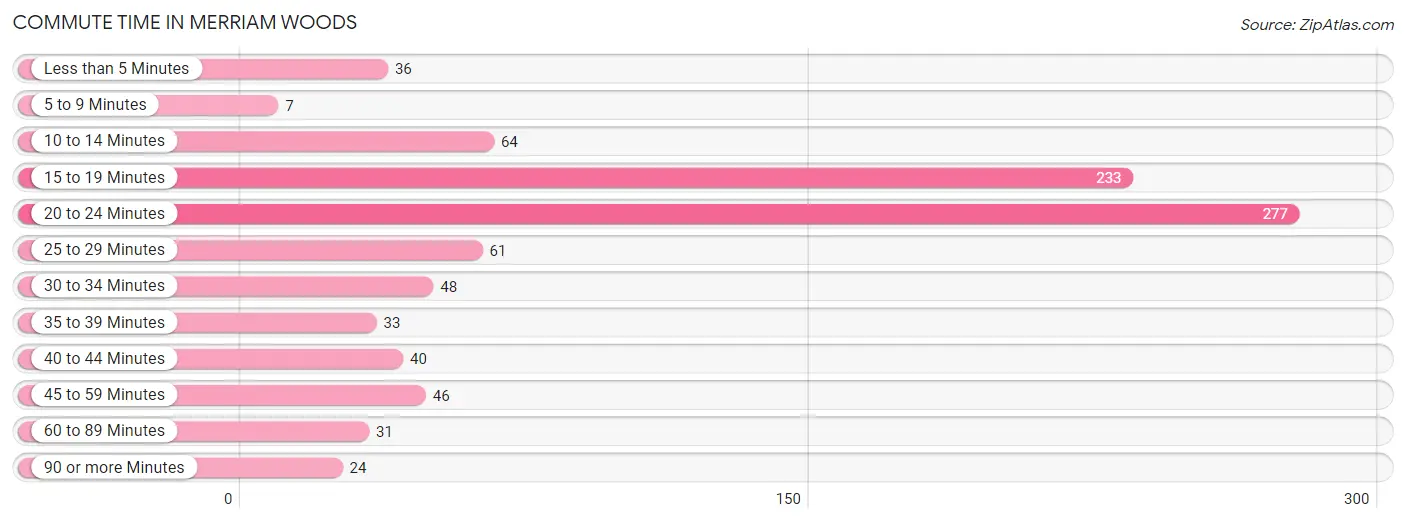
| Commute Time | # Commuters | % Commuters |
| Less than 5 Minutes | 36 | 4.0% |
| 5 to 9 Minutes | 7 | 0.8% |
| 10 to 14 Minutes | 64 | 7.1% |
| 15 to 19 Minutes | 233 | 25.9% |
| 20 to 24 Minutes | 277 | 30.8% |
| 25 to 29 Minutes | 61 | 6.8% |
| 30 to 34 Minutes | 48 | 5.3% |
| 35 to 39 Minutes | 33 | 3.7% |
| 40 to 44 Minutes | 40 | 4.4% |
| 45 to 59 Minutes | 46 | 5.1% |
| 60 to 89 Minutes | 31 | 3.4% |
| 90 or more Minutes | 24 | 2.7% |
Commute Time by Sex in Merriam Woods
The most common commute times in Merriam Woods are 15 to 19 minutes (135 commuters, 27.2%) for males and 20 to 24 minutes (142 commuters, 35.1%) for females.
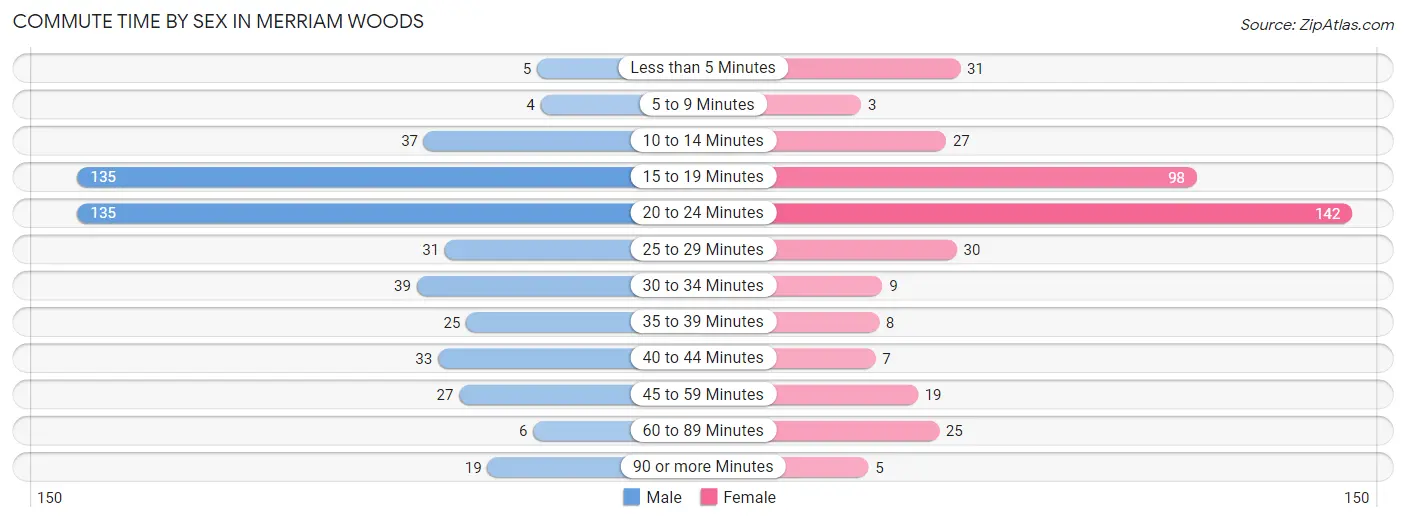
| Commute Time | Male | Female |
| Less than 5 Minutes | 5 (1.0%) | 31 (7.7%) |
| 5 to 9 Minutes | 4 (0.8%) | 3 (0.7%) |
| 10 to 14 Minutes | 37 (7.5%) | 27 (6.7%) |
| 15 to 19 Minutes | 135 (27.2%) | 98 (24.3%) |
| 20 to 24 Minutes | 135 (27.2%) | 142 (35.1%) |
| 25 to 29 Minutes | 31 (6.2%) | 30 (7.4%) |
| 30 to 34 Minutes | 39 (7.9%) | 9 (2.2%) |
| 35 to 39 Minutes | 25 (5.0%) | 8 (2.0%) |
| 40 to 44 Minutes | 33 (6.7%) | 7 (1.7%) |
| 45 to 59 Minutes | 27 (5.4%) | 19 (4.7%) |
| 60 to 89 Minutes | 6 (1.2%) | 25 (6.2%) |
| 90 or more Minutes | 19 (3.8%) | 5 (1.2%) |
Time of Departure to Work by Sex in Merriam Woods
The most frequent times of departure to work in Merriam Woods are 6:00 AM to 6:29 AM (95, 19.2%) for males and 7:30 AM to 7:59 AM (115, 28.5%) for females.
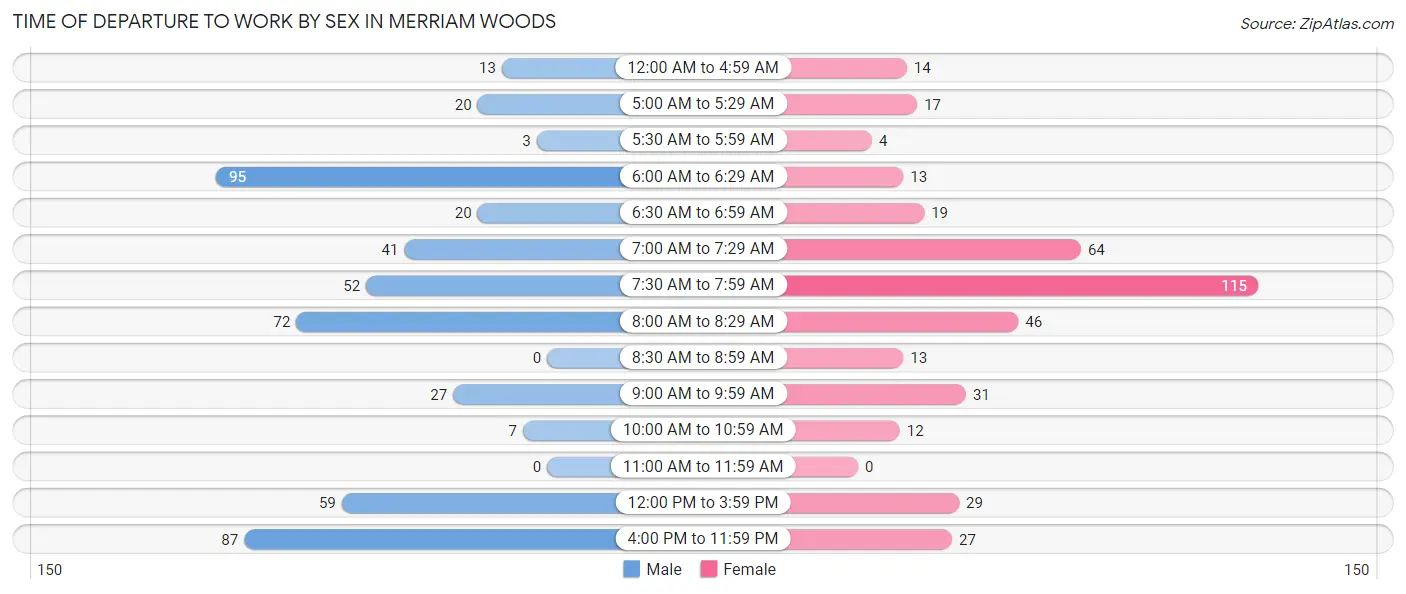
| Time of Departure | Male | Female |
| 12:00 AM to 4:59 AM | 13 (2.6%) | 14 (3.5%) |
| 5:00 AM to 5:29 AM | 20 (4.0%) | 17 (4.2%) |
| 5:30 AM to 5:59 AM | 3 (0.6%) | 4 (1.0%) |
| 6:00 AM to 6:29 AM | 95 (19.2%) | 13 (3.2%) |
| 6:30 AM to 6:59 AM | 20 (4.0%) | 19 (4.7%) |
| 7:00 AM to 7:29 AM | 41 (8.3%) | 64 (15.8%) |
| 7:30 AM to 7:59 AM | 52 (10.5%) | 115 (28.5%) |
| 8:00 AM to 8:29 AM | 72 (14.5%) | 46 (11.4%) |
| 8:30 AM to 8:59 AM | 0 (0.0%) | 13 (3.2%) |
| 9:00 AM to 9:59 AM | 27 (5.4%) | 31 (7.7%) |
| 10:00 AM to 10:59 AM | 7 (1.4%) | 12 (3.0%) |
| 11:00 AM to 11:59 AM | 0 (0.0%) | 0 (0.0%) |
| 12:00 PM to 3:59 PM | 59 (11.9%) | 29 (7.2%) |
| 4:00 PM to 11:59 PM | 87 (17.5%) | 27 (6.7%) |
| Total | 496 (100.0%) | 404 (100.0%) |
Housing Occupancy in Merriam Woods
Occupancy by Ownership in Merriam Woods
Of the total 634 dwellings in Merriam Woods, owner-occupied units account for 490 (77.3%), while renter-occupied units make up 144 (22.7%).
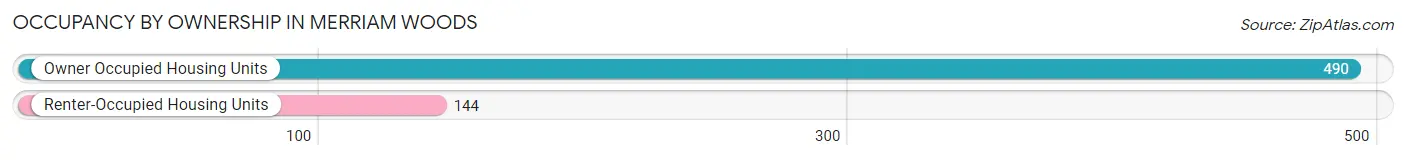
| Occupancy | # Housing Units | % Housing Units |
| Owner Occupied Housing Units | 490 | 77.3% |
| Renter-Occupied Housing Units | 144 | 22.7% |
| Total Occupied Housing Units | 634 | 100.0% |
Occupancy by Household Size in Merriam Woods
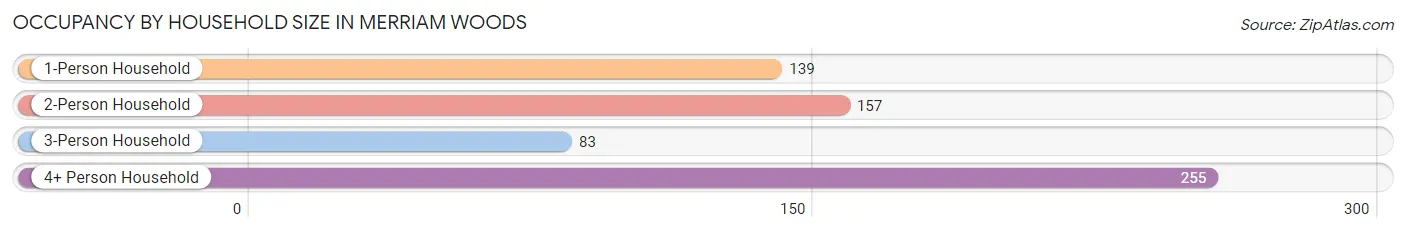
| Household Size | # Housing Units | % Housing Units |
| 1-Person Household | 139 | 21.9% |
| 2-Person Household | 157 | 24.8% |
| 3-Person Household | 83 | 13.1% |
| 4+ Person Household | 255 | 40.2% |
| Total Housing Units | 634 | 100.0% |
Occupancy by Ownership by Household Size in Merriam Woods
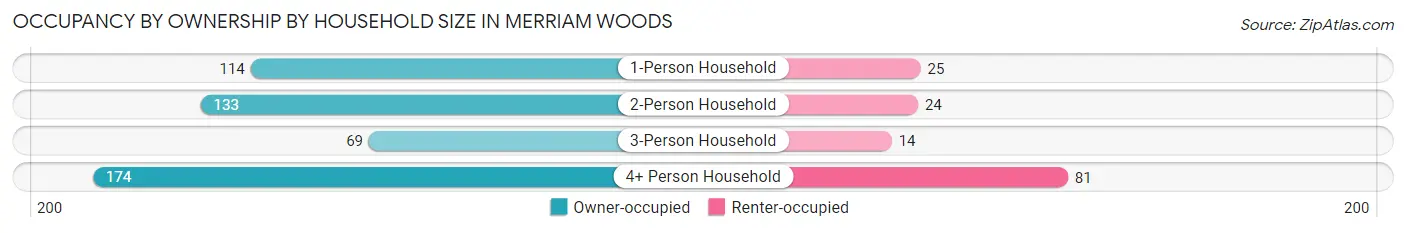
| Household Size | Owner-occupied | Renter-occupied |
| 1-Person Household | 114 (82.0%) | 25 (18.0%) |
| 2-Person Household | 133 (84.7%) | 24 (15.3%) |
| 3-Person Household | 69 (83.1%) | 14 (16.9%) |
| 4+ Person Household | 174 (68.2%) | 81 (31.8%) |
| Total Housing Units | 490 (77.3%) | 144 (22.7%) |
Occupancy by Educational Attainment in Merriam Woods
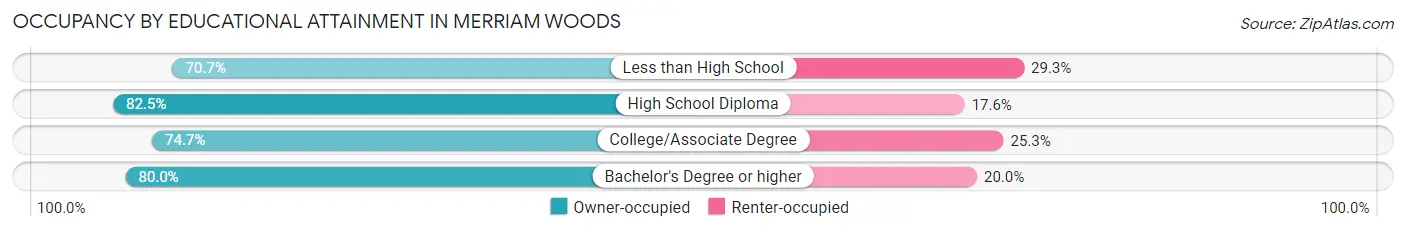
| Household Size | Owner-occupied | Renter-occupied |
| Less than High School | 53 (70.7%) | 22 (29.3%) |
| High School Diploma | 155 (82.5%) | 33 (17.5%) |
| College/Associate Degree | 210 (74.7%) | 71 (25.3%) |
| Bachelor's Degree or higher | 72 (80.0%) | 18 (20.0%) |
Occupancy by Age of Householder in Merriam Woods
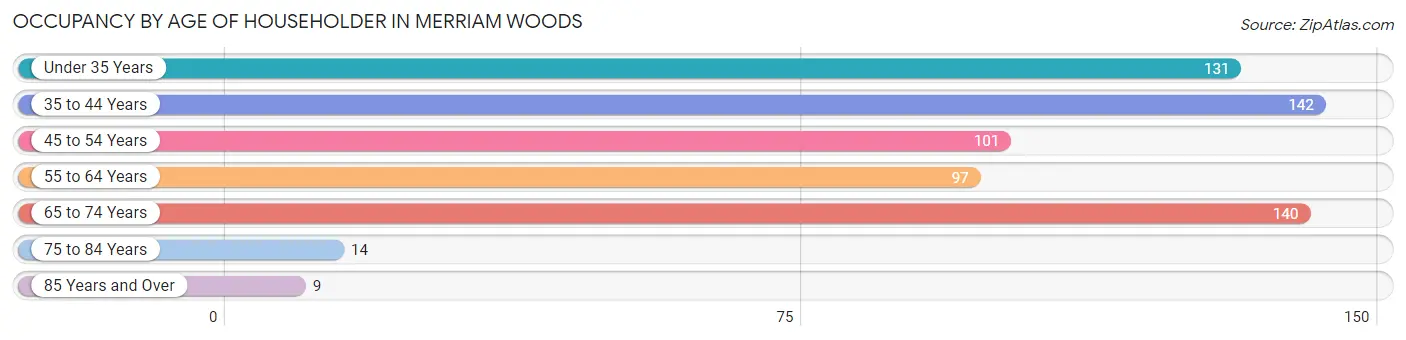
| Age Bracket | # Households | % Households |
| Under 35 Years | 131 | 20.7% |
| 35 to 44 Years | 142 | 22.4% |
| 45 to 54 Years | 101 | 15.9% |
| 55 to 64 Years | 97 | 15.3% |
| 65 to 74 Years | 140 | 22.1% |
| 75 to 84 Years | 14 | 2.2% |
| 85 Years and Over | 9 | 1.4% |
| Total | 634 | 100.0% |
Housing Finances in Merriam Woods
Median Income by Occupancy in Merriam Woods
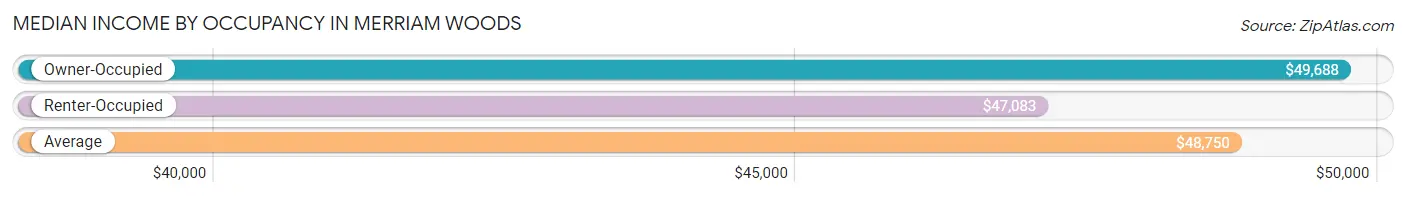
| Occupancy Type | # Households | Median Income |
| Owner-Occupied | 490 (77.3%) | $49,688 |
| Renter-Occupied | 144 (22.7%) | $47,083 |
| Average | 634 (100.0%) | $48,750 |
Occupancy by Householder Income Bracket in Merriam Woods
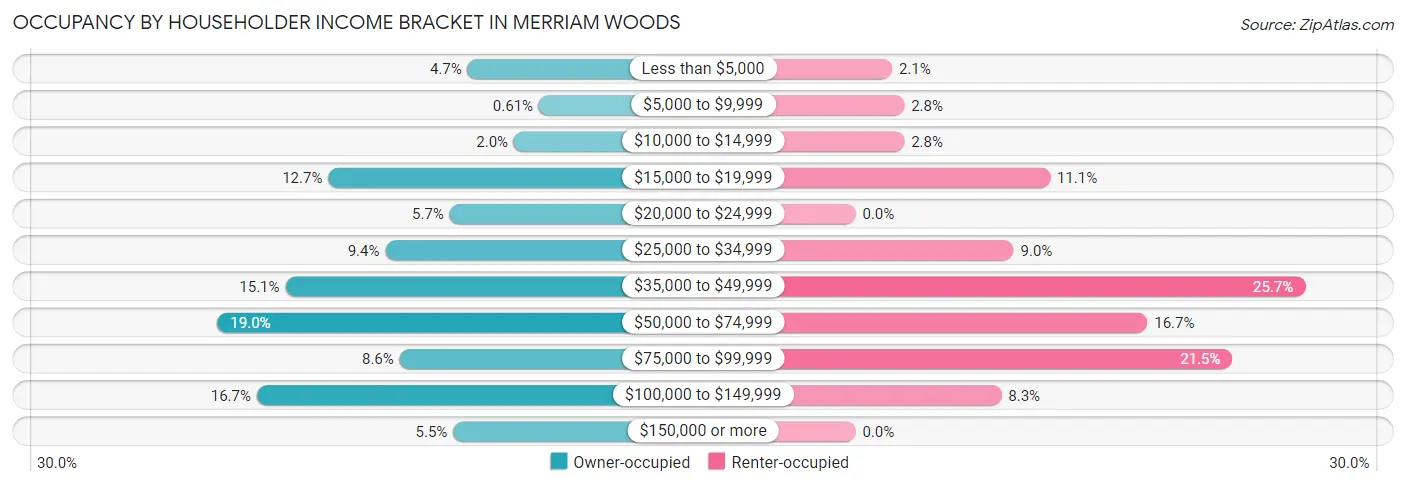
| Income Bracket | Owner-occupied | Renter-occupied |
| Less than $5,000 | 23 (4.7%) | 3 (2.1%) |
| $5,000 to $9,999 | 3 (0.6%) | 4 (2.8%) |
| $10,000 to $14,999 | 10 (2.0%) | 4 (2.8%) |
| $15,000 to $19,999 | 62 (12.7%) | 16 (11.1%) |
| $20,000 to $24,999 | 28 (5.7%) | 0 (0.0%) |
| $25,000 to $34,999 | 46 (9.4%) | 13 (9.0%) |
| $35,000 to $49,999 | 74 (15.1%) | 37 (25.7%) |
| $50,000 to $74,999 | 93 (19.0%) | 24 (16.7%) |
| $75,000 to $99,999 | 42 (8.6%) | 31 (21.5%) |
| $100,000 to $149,999 | 82 (16.7%) | 12 (8.3%) |
| $150,000 or more | 27 (5.5%) | 0 (0.0%) |
| Total | 490 (100.0%) | 144 (100.0%) |
Monthly Housing Cost Tiers in Merriam Woods
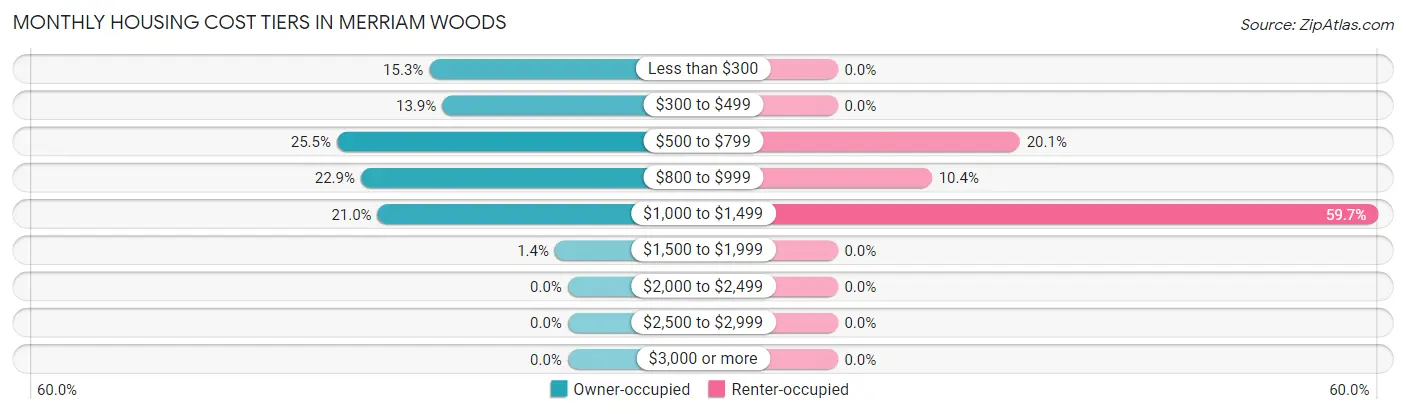
| Monthly Cost | Owner-occupied | Renter-occupied |
| Less than $300 | 75 (15.3%) | 0 (0.0%) |
| $300 to $499 | 68 (13.9%) | 0 (0.0%) |
| $500 to $799 | 125 (25.5%) | 29 (20.1%) |
| $800 to $999 | 112 (22.9%) | 15 (10.4%) |
| $1,000 to $1,499 | 103 (21.0%) | 86 (59.7%) |
| $1,500 to $1,999 | 7 (1.4%) | 0 (0.0%) |
| $2,000 to $2,499 | 0 (0.0%) | 0 (0.0%) |
| $2,500 to $2,999 | 0 (0.0%) | 0 (0.0%) |
| $3,000 or more | 0 (0.0%) | 0 (0.0%) |
| Total | 490 (100.0%) | 144 (100.0%) |
Physical Housing Characteristics in Merriam Woods
Housing Structures in Merriam Woods
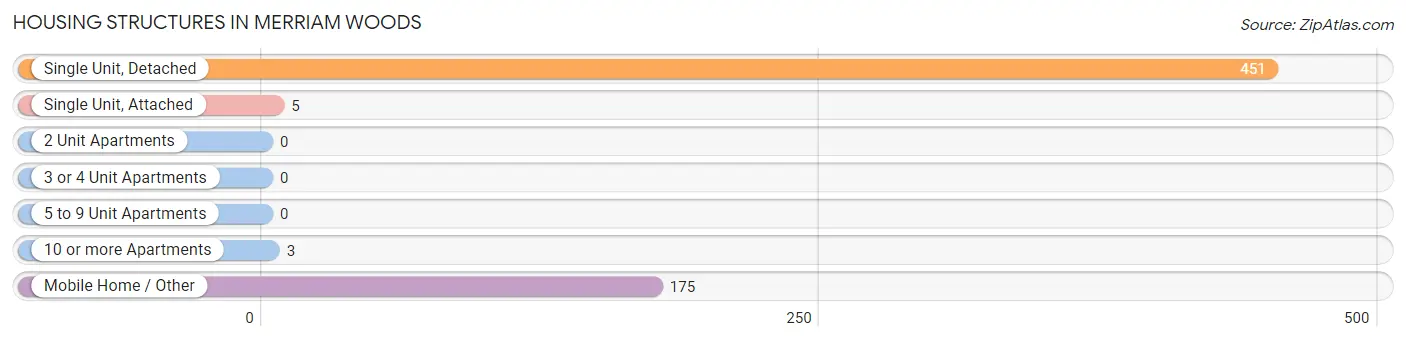
| Structure Type | # Housing Units | % Housing Units |
| Single Unit, Detached | 451 | 71.1% |
| Single Unit, Attached | 5 | 0.8% |
| 2 Unit Apartments | 0 | 0.0% |
| 3 or 4 Unit Apartments | 0 | 0.0% |
| 5 to 9 Unit Apartments | 0 | 0.0% |
| 10 or more Apartments | 3 | 0.5% |
| Mobile Home / Other | 175 | 27.6% |
| Total | 634 | 100.0% |
Housing Structures by Occupancy in Merriam Woods
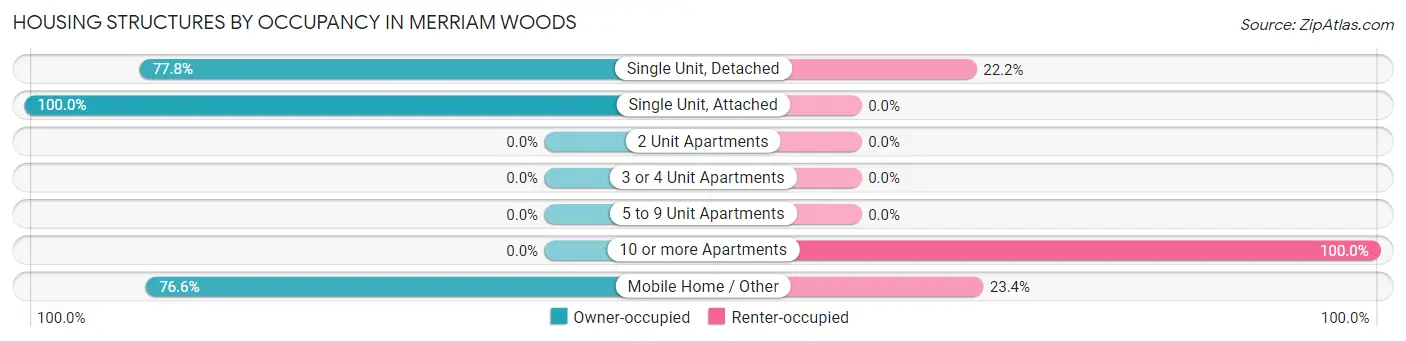
| Structure Type | Owner-occupied | Renter-occupied |
| Single Unit, Detached | 351 (77.8%) | 100 (22.2%) |
| Single Unit, Attached | 5 (100.0%) | 0 (0.0%) |
| 2 Unit Apartments | 0 (0.0%) | 0 (0.0%) |
| 3 or 4 Unit Apartments | 0 (0.0%) | 0 (0.0%) |
| 5 to 9 Unit Apartments | 0 (0.0%) | 0 (0.0%) |
| 10 or more Apartments | 0 (0.0%) | 3 (100.0%) |
| Mobile Home / Other | 134 (76.6%) | 41 (23.4%) |
| Total | 490 (77.3%) | 144 (22.7%) |
Housing Structures by Number of Rooms in Merriam Woods
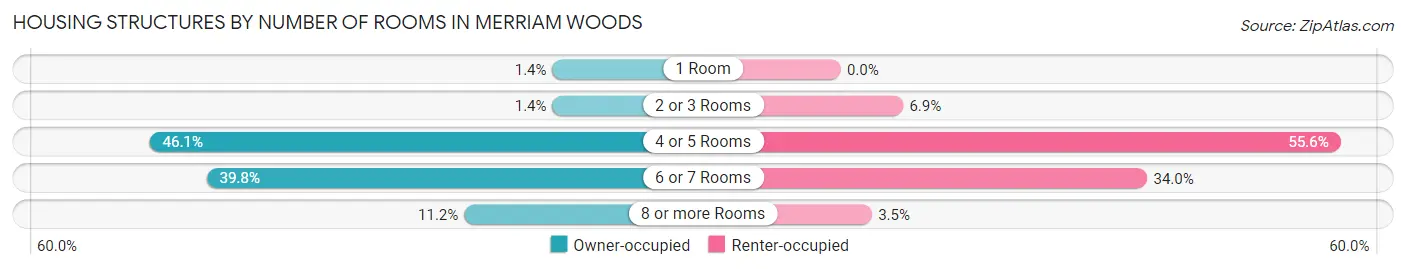
| Number of Rooms | Owner-occupied | Renter-occupied |
| 1 Room | 7 (1.4%) | 0 (0.0%) |
| 2 or 3 Rooms | 7 (1.4%) | 10 (6.9%) |
| 4 or 5 Rooms | 226 (46.1%) | 80 (55.6%) |
| 6 or 7 Rooms | 195 (39.8%) | 49 (34.0%) |
| 8 or more Rooms | 55 (11.2%) | 5 (3.5%) |
| Total | 490 (100.0%) | 144 (100.0%) |
Housing Structure by Heating Type in Merriam Woods
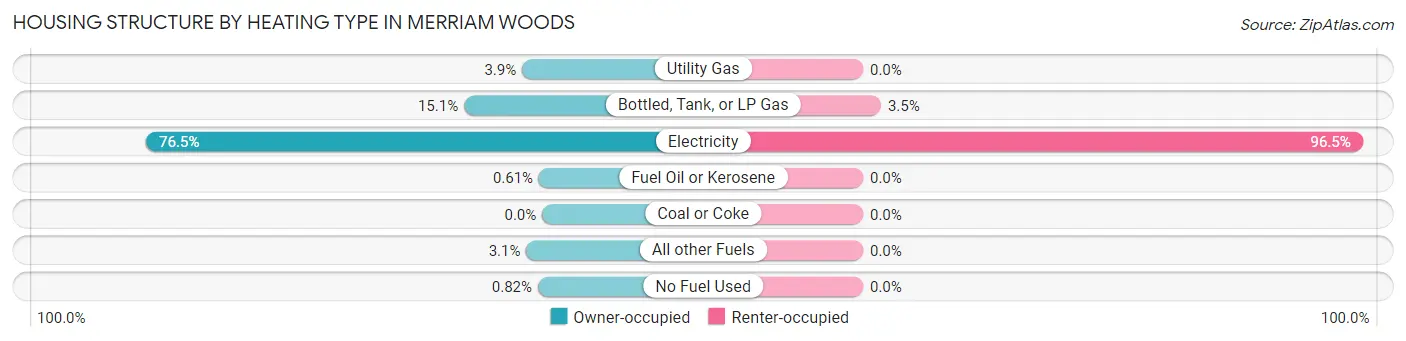
| Heating Type | Owner-occupied | Renter-occupied |
| Utility Gas | 19 (3.9%) | 0 (0.0%) |
| Bottled, Tank, or LP Gas | 74 (15.1%) | 5 (3.5%) |
| Electricity | 375 (76.5%) | 139 (96.5%) |
| Fuel Oil or Kerosene | 3 (0.6%) | 0 (0.0%) |
| Coal or Coke | 0 (0.0%) | 0 (0.0%) |
| All other Fuels | 15 (3.1%) | 0 (0.0%) |
| No Fuel Used | 4 (0.8%) | 0 (0.0%) |
| Total | 490 (100.0%) | 144 (100.0%) |
Household Vehicle Usage in Merriam Woods
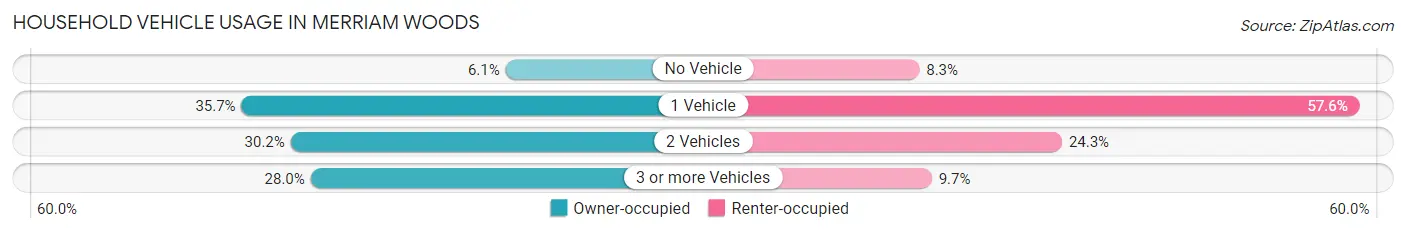
| Vehicles per Household | Owner-occupied | Renter-occupied |
| No Vehicle | 30 (6.1%) | 12 (8.3%) |
| 1 Vehicle | 175 (35.7%) | 83 (57.6%) |
| 2 Vehicles | 148 (30.2%) | 35 (24.3%) |
| 3 or more Vehicles | 137 (28.0%) | 14 (9.7%) |
| Total | 490 (100.0%) | 144 (100.0%) |
Real Estate & Mortgages in Merriam Woods
Real Estate and Mortgage Overview in Merriam Woods
| Characteristic | Without Mortgage | With Mortgage |
| Housing Units | 190 | 300 |
| Median Property Value | $68,000 | $109,700 |
| Median Household Income | $55,556 | $24 |
| Monthly Housing Costs | $366 | $0 |
| Real Estate Taxes | $712 | $5 |
Property Value by Mortgage Status in Merriam Woods
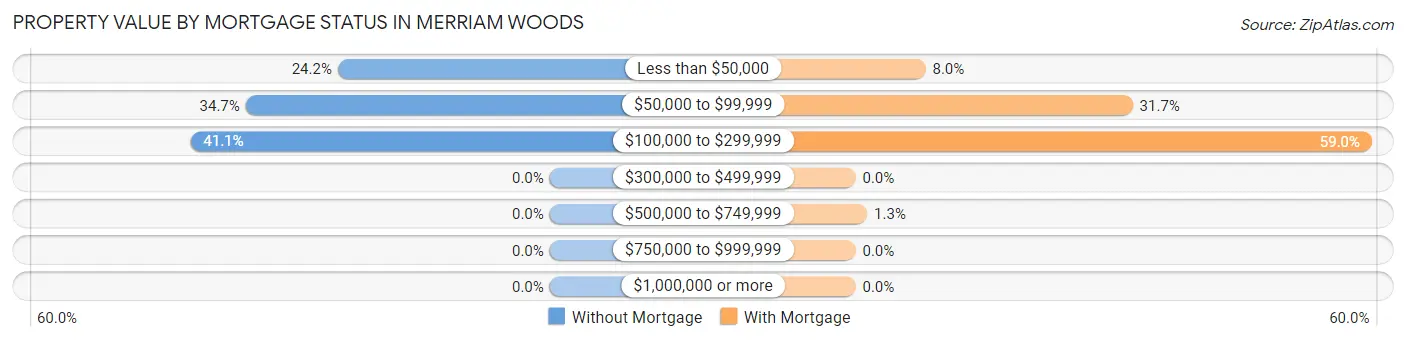
| Property Value | Without Mortgage | With Mortgage |
| Less than $50,000 | 46 (24.2%) | 24 (8.0%) |
| $50,000 to $99,999 | 66 (34.7%) | 95 (31.7%) |
| $100,000 to $299,999 | 78 (41.0%) | 177 (59.0%) |
| $300,000 to $499,999 | 0 (0.0%) | 0 (0.0%) |
| $500,000 to $749,999 | 0 (0.0%) | 4 (1.3%) |
| $750,000 to $999,999 | 0 (0.0%) | 0 (0.0%) |
| $1,000,000 or more | 0 (0.0%) | 0 (0.0%) |
| Total | 190 (100.0%) | 300 (100.0%) |
Household Income by Mortgage Status in Merriam Woods
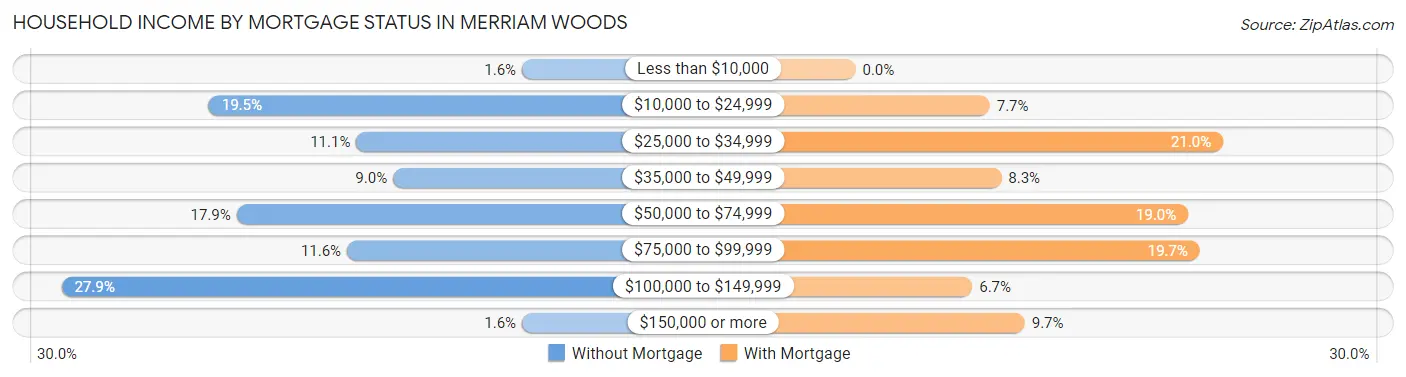
| Household Income | Without Mortgage | With Mortgage |
| Less than $10,000 | 3 (1.6%) | 0 (0.0%) |
| $10,000 to $24,999 | 37 (19.5%) | 23 (7.7%) |
| $25,000 to $34,999 | 21 (11.1%) | 63 (21.0%) |
| $35,000 to $49,999 | 17 (8.9%) | 25 (8.3%) |
| $50,000 to $74,999 | 34 (17.9%) | 57 (19.0%) |
| $75,000 to $99,999 | 22 (11.6%) | 59 (19.7%) |
| $100,000 to $149,999 | 53 (27.9%) | 20 (6.7%) |
| $150,000 or more | 3 (1.6%) | 29 (9.7%) |
| Total | 190 (100.0%) | 300 (100.0%) |
Property Value to Household Income Ratio in Merriam Woods
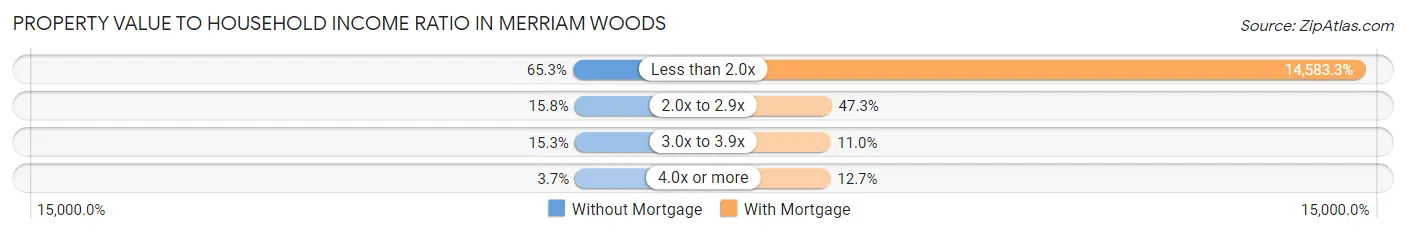
| Value-to-Income Ratio | Without Mortgage | With Mortgage |
| Less than 2.0x | 124 (65.3%) | 43,750 (14,583.3%) |
| 2.0x to 2.9x | 30 (15.8%) | 142 (47.3%) |
| 3.0x to 3.9x | 29 (15.3%) | 33 (11.0%) |
| 4.0x or more | 7 (3.7%) | 38 (12.7%) |
| Total | 190 (100.0%) | 300 (100.0%) |
Real Estate Taxes by Mortgage Status in Merriam Woods
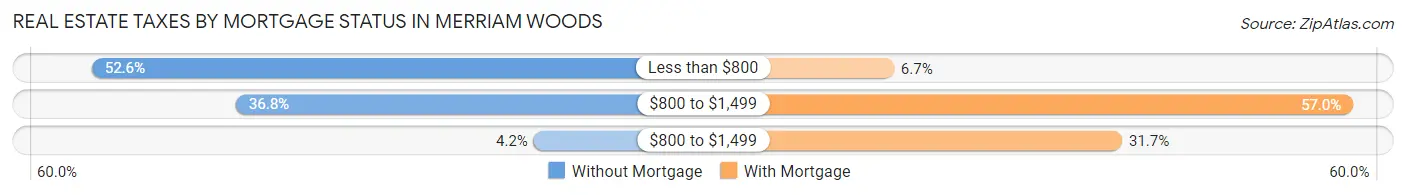
| Property Taxes | Without Mortgage | With Mortgage |
| Less than $800 | 100 (52.6%) | 20 (6.7%) |
| $800 to $1,499 | 70 (36.8%) | 171 (57.0%) |
| $800 to $1,499 | 8 (4.2%) | 95 (31.7%) |
| Total | 190 (100.0%) | 300 (100.0%) |
Health & Disability in Merriam Woods
Health Insurance Coverage by Age in Merriam Woods
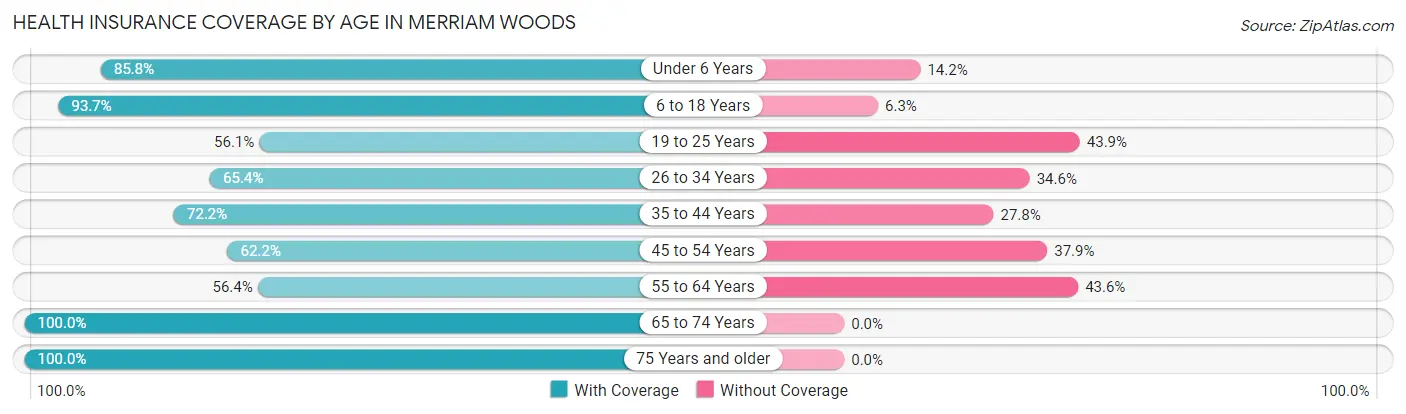
| Age Bracket | With Coverage | Without Coverage |
| Under 6 Years | 157 (85.8%) | 26 (14.2%) |
| 6 to 18 Years | 461 (93.7%) | 31 (6.3%) |
| 19 to 25 Years | 97 (56.1%) | 76 (43.9%) |
| 26 to 34 Years | 140 (65.4%) | 74 (34.6%) |
| 35 to 44 Years | 254 (72.2%) | 98 (27.8%) |
| 45 to 54 Years | 197 (62.2%) | 120 (37.9%) |
| 55 to 64 Years | 106 (56.4%) | 82 (43.6%) |
| 65 to 74 Years | 189 (100.0%) | 0 (0.0%) |
| 75 Years and older | 45 (100.0%) | 0 (0.0%) |
| Total | 1,646 (76.4%) | 507 (23.5%) |
Health Insurance Coverage by Citizenship Status in Merriam Woods
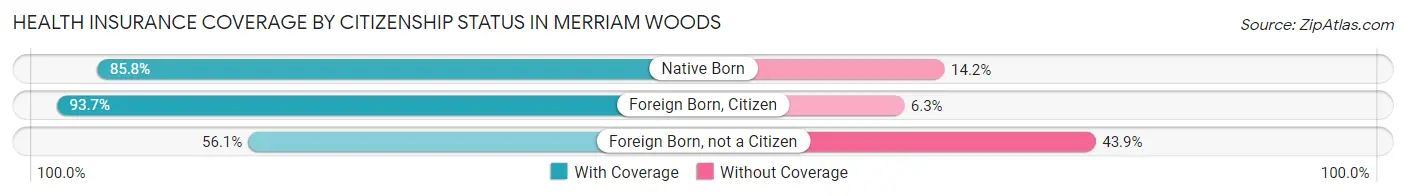
| Citizenship Status | With Coverage | Without Coverage |
| Native Born | 157 (85.8%) | 26 (14.2%) |
| Foreign Born, Citizen | 461 (93.7%) | 31 (6.3%) |
| Foreign Born, not a Citizen | 97 (56.1%) | 76 (43.9%) |
Health Insurance Coverage by Household Income in Merriam Woods
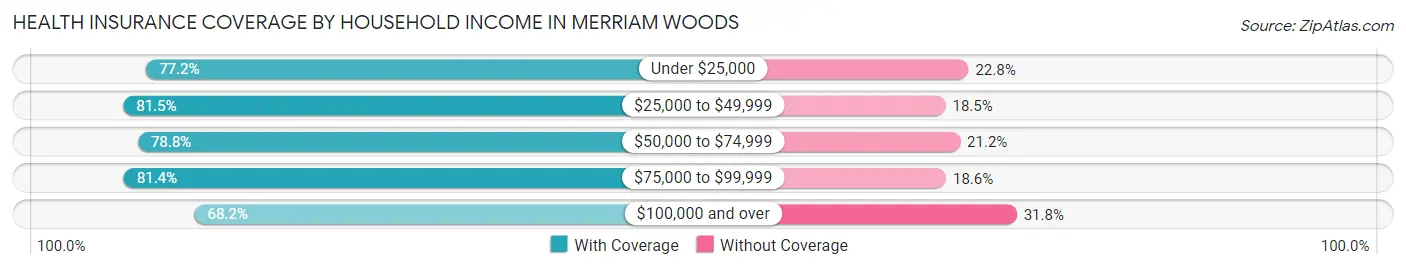
| Household Income | With Coverage | Without Coverage |
| Under $25,000 | 281 (77.2%) | 83 (22.8%) |
| $25,000 to $49,999 | 401 (81.5%) | 91 (18.5%) |
| $50,000 to $74,999 | 356 (78.8%) | 96 (21.2%) |
| $75,000 to $99,999 | 197 (81.4%) | 45 (18.6%) |
| $100,000 and over | 411 (68.2%) | 192 (31.8%) |
Public vs Private Health Insurance Coverage by Age in Merriam Woods
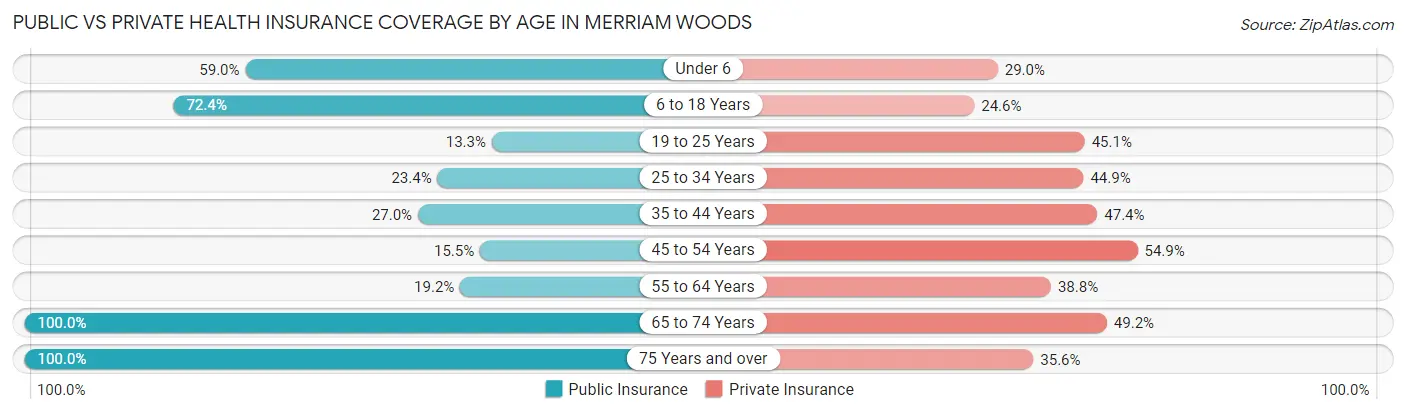
| Age Bracket | Public Insurance | Private Insurance |
| Under 6 | 108 (59.0%) | 53 (29.0%) |
| 6 to 18 Years | 356 (72.4%) | 121 (24.6%) |
| 19 to 25 Years | 23 (13.3%) | 78 (45.1%) |
| 25 to 34 Years | 50 (23.4%) | 96 (44.9%) |
| 35 to 44 Years | 95 (27.0%) | 167 (47.4%) |
| 45 to 54 Years | 49 (15.5%) | 174 (54.9%) |
| 55 to 64 Years | 36 (19.2%) | 73 (38.8%) |
| 65 to 74 Years | 189 (100.0%) | 93 (49.2%) |
| 75 Years and over | 45 (100.0%) | 16 (35.6%) |
| Total | 951 (44.2%) | 871 (40.5%) |
Disability Status by Sex by Age in Merriam Woods
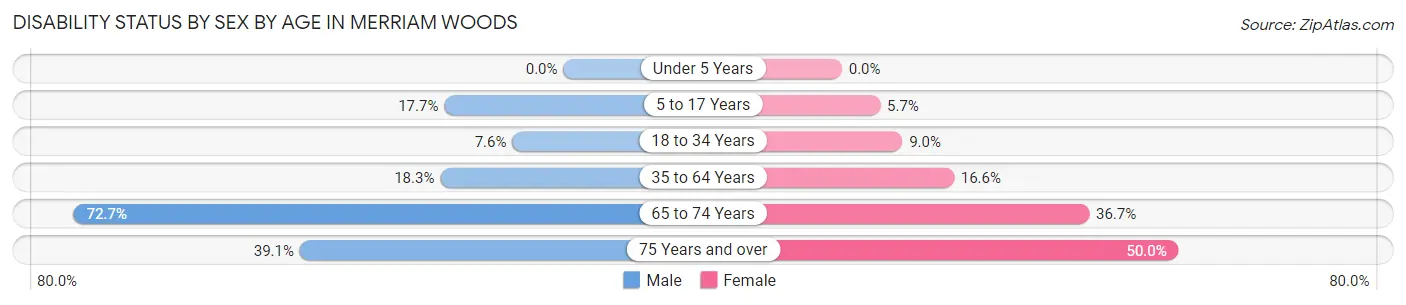
| Age Bracket | Male | Female |
| Under 5 Years | 0 (0.0%) | 0 (0.0%) |
| 5 to 17 Years | 49 (17.7%) | 12 (5.7%) |
| 18 to 34 Years | 15 (7.6%) | 20 (9.0%) |
| 35 to 64 Years | 83 (18.3%) | 67 (16.6%) |
| 65 to 74 Years | 80 (72.7%) | 29 (36.7%) |
| 75 Years and over | 9 (39.1%) | 11 (50.0%) |
Disability Class by Sex by Age in Merriam Woods
Disability Class: Hearing Difficulty
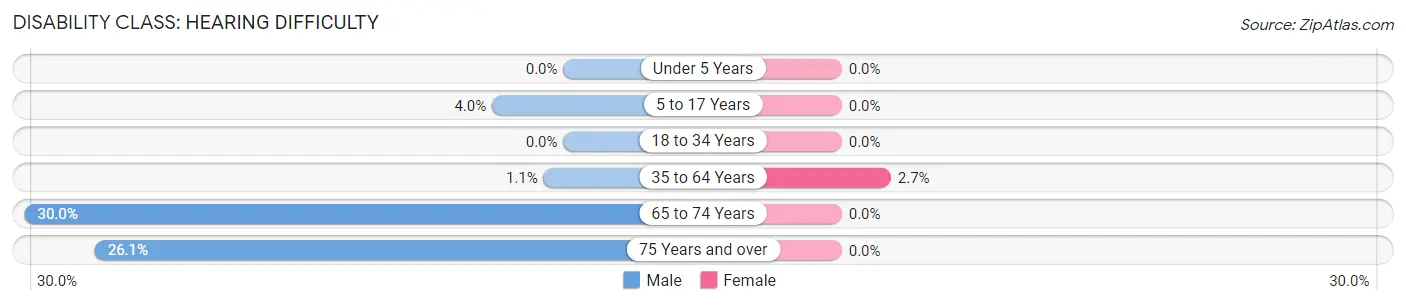
| Age Bracket | Male | Female |
| Under 5 Years | 0 (0.0%) | 0 (0.0%) |
| 5 to 17 Years | 11 (4.0%) | 0 (0.0%) |
| 18 to 34 Years | 0 (0.0%) | 0 (0.0%) |
| 35 to 64 Years | 5 (1.1%) | 11 (2.7%) |
| 65 to 74 Years | 33 (30.0%) | 0 (0.0%) |
| 75 Years and over | 6 (26.1%) | 0 (0.0%) |
Disability Class: Vision Difficulty
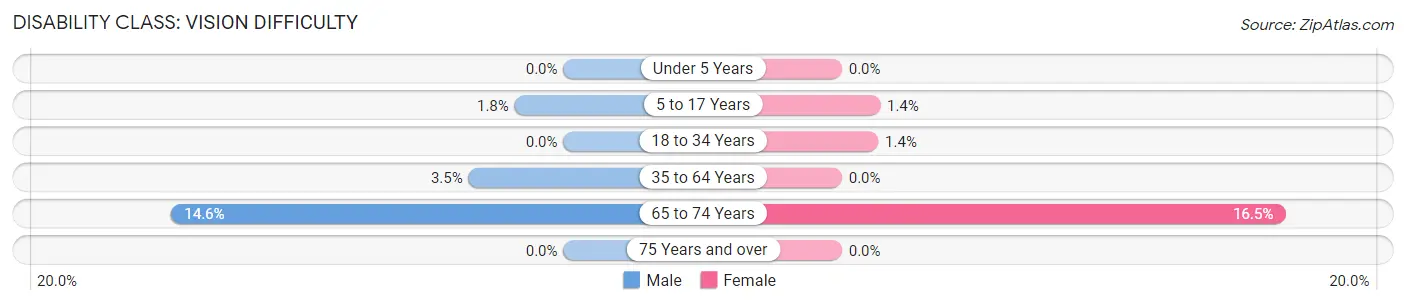
| Age Bracket | Male | Female |
| Under 5 Years | 0 (0.0%) | 0 (0.0%) |
| 5 to 17 Years | 5 (1.8%) | 3 (1.4%) |
| 18 to 34 Years | 0 (0.0%) | 3 (1.3%) |
| 35 to 64 Years | 16 (3.5%) | 0 (0.0%) |
| 65 to 74 Years | 16 (14.5%) | 13 (16.5%) |
| 75 Years and over | 0 (0.0%) | 0 (0.0%) |
Disability Class: Cognitive Difficulty
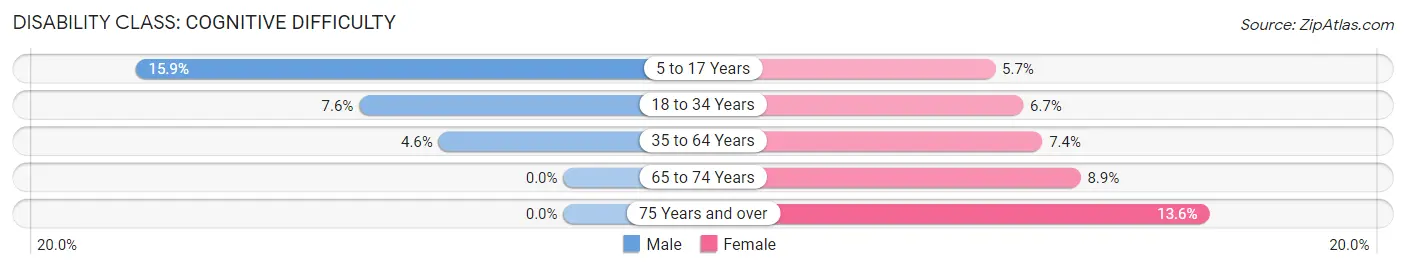
| Age Bracket | Male | Female |
| 5 to 17 Years | 44 (15.9%) | 12 (5.7%) |
| 18 to 34 Years | 15 (7.6%) | 15 (6.7%) |
| 35 to 64 Years | 21 (4.6%) | 30 (7.4%) |
| 65 to 74 Years | 0 (0.0%) | 7 (8.9%) |
| 75 Years and over | 0 (0.0%) | 3 (13.6%) |
Disability Class: Ambulatory Difficulty
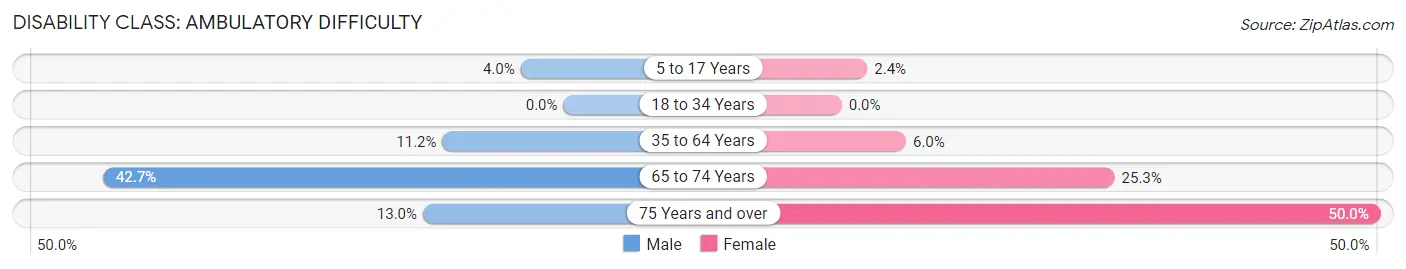
| Age Bracket | Male | Female |
| 5 to 17 Years | 11 (4.0%) | 5 (2.4%) |
| 18 to 34 Years | 0 (0.0%) | 0 (0.0%) |
| 35 to 64 Years | 51 (11.2%) | 24 (6.0%) |
| 65 to 74 Years | 47 (42.7%) | 20 (25.3%) |
| 75 Years and over | 3 (13.0%) | 11 (50.0%) |
Disability Class: Self-Care Difficulty
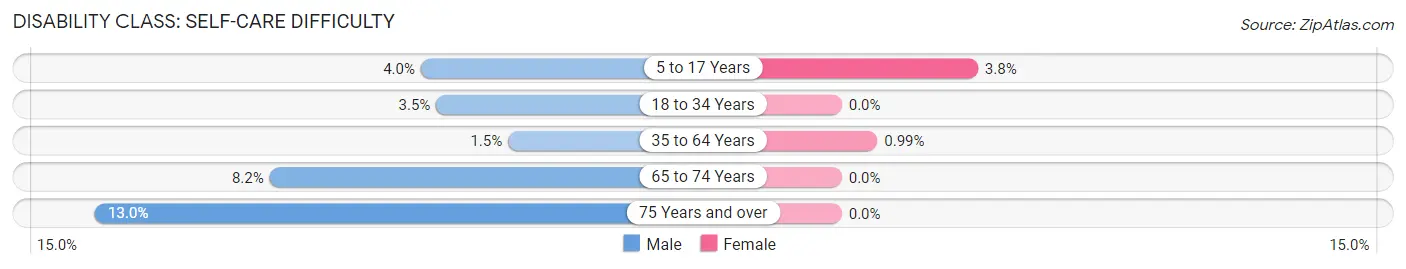
| Age Bracket | Male | Female |
| 5 to 17 Years | 11 (4.0%) | 8 (3.8%) |
| 18 to 34 Years | 7 (3.5%) | 0 (0.0%) |
| 35 to 64 Years | 7 (1.5%) | 4 (1.0%) |
| 65 to 74 Years | 9 (8.2%) | 0 (0.0%) |
| 75 Years and over | 3 (13.0%) | 0 (0.0%) |
Technology Access in Merriam Woods
Computing Device Access in Merriam Woods
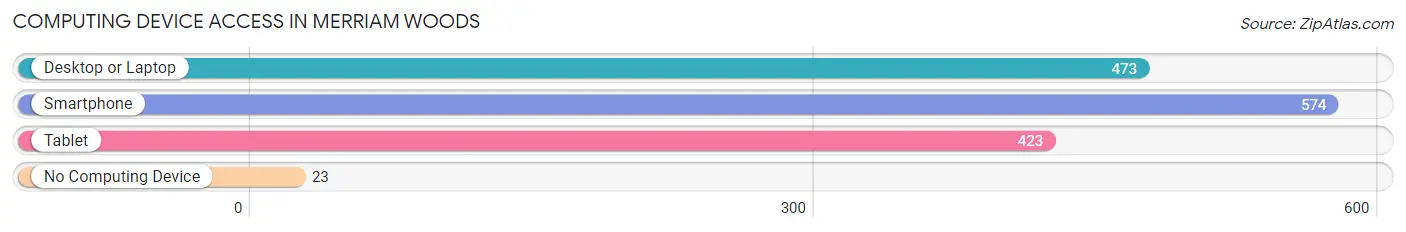
| Device Type | # Households | % Households |
| Desktop or Laptop | 473 | 74.6% |
| Smartphone | 574 | 90.5% |
| Tablet | 423 | 66.7% |
| No Computing Device | 23 | 3.6% |
| Total | 634 | 100.0% |
Internet Access in Merriam Woods
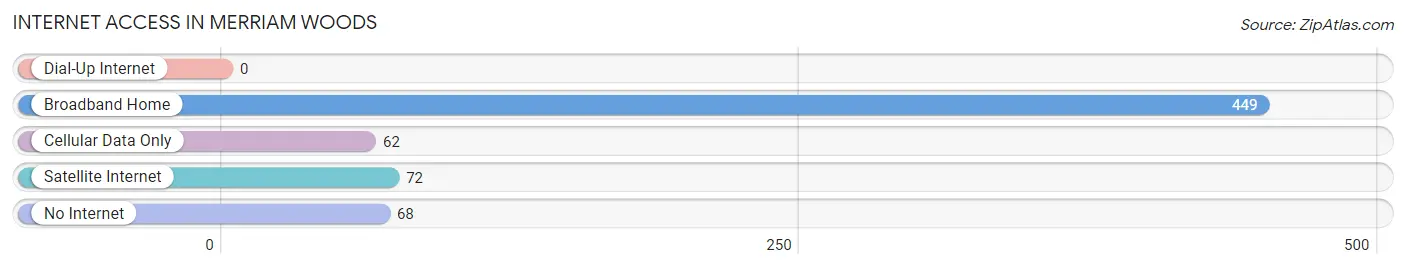
| Internet Type | # Households | % Households |
| Dial-Up Internet | 0 | 0.0% |
| Broadband Home | 449 | 70.8% |
| Cellular Data Only | 62 | 9.8% |
| Satellite Internet | 72 | 11.4% |
| No Internet | 68 | 10.7% |
| Total | 634 | 100.0% |
Merriam Woods Summary
Merriam Woods is a small unincorporated community located in Stone County, Missouri. It is situated in the Ozark Mountains, approximately 10 miles south of Branson, Missouri. The population of Merriam Woods was estimated to be around 1,000 in 2020.
History
Merriam Woods was founded in the late 1800s by a man named William Merriam. He was a farmer and a blacksmith who moved to the area from Tennessee. He built a small cabin and began farming the land. He also built a blacksmith shop and a general store. The community was named after him.
In the early 1900s, the community began to grow as more people moved to the area. The first school was built in 1910 and the first post office was established in 1912. The community also had a church, a grist mill, and a sawmill.
In the 1920s, the community began to decline as the population moved away to larger cities. The post office closed in the 1930s and the school closed in the 1940s. The community was mostly abandoned by the 1950s.
Geography
Merriam Woods is located in the Ozark Mountains of southwestern Missouri. It is situated in Stone County, approximately 10 miles south of Branson. The community is located on the banks of the White River, which is a tributary of the James River.
The terrain of the area is mostly hilly and forested. The climate is humid subtropical, with hot summers and mild winters. The average annual temperature is around 60 degrees Fahrenheit.
Economy
The economy of Merriam Woods is largely based on tourism. The community is located near several popular tourist attractions, including Silver Dollar City and Table Rock Lake. The area also has several wineries and vineyards, as well as several golf courses.
The community also has several small businesses, including a general store, a gas station, and a few restaurants. There are also several bed and breakfasts in the area.
Demographics
The population of Merriam Woods was estimated to be around 1,000 in 2020. The racial makeup of the community is mostly white (95%), with a small percentage of African Americans (2%) and Native Americans (1%). The median household income is around $35,000. The median age is around 40 years old.
Conclusion
Merriam Woods is a small unincorporated community located in Stone County, Missouri. It is situated in the Ozark Mountains, approximately 10 miles south of Branson, Missouri. The population of Merriam Woods was estimated to be around 1,000 in 2020. The economy of the community is largely based on tourism, with several small businesses and bed and breakfasts in the area. The racial makeup of the community is mostly white, with a small percentage of African Americans and Native Americans. The median household income is around $35,000 and the median age is around 40 years old.
Common Questions
What is the Total Population of Merriam Woods?
Total Population of Merriam Woods is 2,153.
What is the Total Male Population of Merriam Woods?
Total Male Population of Merriam Woods is 1,123.
What is the Total Female Population of Merriam Woods?
Total Female Population of Merriam Woods is 1,030.
What is the Ratio of Males per 100 Females in Merriam Woods?
There are 109.03 Males per 100 Females in Merriam Woods.
What is the Ratio of Females per 100 Males in Merriam Woods?
There are 91.72 Females per 100 Males in Merriam Woods.
What is the Median Population Age in Merriam Woods?
Median Population Age in Merriam Woods is 35.3 Years.
What is the Average Family Size in Merriam Woods
Average Family Size in Merriam Woods is 4.0 People.
What is the Average Household Size in Merriam Woods
Average Household Size in Merriam Woods is 3.4 People.
What is Per Capita Income in Merriam Woods?
Per Capita income in Merriam Woods is $19,878.
What is the Median Family Income in Merriam Woods?
Median Family Income in Merriam Woods is $50,250.
What is the Median Household income in Merriam Woods?
Median Household Income in Merriam Woods is $48,750.
What is Income or Wage Gap in Merriam Woods?
Income or Wage Gap in Merriam Woods is 32.0%.
Women in Merriam Woods earn 68.0 cents for every dollar earned by a man.
What is Inequality or Gini Index in Merriam Woods?
Inequality or Gini Index in Merriam Woods is 0.40.
How Large is the Labor Force in Merriam Woods?
There are 1,089 People in the Labor Forcein in Merriam Woods.
What is the Percentage of People in the Labor Force in Merriam Woods?
67.2% of People are in the Labor Force in Merriam Woods.
What is the Unemployment Rate in Merriam Woods?
Unemployment Rate in Merriam Woods is 12.5%.