Ste Genevieve, MO
Ste Genevieve Map
Ste Genevieve Overview
4,965
TOTAL POPULATION
2,603
MALE POPULATION
2,362
FEMALE POPULATION
110.20
MALES / 100 FEMALES
90.74
FEMALES / 100 MALES
43.6
MEDIAN AGE
2.9
AVG FAMILY SIZE
2.4
AVG HOUSEHOLD SIZE
$27,084
PER CAPITA INCOME
$68,169
AVG FAMILY INCOME
$52,760
AVG HOUSEHOLD INCOME
30.5%
WAGE / INCOME GAP [ % ]
69.5¢/ $1
WAGE / INCOME GAP [ $ ]
0.41
INEQUALITY / GINI INDEX
2,134
LABOR FORCE [ PEOPLE ]
52.1%
PERCENT IN LABOR FORCE
6.1%
UNEMPLOYMENT RATE
Ste Genevieve Area Codes
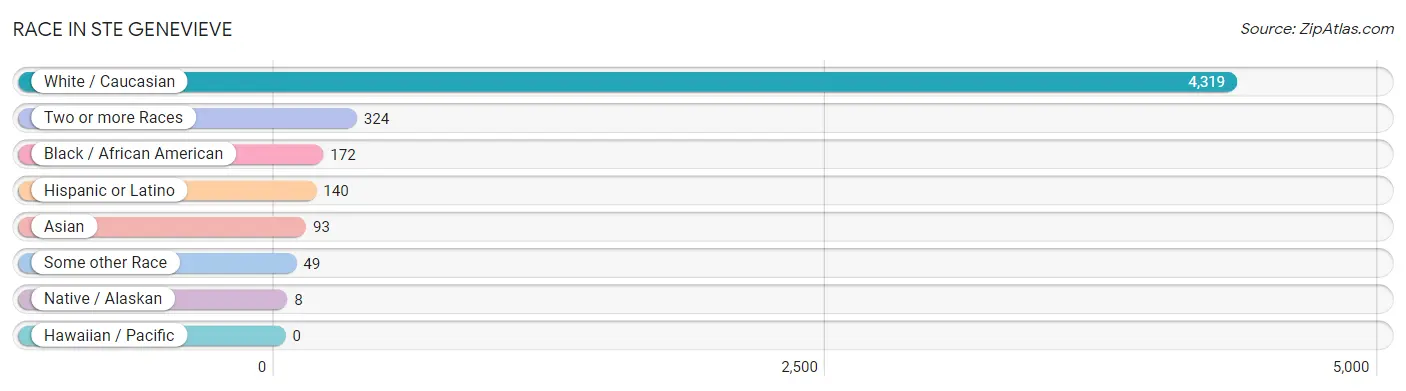
Race in Ste Genevieve
The most populous races in Ste Genevieve are White / Caucasian (4,319 | 87.0%), Two or more Races (324 | 6.5%), and Black / African American (172 | 3.5%).
| Race | # Population | % Population |
| Asian | 93 | 1.9% |
| Black / African American | 172 | 3.5% |
| Hawaiian / Pacific | 0 | 0.0% |
| Hispanic or Latino | 140 | 2.8% |
| Native / Alaskan | 8 | 0.2% |
| White / Caucasian | 4,319 | 87.0% |
| Two or more Races | 324 | 6.5% |
| Some other Race | 49 | 1.0% |
| Total | 4,965 | 100.0% |
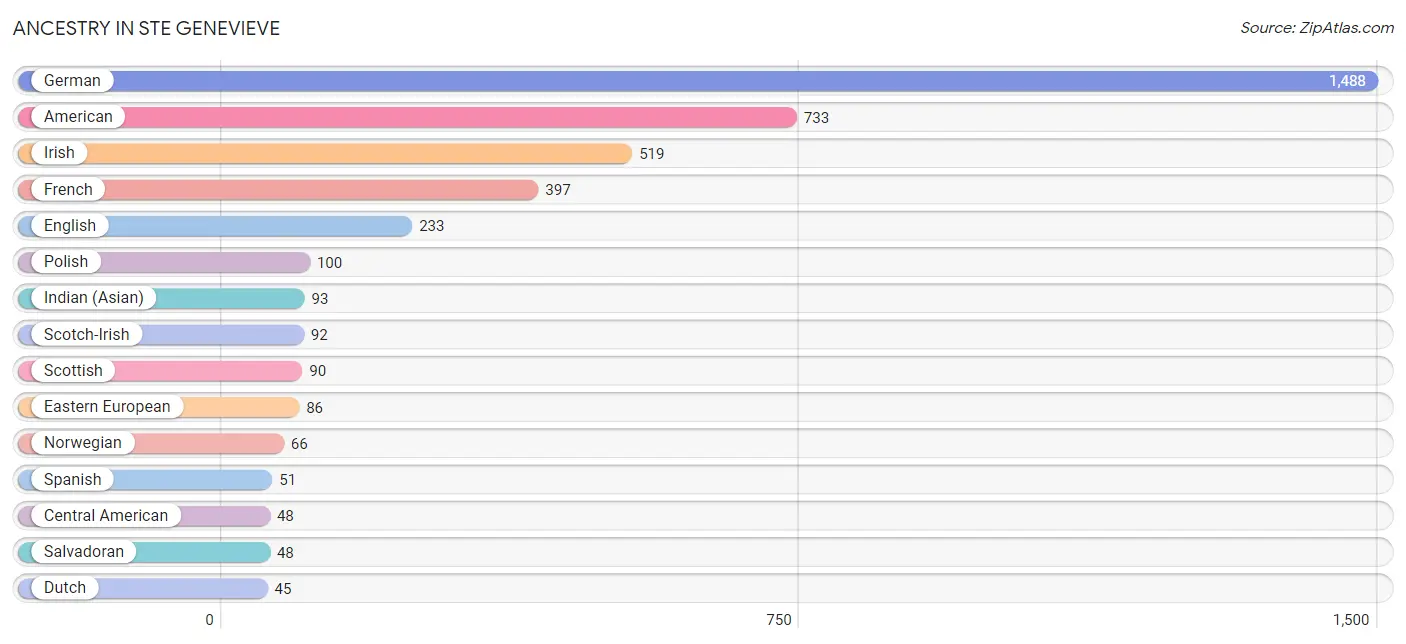
Ancestry in Ste Genevieve
The most populous ancestries reported in Ste Genevieve are German (1,488 | 30.0%), American (733 | 14.8%), Irish (519 | 10.4%), French (397 | 8.0%), and English (233 | 4.7%), together accounting for 67.9% of all Ste Genevieve residents.
| Ancestry | # Population | % Population |
| American | 733 | 14.8% |
| British | 1 | 0.0% |
| Central American | 48 | 1.0% |
| Cherokee | 2 | 0.0% |
| Chickasaw | 28 | 0.6% |
| Croatian | 35 | 0.7% |
| Dutch | 45 | 0.9% |
| Eastern European | 86 | 1.7% |
| English | 233 | 4.7% |
| European | 41 | 0.8% |
| French | 397 | 8.0% |
| French Canadian | 26 | 0.5% |
| German | 1,488 | 30.0% |
| Hmong | 23 | 0.5% |
| Indian (Asian) | 93 | 1.9% |
| Irish | 519 | 10.4% |
| Mexican | 39 | 0.8% |
| Norwegian | 66 | 1.3% |
| Polish | 100 | 2.0% |
| Russian | 25 | 0.5% |
| Salvadoran | 48 | 1.0% |
| Scandinavian | 17 | 0.3% |
| Scotch-Irish | 92 | 1.8% |
| Scottish | 90 | 1.8% |
| Slovak | 16 | 0.3% |
| Spanish | 51 | 1.0% | View All 26 Rows |
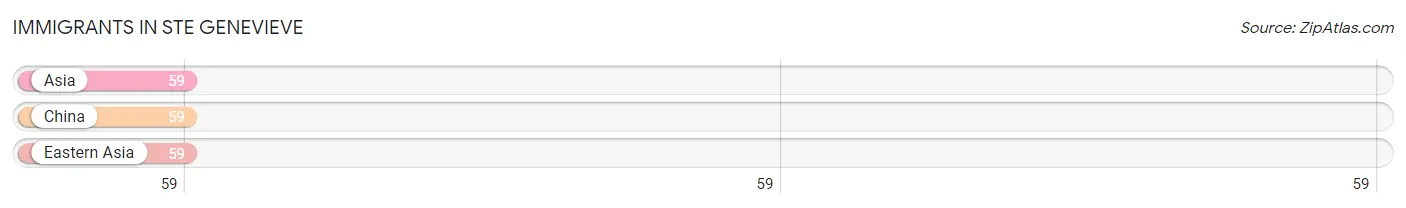
Immigrants in Ste Genevieve
The most numerous immigrant groups reported in Ste Genevieve came from Asia (59 | 1.2%), China (59 | 1.2%), and Eastern Asia (59 | 1.2%), together accounting for 3.6% of all Ste Genevieve residents.
| Immigration Origin | # Population | % Population |
| Asia | 59 | 1.2% |
| China | 59 | 1.2% |
| Eastern Asia | 59 | 1.2% | View All 3 Rows |
Sex and Age in Ste Genevieve
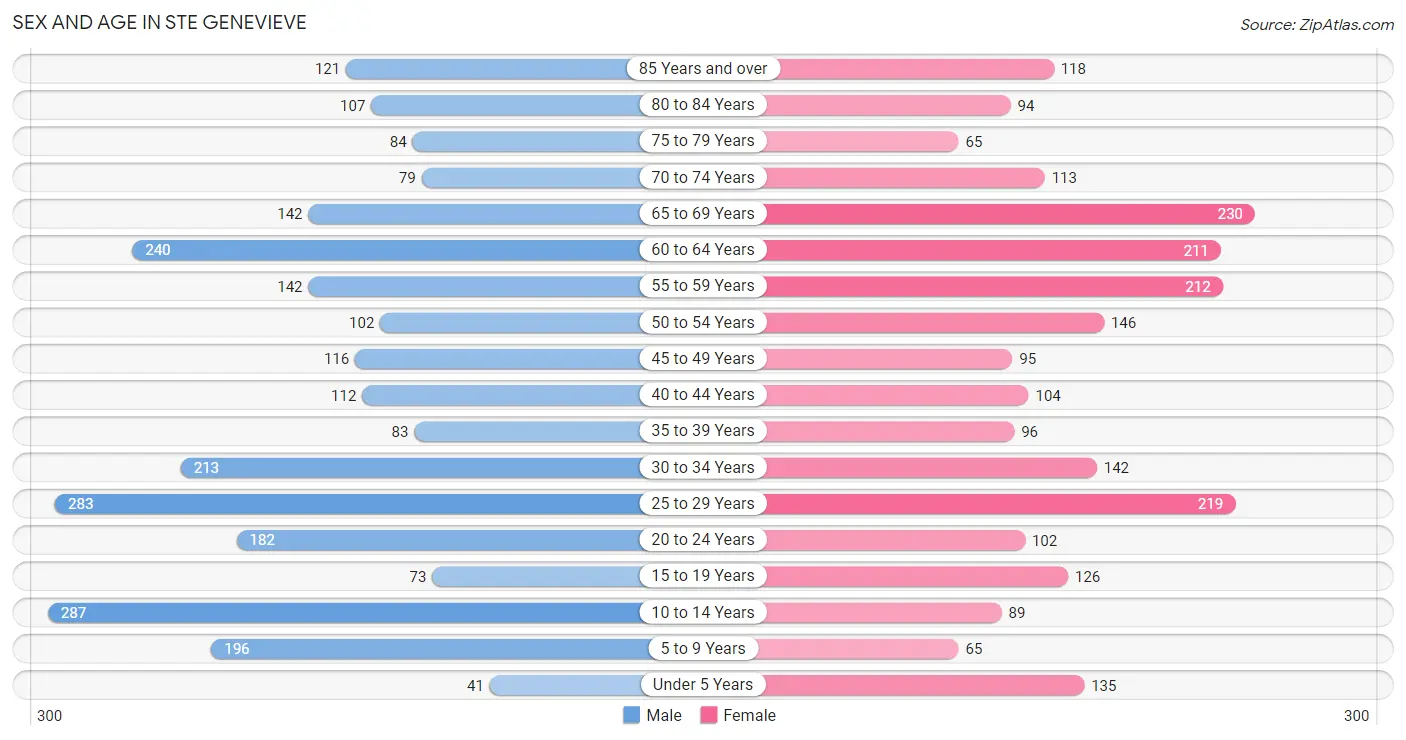
Sex and Age in Ste Genevieve
The most populous age groups in Ste Genevieve are 10 to 14 Years (287 | 11.0%) for men and 65 to 69 Years (230 | 9.7%) for women.
| Age Bracket | Male | Female |
| Under 5 Years | 41 (1.6%) | 135 (5.7%) |
| 5 to 9 Years | 196 (7.5%) | 65 (2.8%) |
| 10 to 14 Years | 287 (11.0%) | 89 (3.8%) |
| 15 to 19 Years | 73 (2.8%) | 126 (5.3%) |
| 20 to 24 Years | 182 (7.0%) | 102 (4.3%) |
| 25 to 29 Years | 283 (10.9%) | 219 (9.3%) |
| 30 to 34 Years | 213 (8.2%) | 142 (6.0%) |
| 35 to 39 Years | 83 (3.2%) | 96 (4.1%) |
| 40 to 44 Years | 112 (4.3%) | 104 (4.4%) |
| 45 to 49 Years | 116 (4.5%) | 95 (4.0%) |
| 50 to 54 Years | 102 (3.9%) | 146 (6.2%) |
| 55 to 59 Years | 142 (5.5%) | 212 (9.0%) |
| 60 to 64 Years | 240 (9.2%) | 211 (8.9%) |
| 65 to 69 Years | 142 (5.5%) | 230 (9.7%) |
| 70 to 74 Years | 79 (3.0%) | 113 (4.8%) |
| 75 to 79 Years | 84 (3.2%) | 65 (2.8%) |
| 80 to 84 Years | 107 (4.1%) | 94 (4.0%) |
| 85 Years and over | 121 (4.6%) | 118 (5.0%) |
| Total | 2,603 (100.0%) | 2,362 (100.0%) |
Families and Households in Ste Genevieve
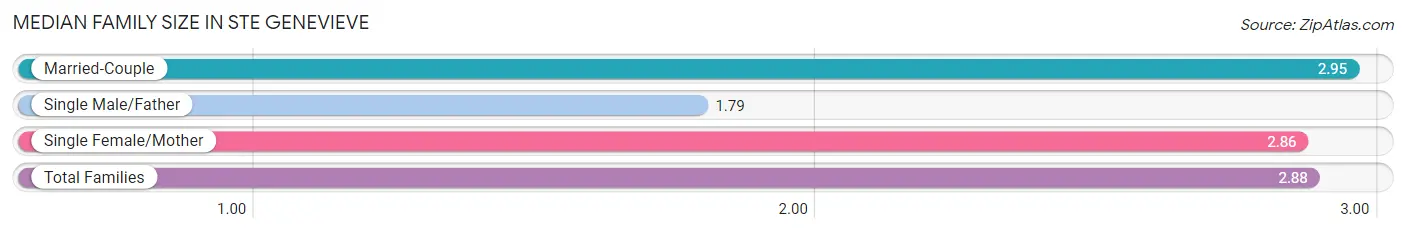
Median Family Size in Ste Genevieve
The median family size in Ste Genevieve is 2.88 persons per family, with married-couple families (1,083 | 83.7%) accounting for the largest median family size of 2.95 persons per family. On the other hand, single male/father families (63 | 4.9%) represent the smallest median family size with 1.79 persons per family.
| Family Type | # Families | Family Size |
| Married-Couple | 1,083 (83.7%) | 2.95 |
| Single Male/Father | 63 (4.9%) | 1.79 |
| Single Female/Mother | 148 (11.4%) | 2.86 |
| Total Families | 1,294 (100.0%) | 2.88 |
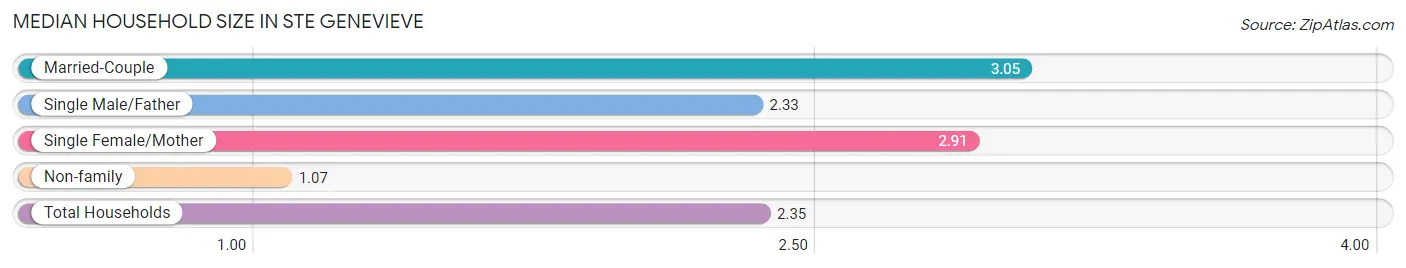
Median Household Size in Ste Genevieve
The median household size in Ste Genevieve is 2.35 persons per household, with married-couple households (1,083 | 55.4%) accounting for the largest median household size of 3.05 persons per household. non-family households (661 | 33.8%) represent the smallest median household size with 1.07 persons per household.
| Household Type | # Households | Household Size |
| Married-Couple | 1,083 (55.4%) | 3.05 |
| Single Male/Father | 63 (3.2%) | 2.33 |
| Single Female/Mother | 148 (7.6%) | 2.91 |
| Non-family | 661 (33.8%) | 1.07 |
| Total Households | 1,955 (100.0%) | 2.35 |
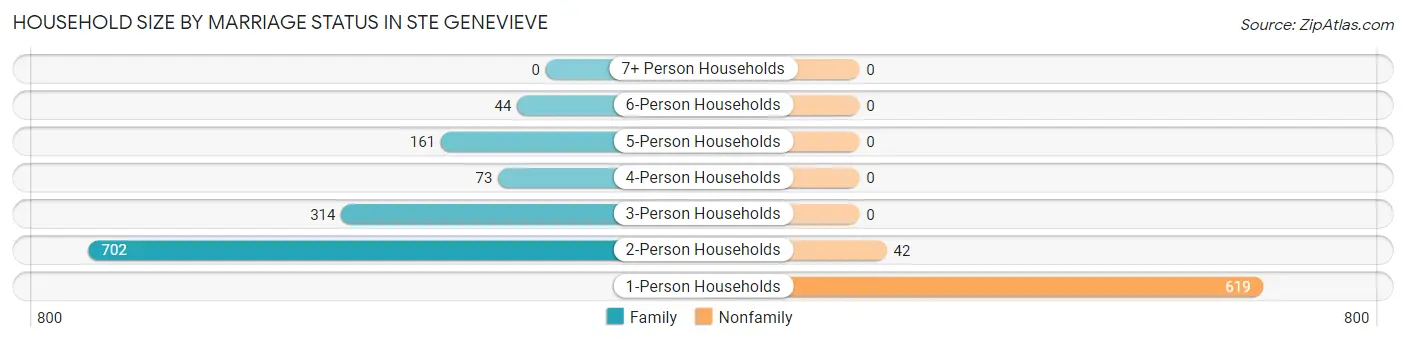
Household Size by Marriage Status in Ste Genevieve
Out of a total of 1,955 households in Ste Genevieve, 1,294 (66.2%) are family households, while 661 (33.8%) are nonfamily households. The most numerous type of family households are 2-person households, comprising 702, and the most common type of nonfamily households are 1-person households, comprising 619.
| Household Size | Family Households | Nonfamily Households |
| 1-Person Households | - | 619 (31.7%) |
| 2-Person Households | 702 (35.9%) | 42 (2.1%) |
| 3-Person Households | 314 (16.1%) | 0 (0.0%) |
| 4-Person Households | 73 (3.7%) | 0 (0.0%) |
| 5-Person Households | 161 (8.2%) | 0 (0.0%) |
| 6-Person Households | 44 (2.2%) | 0 (0.0%) |
| 7+ Person Households | 0 (0.0%) | 0 (0.0%) |
| Total | 1,294 (66.2%) | 661 (33.8%) |
Female Fertility in Ste Genevieve
Fertility by Age in Ste Genevieve
Average fertility rate in Ste Genevieve is 60.0 births per 1,000 women. Women in the age bracket of 20 to 34 years have the highest fertility rate with 117.0 births per 1,000 women. Women in the age bracket of 20 to 34 years acount for 100.0% of all women with births.
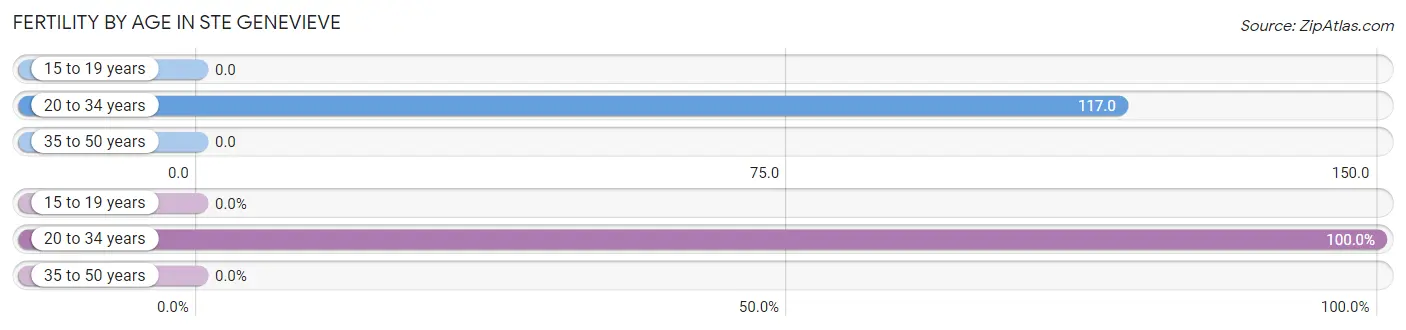
| Age Bracket | Women with Births | Births / 1,000 Women |
| 15 to 19 years | 0 (0.0%) | 0.0 |
| 20 to 34 years | 54 (100.0%) | 117.0 |
| 35 to 50 years | 0 (0.0%) | 0.0 |
| Total | 54 (100.0%) | 60.0 |
Fertility by Age by Marriage Status in Ste Genevieve
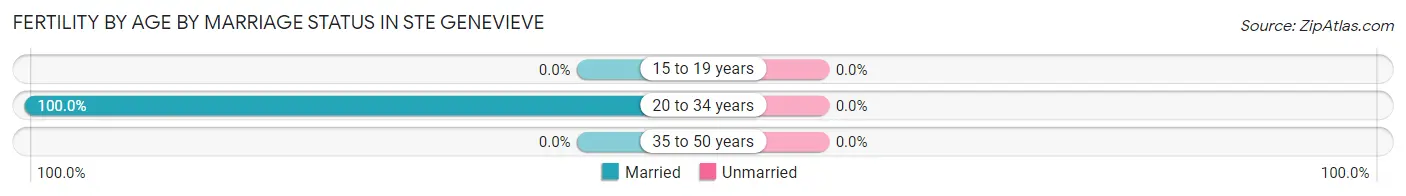
| Age Bracket | Married | Unmarried |
| 15 to 19 years | 0 (0.0%) | 0 (0.0%) |
| 20 to 34 years | 54 (100.0%) | 0 (0.0%) |
| 35 to 50 years | 0 (0.0%) | 0 (0.0%) |
| Total | 54 (100.0%) | 0 (0.0%) |
Fertility by Education in Ste Genevieve
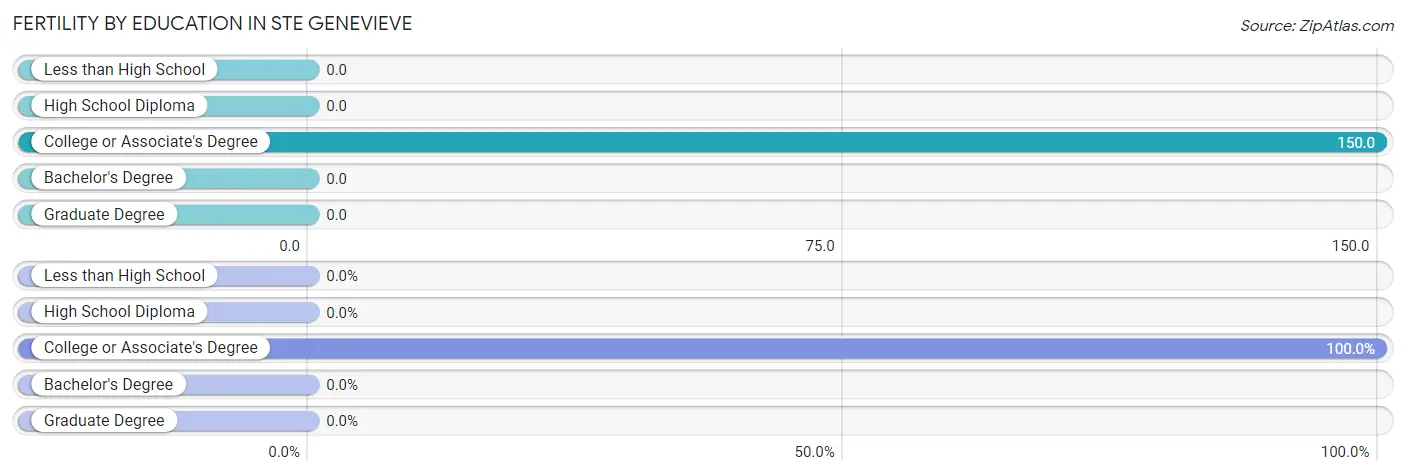
| Educational Attainment | Women with Births | Births / 1,000 Women |
| Less than High School | 0 (0.0%) | 0.0 |
| High School Diploma | 0 (0.0%) | 0.0 |
| College or Associate's Degree | 54 (100.0%) | 150.0 |
| Bachelor's Degree | 0 (0.0%) | 0.0 |
| Graduate Degree | 0 (0.0%) | 0.0 |
| Total | 54 (100.0%) | 60.0 |
Fertility by Education by Marriage Status in Ste Genevieve
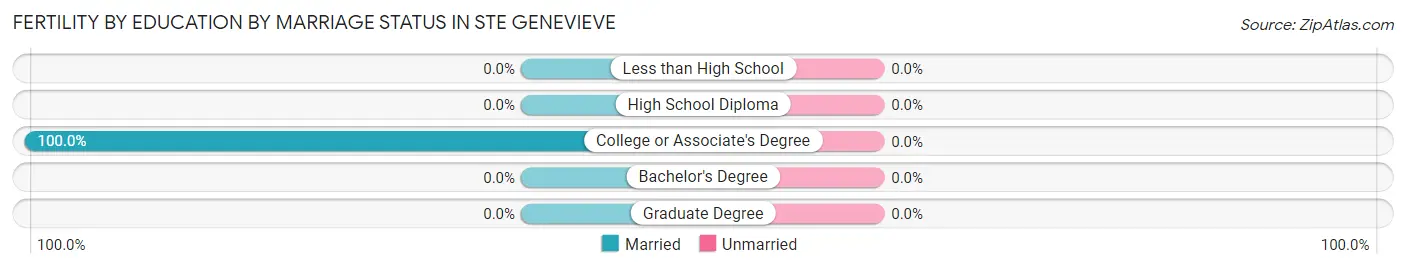
| Educational Attainment | Married | Unmarried |
| Less than High School | 0 (0.0%) | 0 (0.0%) |
| High School Diploma | 0 (0.0%) | 0 (0.0%) |
| College or Associate's Degree | 54 (100.0%) | 0 (0.0%) |
| Bachelor's Degree | 0 (0.0%) | 0 (0.0%) |
| Graduate Degree | 0 (0.0%) | 0 (0.0%) |
| Total | 54 (100.0%) | 0 (0.0%) |
Income in Ste Genevieve
Income Overview in Ste Genevieve
Per Capita Income in Ste Genevieve is $27,084, while median incomes of families and households are $68,169 and $52,760 respectively.
| Characteristic | Number | Measure |
| Per Capita Income | 4,965 | $27,084 |
| Median Family Income | 1,294 | $68,169 |
| Mean Family Income | 1,294 | $84,248 |
| Median Household Income | 1,955 | $52,760 |
| Mean Household Income | 1,955 | $66,441 |
| Income Deficit | 1,294 | $0 |
| Wage / Income Gap (%) | 4,965 | 30.54% |
| Wage / Income Gap ($) | 4,965 | 69.46¢ per $1 |
| Gini / Inequality Index | 4,965 | 0.41 |
Earnings by Sex in Ste Genevieve
Average Earnings in Ste Genevieve are $32,159, $38,777 for men and $26,935 for women, a difference of 30.5%.
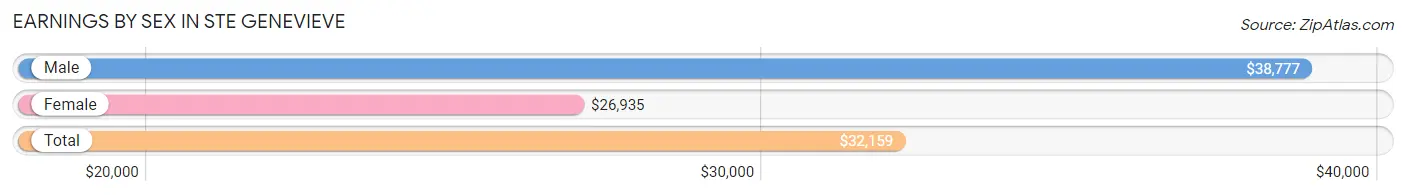
| Sex | Number | Average Earnings |
| Male | 1,229 (52.8%) | $38,777 |
| Female | 1,098 (47.2%) | $26,935 |
| Total | 2,327 (100.0%) | $32,159 |
Earnings by Sex by Income Bracket in Ste Genevieve
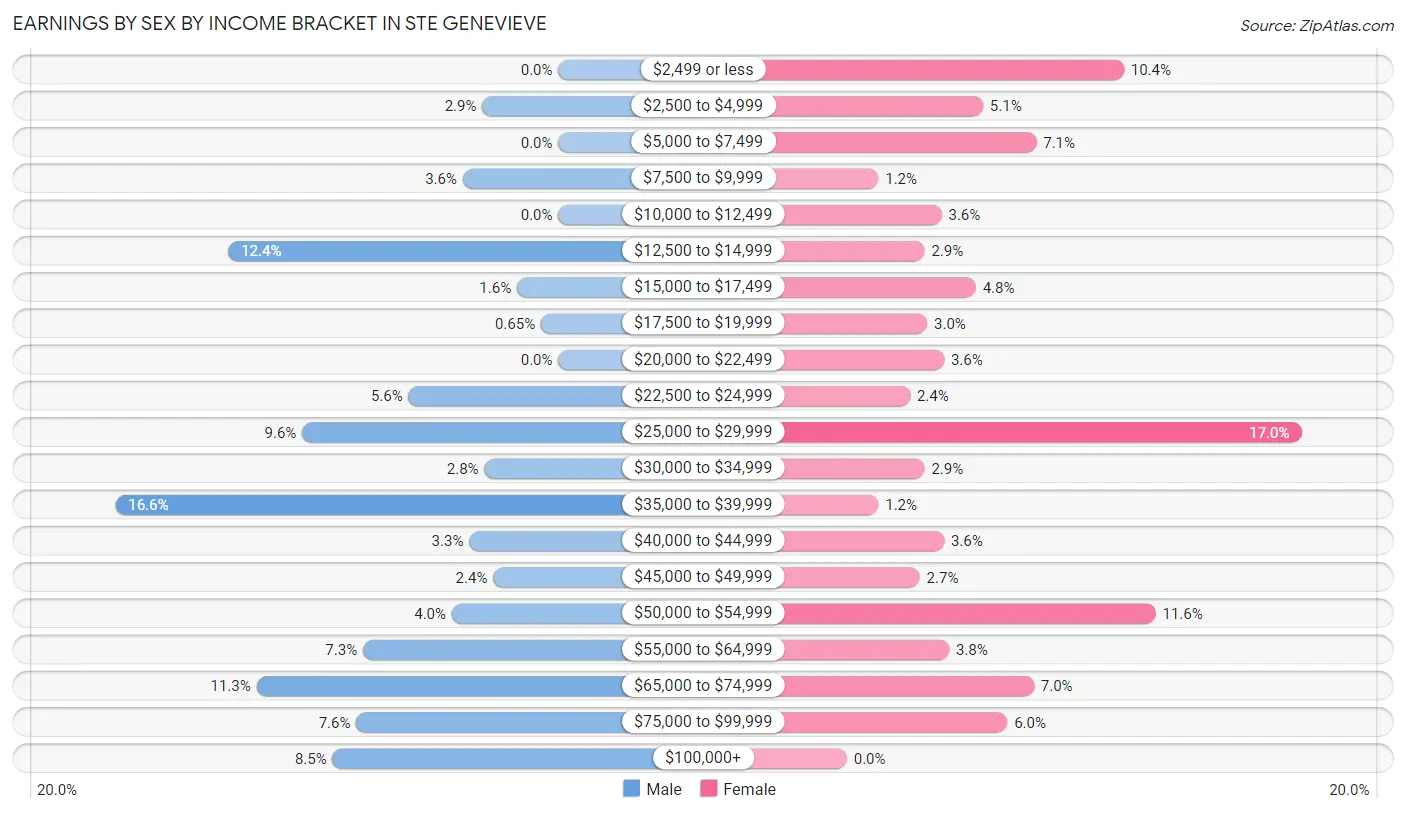
The most common earnings brackets in Ste Genevieve are $35,000 to $39,999 for men (204 | 16.6%) and $25,000 to $29,999 for women (187 | 17.0%).
| Income | Male | Female |
| $2,499 or less | 0 (0.0%) | 114 (10.4%) |
| $2,500 to $4,999 | 35 (2.9%) | 56 (5.1%) |
| $5,000 to $7,499 | 0 (0.0%) | 78 (7.1%) |
| $7,500 to $9,999 | 44 (3.6%) | 13 (1.2%) |
| $10,000 to $12,499 | 0 (0.0%) | 39 (3.5%) |
| $12,500 to $14,999 | 152 (12.4%) | 32 (2.9%) |
| $15,000 to $17,499 | 19 (1.5%) | 53 (4.8%) |
| $17,500 to $19,999 | 8 (0.6%) | 33 (3.0%) |
| $20,000 to $22,499 | 0 (0.0%) | 40 (3.6%) |
| $22,500 to $24,999 | 69 (5.6%) | 26 (2.4%) |
| $25,000 to $29,999 | 118 (9.6%) | 187 (17.0%) |
| $30,000 to $34,999 | 34 (2.8%) | 32 (2.9%) |
| $35,000 to $39,999 | 204 (16.6%) | 13 (1.2%) |
| $40,000 to $44,999 | 41 (3.3%) | 40 (3.6%) |
| $45,000 to $49,999 | 30 (2.4%) | 30 (2.7%) |
| $50,000 to $54,999 | 49 (4.0%) | 127 (11.6%) |
| $55,000 to $64,999 | 90 (7.3%) | 42 (3.8%) |
| $65,000 to $74,999 | 139 (11.3%) | 77 (7.0%) |
| $75,000 to $99,999 | 93 (7.6%) | 66 (6.0%) |
| $100,000+ | 104 (8.5%) | 0 (0.0%) |
| Total | 1,229 (100.0%) | 1,098 (100.0%) |
Earnings by Sex by Educational Attainment in Ste Genevieve
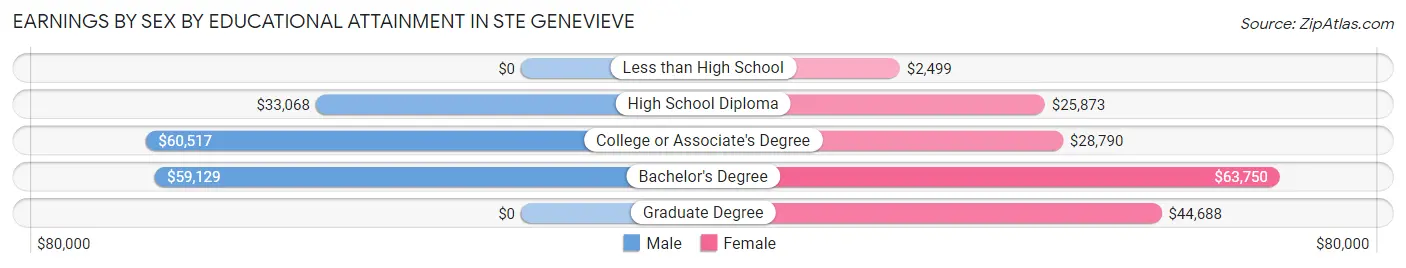
Average earnings in Ste Genevieve are $41,189 for men and $27,961 for women, a difference of 32.1%. Men with an educational attainment of college or associate's degree enjoy the highest average annual earnings of $60,517, while those with high school diploma education earn the least with $33,068. Women with an educational attainment of bachelor's degree earn the most with the average annual earnings of $63,750, while those with less than high school education have the smallest earnings of $2,499.
| Educational Attainment | Male Income | Female Income |
| Less than High School | - | - |
| High School Diploma | $33,068 | $25,873 |
| College or Associate's Degree | $60,517 | $28,790 |
| Bachelor's Degree | $59,129 | $63,750 |
| Graduate Degree | - | - |
| Total | $41,189 | $27,961 |
Family Income in Ste Genevieve
Family Income Brackets in Ste Genevieve
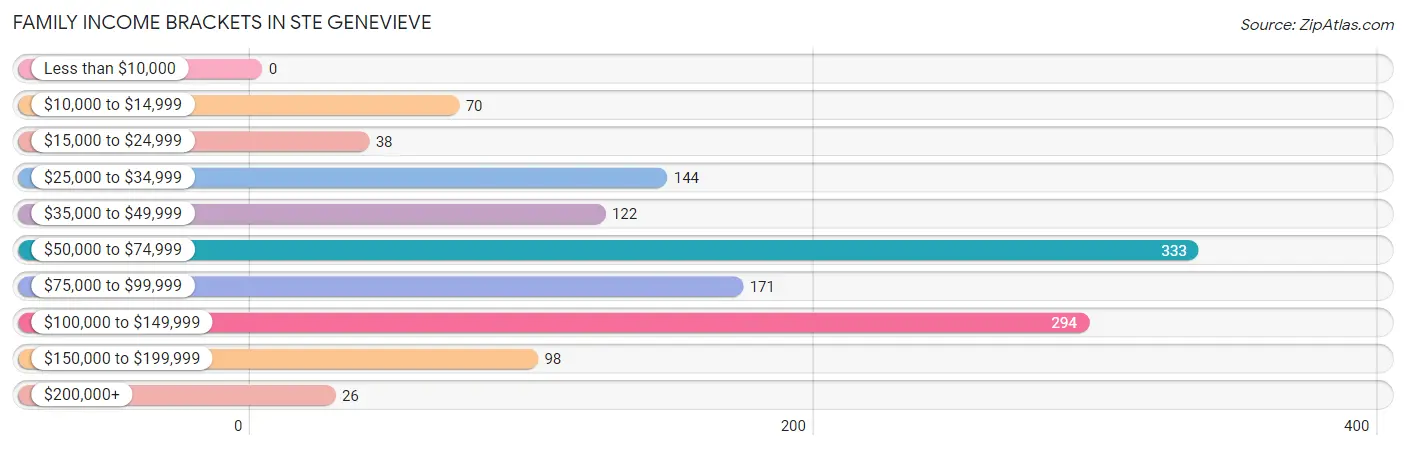
According to the Ste Genevieve family income data, there are 333 families falling into the $50,000 to $74,999 income range, which is the most common income bracket and makes up 25.7% of all families.
| Income Bracket | # Families | % Families |
| Less than $10,000 | 0 | 0.0% |
| $10,000 to $14,999 | 70 | 5.4% |
| $15,000 to $24,999 | 38 | 2.9% |
| $25,000 to $34,999 | 144 | 11.1% |
| $35,000 to $49,999 | 122 | 9.4% |
| $50,000 to $74,999 | 333 | 25.7% |
| $75,000 to $99,999 | 171 | 13.2% |
| $100,000 to $149,999 | 294 | 22.7% |
| $150,000 to $199,999 | 98 | 7.6% |
| $200,000+ | 26 | 2.0% |
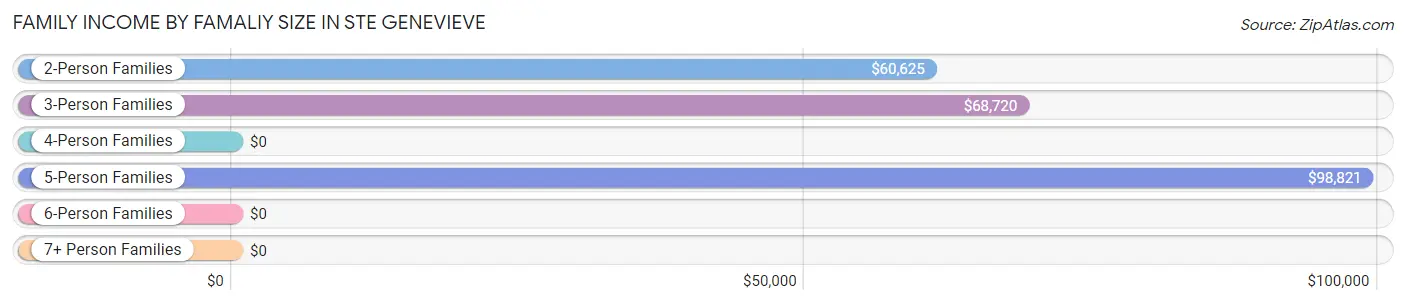
Family Income by Famaliy Size in Ste Genevieve
5-person families (161 | 12.4%) account for the highest median family income in Ste Genevieve with $98,821 per family, while 2-person families (757 | 58.5%) have the highest median income of $30,312 per family member.
| Income Bracket | # Families | Median Income |
| 2-Person Families | 757 (58.5%) | $60,625 |
| 3-Person Families | 306 (23.6%) | $68,720 |
| 4-Person Families | 59 (4.6%) | $0 |
| 5-Person Families | 161 (12.4%) | $98,821 |
| 6-Person Families | 11 (0.9%) | $0 |
| 7+ Person Families | 0 (0.0%) | $0 |
| Total | 1,294 (100.0%) | $68,169 |
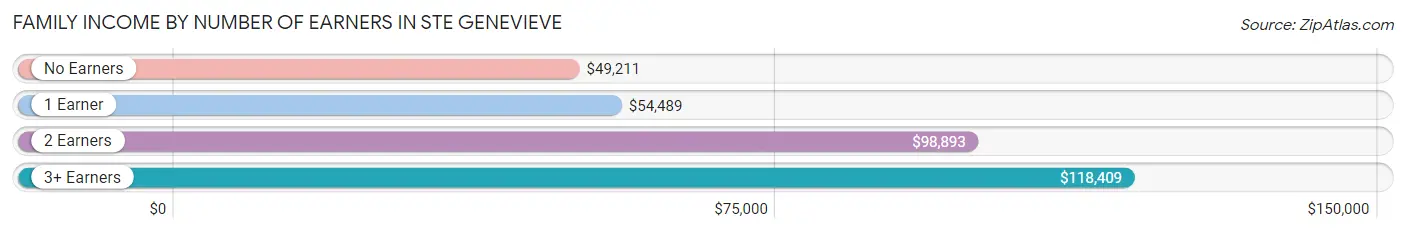
Family Income by Number of Earners in Ste Genevieve
The median family income in Ste Genevieve is $68,169, with families comprising 3+ earners (110) having the highest median family income of $118,409, while families with no earners (166) have the lowest median family income of $49,211, accounting for 8.5% and 12.8% of families, respectively.
| Number of Earners | # Families | Median Income |
| No Earners | 166 (12.8%) | $49,211 |
| 1 Earner | 561 (43.3%) | $54,489 |
| 2 Earners | 457 (35.3%) | $98,893 |
| 3+ Earners | 110 (8.5%) | $118,409 |
| Total | 1,294 (100.0%) | $68,169 |
Household Income in Ste Genevieve
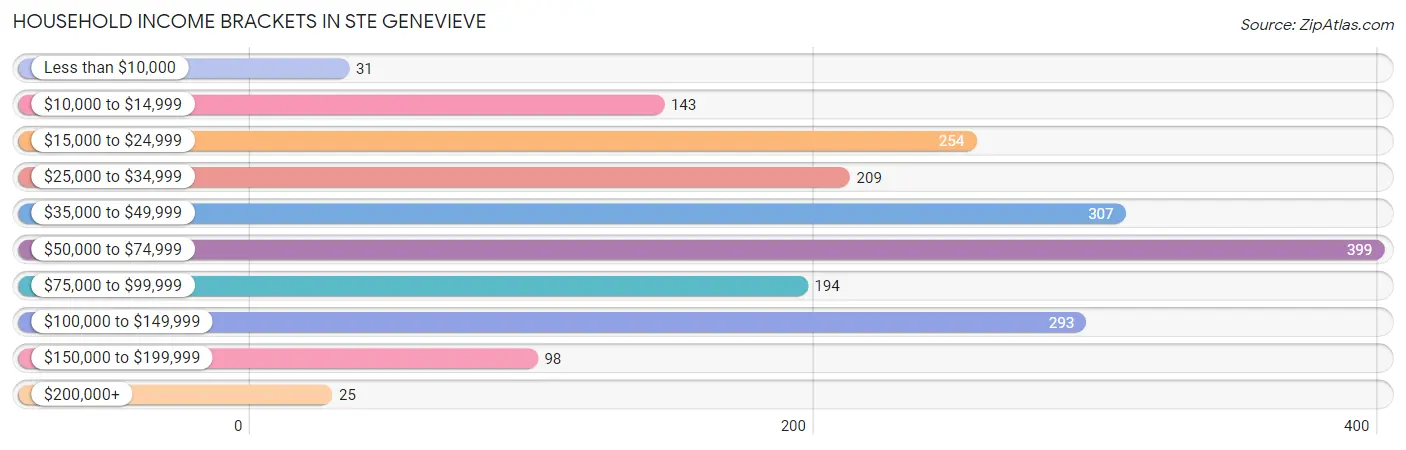
Household Income Brackets in Ste Genevieve
With 399 households falling in the category, the $50,000 to $74,999 income range is the most frequent in Ste Genevieve, accounting for 20.4% of all households. In contrast, only 25 households (1.3%) fall into the $200,000+ income bracket, making it the least populous group.
| Income Bracket | # Households | % Households |
| Less than $10,000 | 31 | 1.6% |
| $10,000 to $14,999 | 143 | 7.3% |
| $15,000 to $24,999 | 254 | 13.0% |
| $25,000 to $34,999 | 209 | 10.7% |
| $35,000 to $49,999 | 307 | 15.7% |
| $50,000 to $74,999 | 399 | 20.4% |
| $75,000 to $99,999 | 194 | 9.9% |
| $100,000 to $149,999 | 293 | 15.0% |
| $150,000 to $199,999 | 98 | 5.0% |
| $200,000+ | 25 | 1.3% |
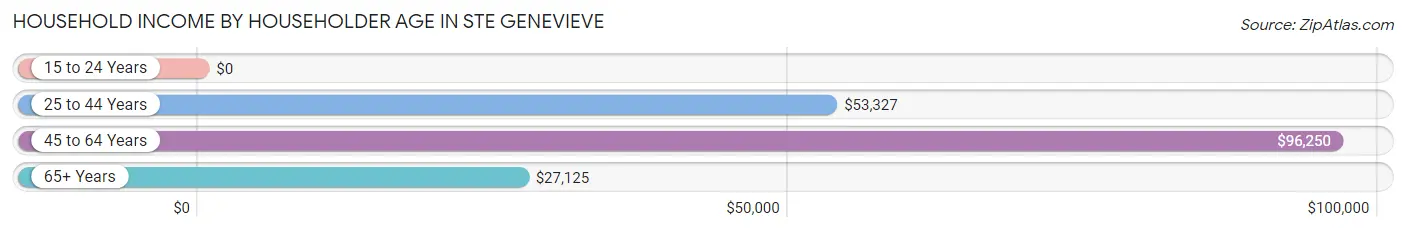
Household Income by Householder Age in Ste Genevieve
The median household income in Ste Genevieve is $52,760, with the highest median household income of $96,250 found in the 45 to 64 years age bracket for the primary householder. A total of 569 households (29.1%) fall into this category. Meanwhile, the 15 to 24 years age bracket for the primary householder has the lowest median household income of $0, with 191 households (9.8%) in this group.
| Income Bracket | # Households | Median Income |
| 15 to 24 Years | 191 (9.8%) | $0 |
| 25 to 44 Years | 479 (24.5%) | $53,327 |
| 45 to 64 Years | 569 (29.1%) | $96,250 |
| 65+ Years | 716 (36.6%) | $27,125 |
| Total | 1,955 (100.0%) | $52,760 |
Poverty in Ste Genevieve
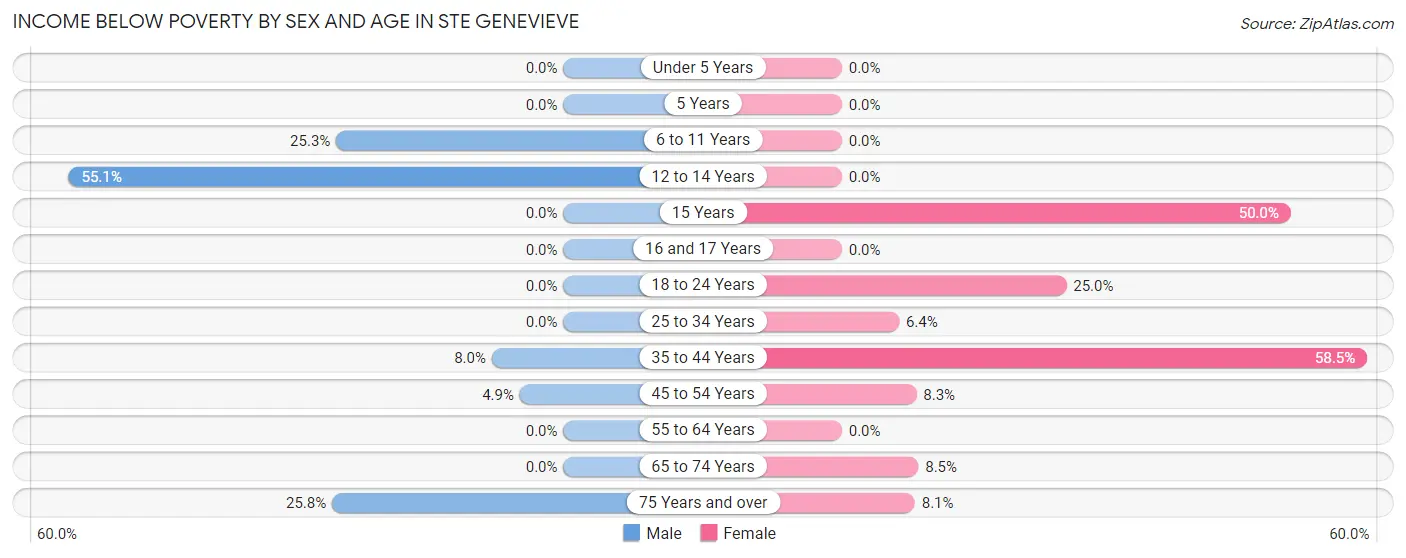
Income Below Poverty by Sex and Age in Ste Genevieve
With 10.0% poverty level for males and 12.2% for females among the residents of Ste Genevieve, 12 to 14 year old males and 35 to 44 year old females are the most vulnerable to poverty, with 81 males (55.1%) and 117 females (58.5%) in their respective age groups living below the poverty level.
| Age Bracket | Male | Female |
| Under 5 Years | 0 (0.0%) | 0 (0.0%) |
| 5 Years | 0 (0.0%) | 0 (0.0%) |
| 6 to 11 Years | 64 (25.3%) | 0 (0.0%) |
| 12 to 14 Years | 81 (55.1%) | 0 (0.0%) |
| 15 Years | 0 (0.0%) | 28 (50.0%) |
| 16 and 17 Years | 0 (0.0%) | 0 (0.0%) |
| 18 to 24 Years | 0 (0.0%) | 34 (25.0%) |
| 25 to 34 Years | 0 (0.0%) | 23 (6.4%) |
| 35 to 44 Years | 11 (8.0%) | 117 (58.5%) |
| 45 to 54 Years | 10 (4.9%) | 20 (8.3%) |
| 55 to 64 Years | 0 (0.0%) | 0 (0.0%) |
| 65 to 74 Years | 0 (0.0%) | 27 (8.5%) |
| 75 Years and over | 68 (25.8%) | 20 (8.1%) |
| Total | 234 (10.0%) | 269 (12.2%) |
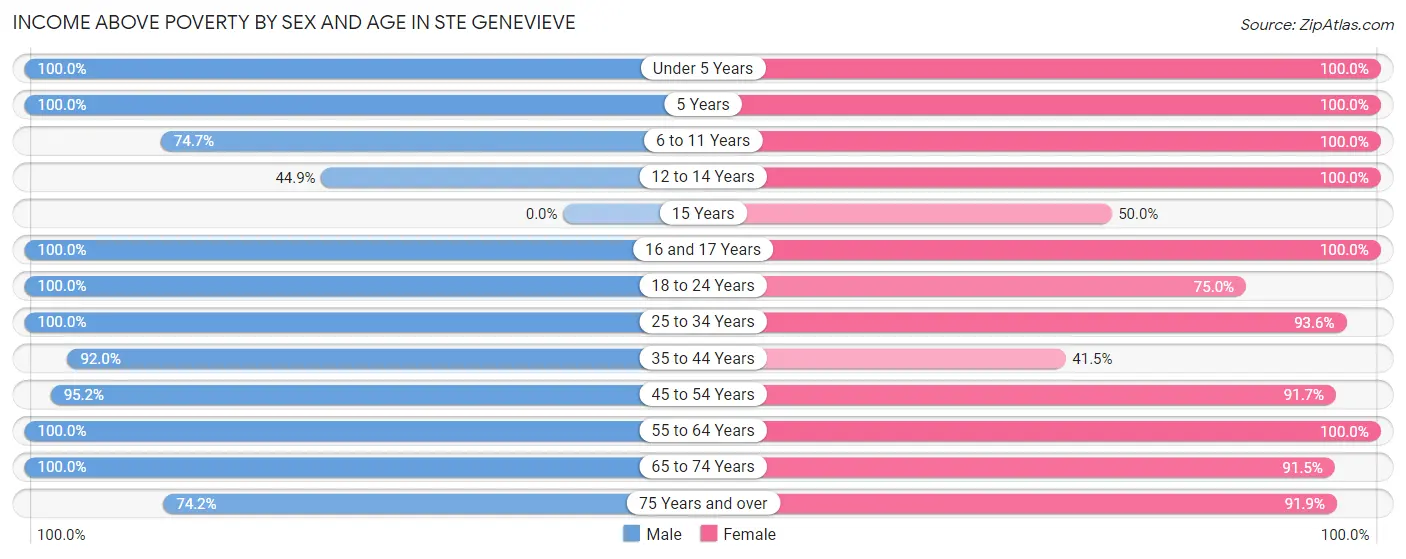
Income Above Poverty by Sex and Age in Ste Genevieve
According to the poverty statistics in Ste Genevieve, males aged under 5 years and females aged under 5 years are the age groups that are most secure financially, with 100.0% of males and 100.0% of females in these age groups living above the poverty line.
| Age Bracket | Male | Female |
| Under 5 Years | 41 (100.0%) | 93 (100.0%) |
| 5 Years | 53 (100.0%) | 17 (100.0%) |
| 6 to 11 Years | 189 (74.7%) | 51 (100.0%) |
| 12 to 14 Years | 66 (44.9%) | 61 (100.0%) |
| 15 Years | 0 (0.0%) | 28 (50.0%) |
| 16 and 17 Years | 21 (100.0%) | 36 (100.0%) |
| 18 to 24 Years | 215 (100.0%) | 102 (75.0%) |
| 25 to 34 Years | 421 (100.0%) | 338 (93.6%) |
| 35 to 44 Years | 127 (92.0%) | 83 (41.5%) |
| 45 to 54 Years | 196 (95.2%) | 221 (91.7%) |
| 55 to 64 Years | 363 (100.0%) | 381 (100.0%) |
| 65 to 74 Years | 221 (100.0%) | 290 (91.5%) |
| 75 Years and over | 196 (74.2%) | 226 (91.9%) |
| Total | 2,109 (90.0%) | 1,927 (87.7%) |
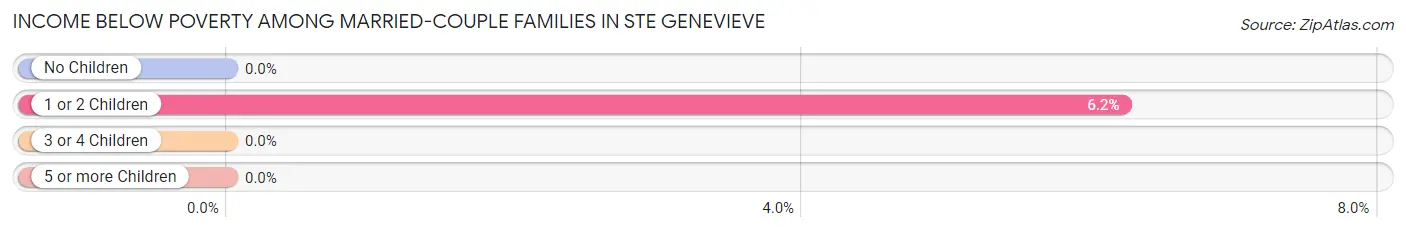
Income Below Poverty Among Married-Couple Families in Ste Genevieve
The poverty statistics for married-couple families in Ste Genevieve show that 1.3% or 14 of the total 1,083 families live below the poverty line. Families with 1 or 2 children have the highest poverty rate of 6.2%, comprising of 14 families. On the other hand, families with no children have the lowest poverty rate of 0.0%, which includes 0 families.
| Children | Above Poverty | Below Poverty |
| No Children | 740 (100.0%) | 0 (0.0%) |
| 1 or 2 Children | 211 (93.8%) | 14 (6.2%) |
| 3 or 4 Children | 118 (100.0%) | 0 (0.0%) |
| 5 or more Children | 0 (0.0%) | 0 (0.0%) |
| Total | 1,069 (98.7%) | 14 (1.3%) |
Income Below Poverty Among Single-Parent Households in Ste Genevieve
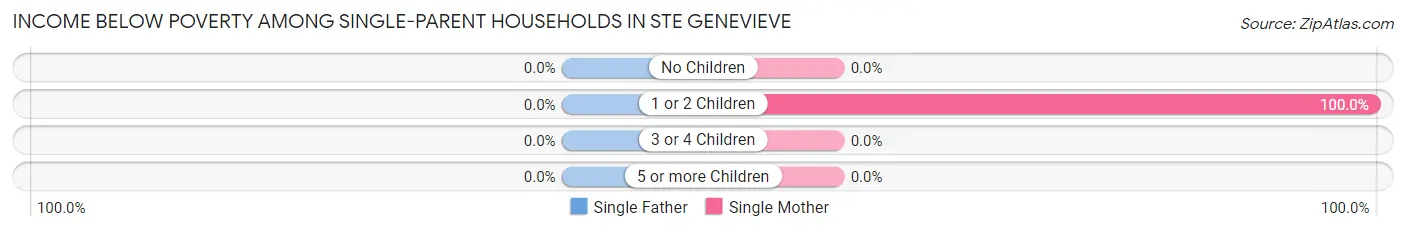
| Children | Single Father | Single Mother |
| No Children | 0 (0.0%) | 0 (0.0%) |
| 1 or 2 Children | 0 (0.0%) | 79 (100.0%) |
| 3 or 4 Children | 0 (0.0%) | 0 (0.0%) |
| 5 or more Children | 0 (0.0%) | 0 (0.0%) |
| Total | 0 (0.0%) | 79 (53.4%) |
Income Below Poverty Among Married-Couple vs Single-Parent Households in Ste Genevieve
The poverty data for Ste Genevieve shows that 14 of the married-couple family households (1.3%) and 79 of the single-parent households (37.4%) are living below the poverty level. Within the married-couple family households, those with 1 or 2 children have the highest poverty rate, with 14 households (6.2%) falling below the poverty line. Among the single-parent households, those with 1 or 2 children have the highest poverty rate, with 79 household (55.6%) living below poverty.
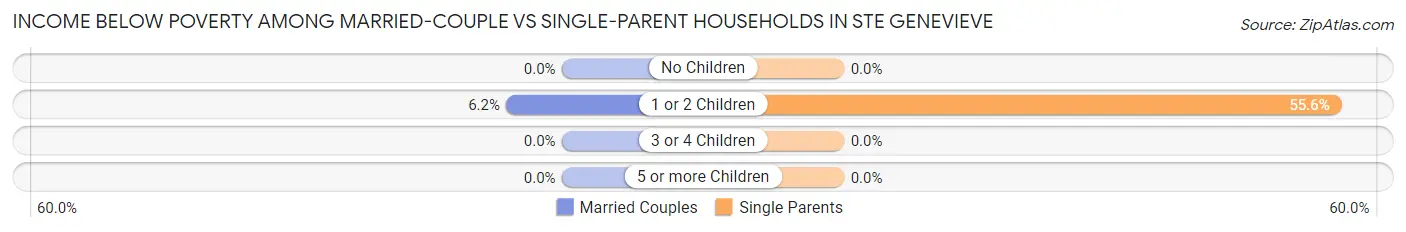
| Children | Married-Couple Families | Single-Parent Households |
| No Children | 0 (0.0%) | 0 (0.0%) |
| 1 or 2 Children | 14 (6.2%) | 79 (55.6%) |
| 3 or 4 Children | 0 (0.0%) | 0 (0.0%) |
| 5 or more Children | 0 (0.0%) | 0 (0.0%) |
| Total | 14 (1.3%) | 79 (37.4%) |
Employment Characteristics in Ste Genevieve
Employment by Class of Employer in Ste Genevieve
Among the 1,959 employed individuals in Ste Genevieve, private company employees (1,234 | 63.0%), local government employees (278 | 14.2%), and not-for-profit organizations (208 | 10.6%) make up the most common classes of employment.
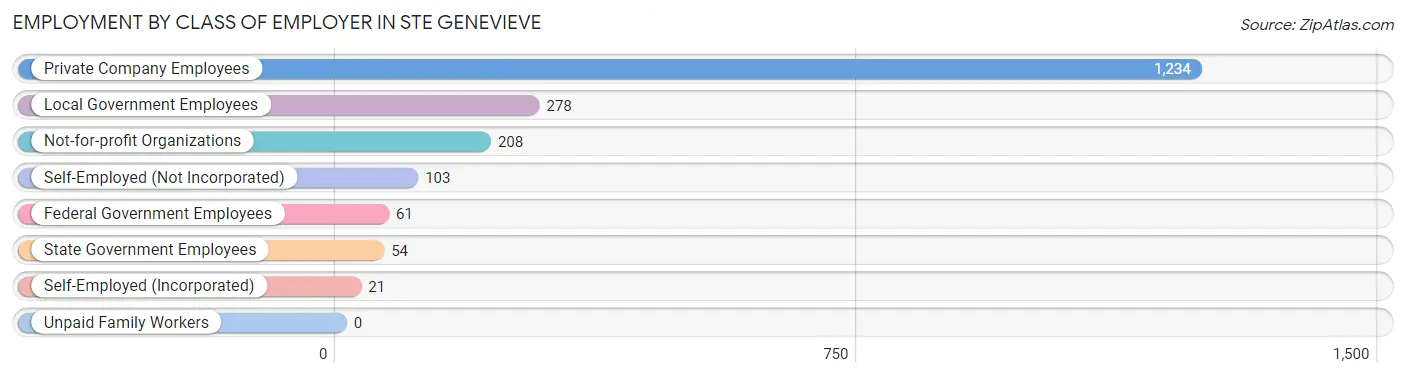
| Employer Class | # Employees | % Employees |
| Private Company Employees | 1,234 | 63.0% |
| Self-Employed (Incorporated) | 21 | 1.1% |
| Self-Employed (Not Incorporated) | 103 | 5.3% |
| Not-for-profit Organizations | 208 | 10.6% |
| Local Government Employees | 278 | 14.2% |
| State Government Employees | 54 | 2.8% |
| Federal Government Employees | 61 | 3.1% |
| Unpaid Family Workers | 0 | 0.0% |
| Total | 1,959 | 100.0% |
Employment Status by Age in Ste Genevieve
According to the labor force statistics for Ste Genevieve, out of the total population over 16 years of age (4,096), 52.1% or 2,134 individuals are in the labor force, with 6.1% or 130 of them unemployed. The age group with the highest labor force participation rate is 25 to 29 years, with 89.6% or 450 individuals in the labor force. Within the labor force, the 25 to 29 years age range has the highest percentage of unemployed individuals, with 15.8% or 71 of them being unemployed.
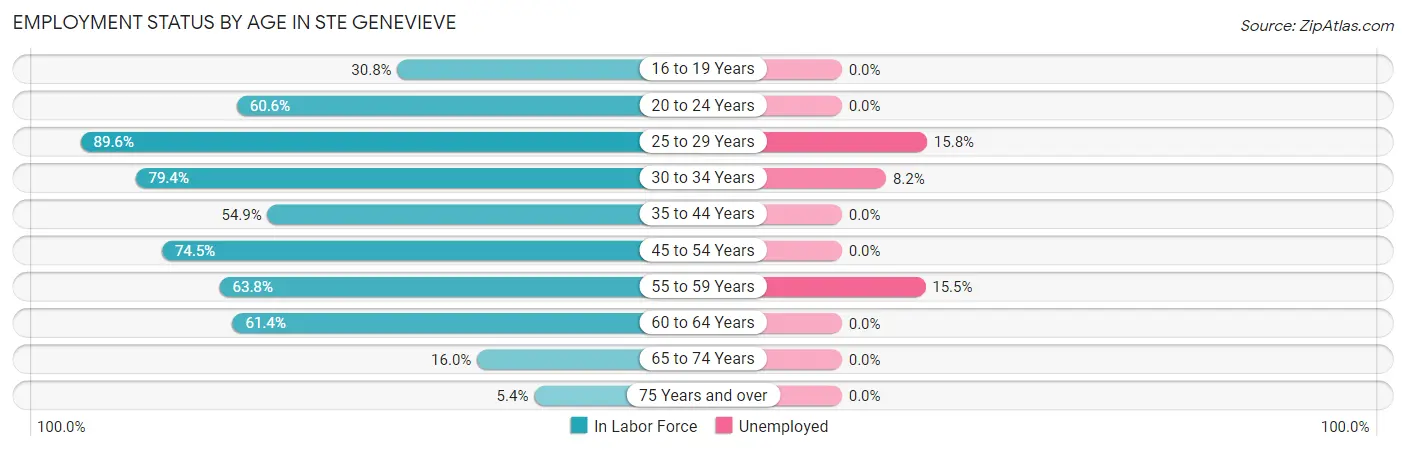
| Age Bracket | In Labor Force | Unemployed |
| 16 to 19 Years | 44 (30.8%) | 0 (0.0%) |
| 20 to 24 Years | 172 (60.6%) | 0 (0.0%) |
| 25 to 29 Years | 450 (89.6%) | 71 (15.8%) |
| 30 to 34 Years | 282 (79.4%) | 23 (8.2%) |
| 35 to 44 Years | 217 (54.9%) | 0 (0.0%) |
| 45 to 54 Years | 342 (74.5%) | 0 (0.0%) |
| 55 to 59 Years | 226 (63.8%) | 35 (15.5%) |
| 60 to 64 Years | 277 (61.4%) | 0 (0.0%) |
| 65 to 74 Years | 90 (16.0%) | 0 (0.0%) |
| 75 Years and over | 32 (5.4%) | 0 (0.0%) |
| Total | 2,134 (52.1%) | 130 (6.1%) |
Employment Status by Educational Attainment in Ste Genevieve
According to labor force statistics for Ste Genevieve, 71.3% of individuals (1,794) out of the total population between 25 and 64 years of age (2,516) are in the labor force, with 7.2% or 129 of them being unemployed. The group with the highest labor force participation rate are those with the educational attainment of bachelor's degree or higher, with 89.2% or 346 individuals in the labor force. Within the labor force, individuals with high school diploma education have the highest percentage of unemployment, with 15.0% or 106 of them being unemployed.
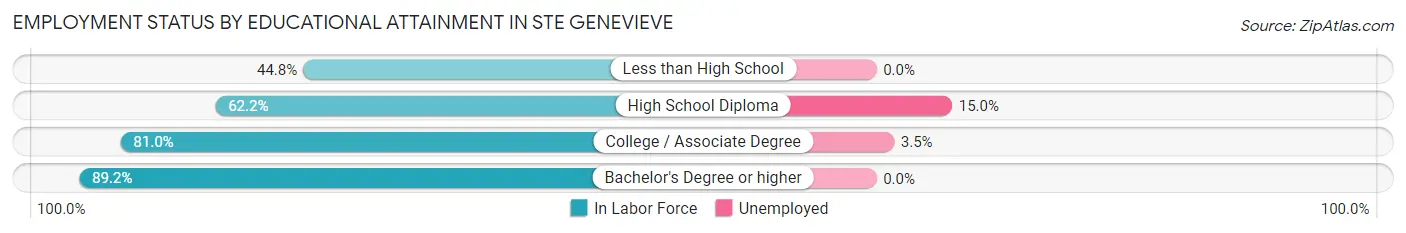
| Educational Attainment | In Labor Force | Unemployed |
| Less than High School | 77 (44.8%) | 0 (0.0%) |
| High School Diploma | 705 (62.2%) | 170 (15.0%) |
| College / Associate Degree | 666 (81.0%) | 29 (3.5%) |
| Bachelor's Degree or higher | 346 (89.2%) | 0 (0.0%) |
| Total | 1,794 (71.3%) | 181 (7.2%) |
Employment Occupations by Sex in Ste Genevieve
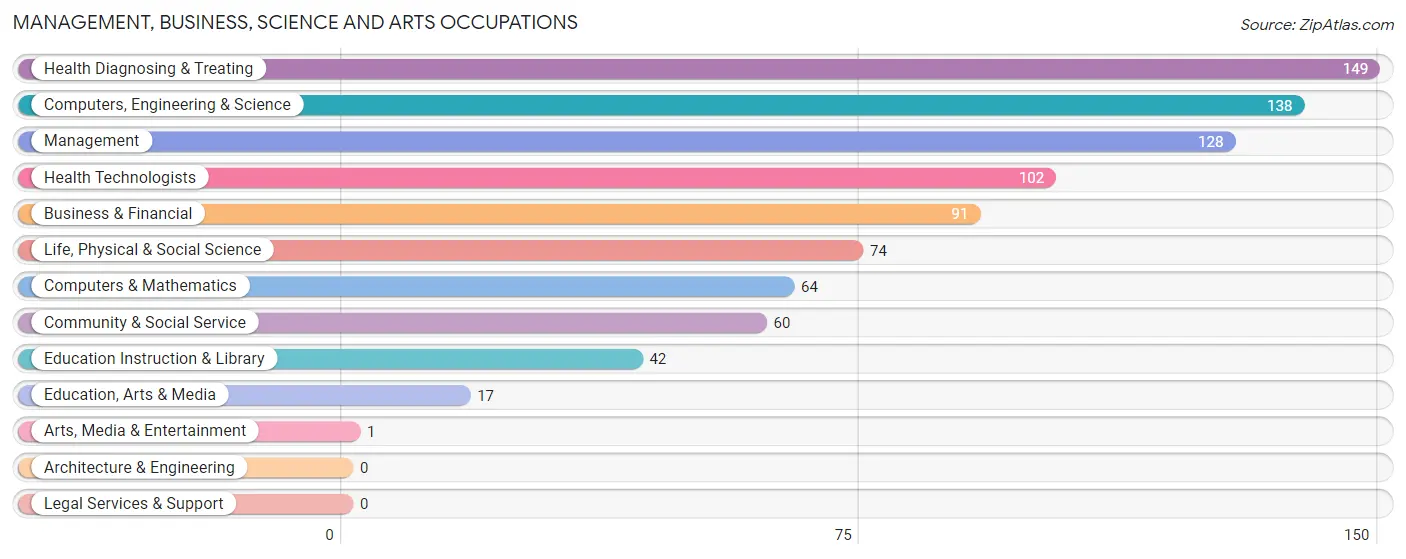
Management, Business, Science and Arts Occupations
The most common Management, Business, Science and Arts occupations in Ste Genevieve are Health Diagnosing & Treating (149 | 7.4%), Computers, Engineering & Science (138 | 6.9%), Management (128 | 6.4%), Health Technologists (102 | 5.1%), and Business & Financial (91 | 4.5%).
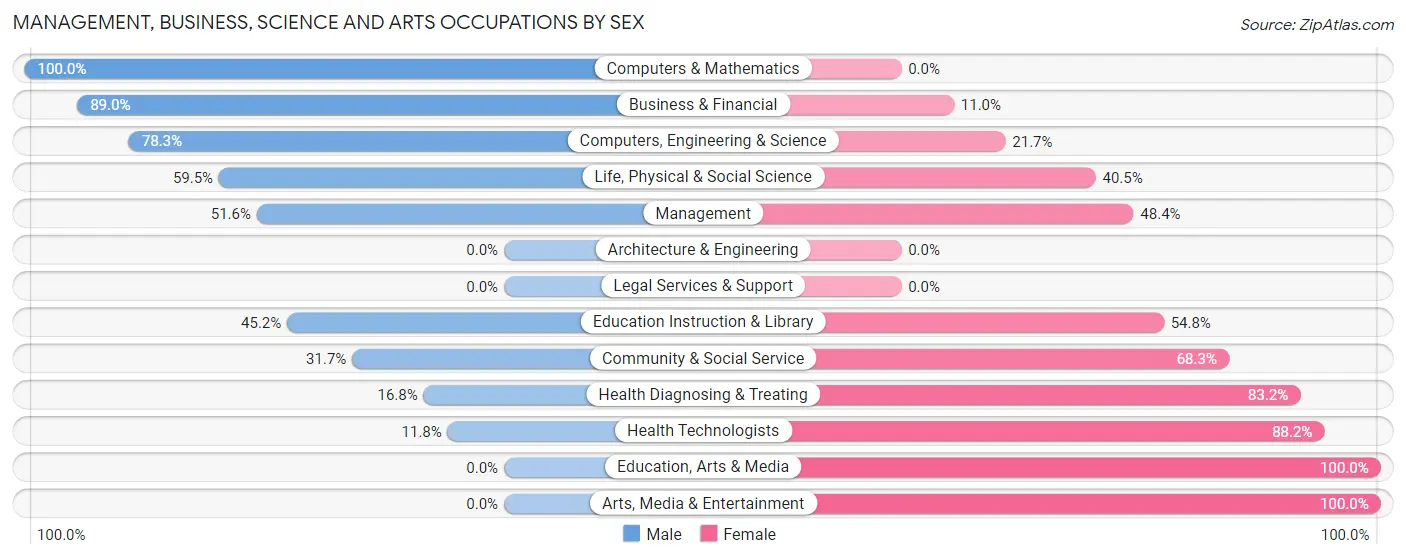
Management, Business, Science and Arts Occupations by Sex
Within the Management, Business, Science and Arts occupations in Ste Genevieve, the most male-oriented occupations are Computers & Mathematics (100.0%), Business & Financial (89.0%), and Computers, Engineering & Science (78.3%), while the most female-oriented occupations are Education, Arts & Media (100.0%), Arts, Media & Entertainment (100.0%), and Health Technologists (88.2%).
| Occupation | Male | Female |
| Management | 66 (51.6%) | 62 (48.4%) |
| Business & Financial | 81 (89.0%) | 10 (11.0%) |
| Computers, Engineering & Science | 108 (78.3%) | 30 (21.7%) |
| Computers & Mathematics | 64 (100.0%) | 0 (0.0%) |
| Architecture & Engineering | 0 (0.0%) | 0 (0.0%) |
| Life, Physical & Social Science | 44 (59.5%) | 30 (40.5%) |
| Community & Social Service | 19 (31.7%) | 41 (68.3%) |
| Education, Arts & Media | 0 (0.0%) | 17 (100.0%) |
| Legal Services & Support | 0 (0.0%) | 0 (0.0%) |
| Education Instruction & Library | 19 (45.2%) | 23 (54.8%) |
| Arts, Media & Entertainment | 0 (0.0%) | 1 (100.0%) |
| Health Diagnosing & Treating | 25 (16.8%) | 124 (83.2%) |
| Health Technologists | 12 (11.8%) | 90 (88.2%) |
| Total (Category) | 299 (52.8%) | 267 (47.2%) |
| Total (Overall) | 1,153 (57.6%) | 850 (42.4%) |
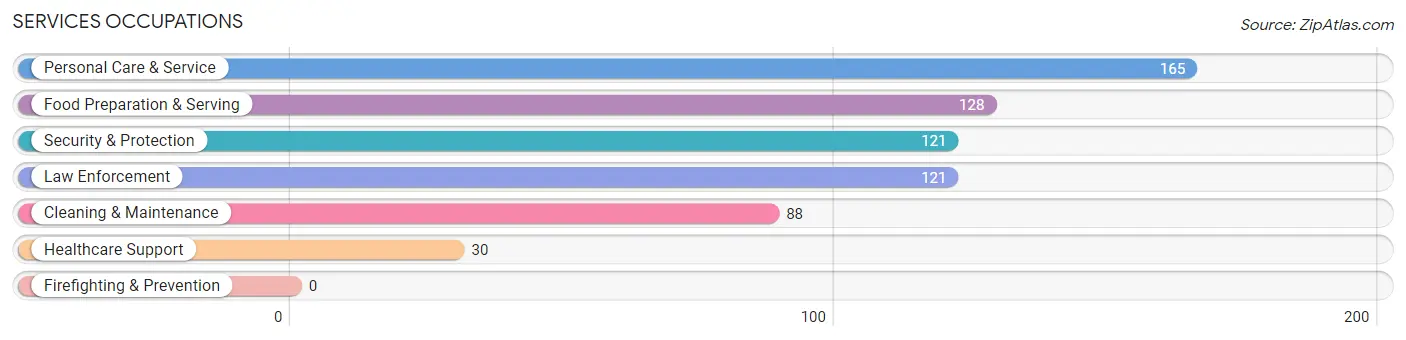
Services Occupations
The most common Services occupations in Ste Genevieve are Personal Care & Service (165 | 8.2%), Food Preparation & Serving (128 | 6.4%), Security & Protection (121 | 6.0%), Law Enforcement (121 | 6.0%), and Cleaning & Maintenance (88 | 4.4%).
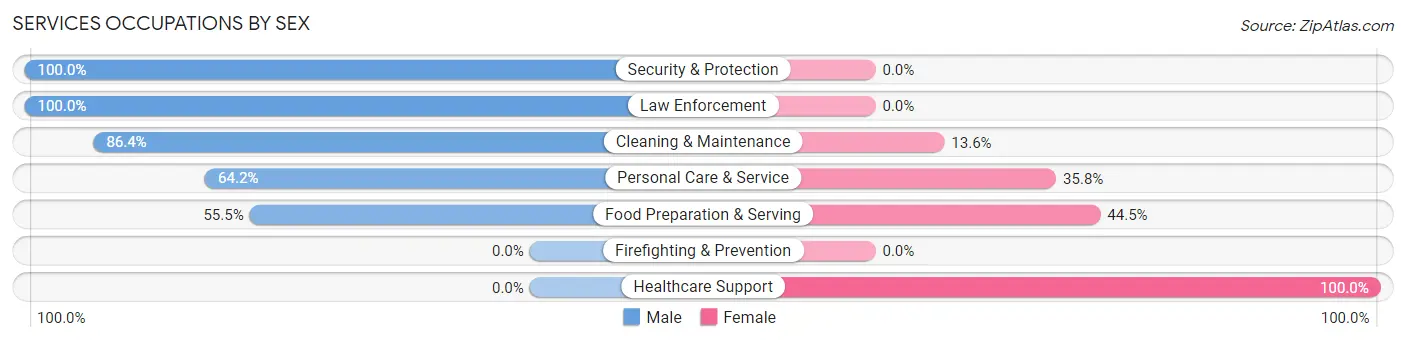
Services Occupations by Sex
Within the Services occupations in Ste Genevieve, the most male-oriented occupations are Security & Protection (100.0%), Law Enforcement (100.0%), and Cleaning & Maintenance (86.4%), while the most female-oriented occupations are Healthcare Support (100.0%), Food Preparation & Serving (44.5%), and Personal Care & Service (35.8%).
| Occupation | Male | Female |
| Healthcare Support | 0 (0.0%) | 30 (100.0%) |
| Security & Protection | 121 (100.0%) | 0 (0.0%) |
| Firefighting & Prevention | 0 (0.0%) | 0 (0.0%) |
| Law Enforcement | 121 (100.0%) | 0 (0.0%) |
| Food Preparation & Serving | 71 (55.5%) | 57 (44.5%) |
| Cleaning & Maintenance | 76 (86.4%) | 12 (13.6%) |
| Personal Care & Service | 106 (64.2%) | 59 (35.8%) |
| Total (Category) | 374 (70.3%) | 158 (29.7%) |
| Total (Overall) | 1,153 (57.6%) | 850 (42.4%) |
Sales and Office Occupations
The most common Sales and Office occupations in Ste Genevieve are Office & Administration (272 | 13.6%), and Sales & Related (136 | 6.8%).

Sales and Office Occupations by Sex

| Occupation | Male | Female |
| Sales & Related | 68 (50.0%) | 68 (50.0%) |
| Office & Administration | 25 (9.2%) | 247 (90.8%) |
| Total (Category) | 93 (22.8%) | 315 (77.2%) |
| Total (Overall) | 1,153 (57.6%) | 850 (42.4%) |
Natural Resources, Construction and Maintenance Occupations
The most common Natural Resources, Construction and Maintenance occupations in Ste Genevieve are Construction & Extraction (89 | 4.4%), and Installation, Maintenance & Repair (37 | 1.8%).
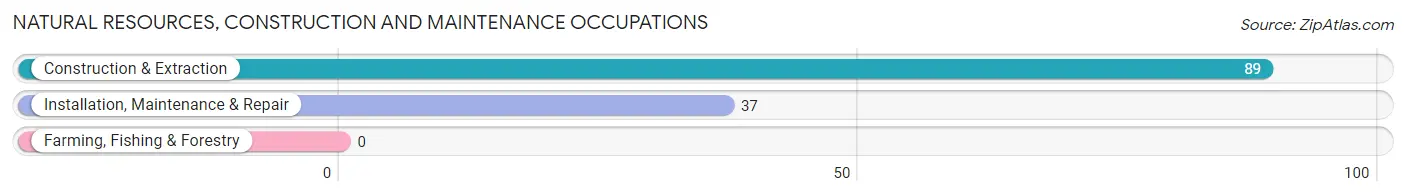
Natural Resources, Construction and Maintenance Occupations by Sex

| Occupation | Male | Female |
| Farming, Fishing & Forestry | 0 (0.0%) | 0 (0.0%) |
| Construction & Extraction | 77 (86.5%) | 12 (13.5%) |
| Installation, Maintenance & Repair | 37 (100.0%) | 0 (0.0%) |
| Total (Category) | 114 (90.5%) | 12 (9.5%) |
| Total (Overall) | 1,153 (57.6%) | 850 (42.4%) |
Production, Transportation and Moving Occupations
The most common Production, Transportation and Moving occupations in Ste Genevieve are Production (248 | 12.4%), Transportation (68 | 3.4%), and Material Moving (55 | 2.8%).
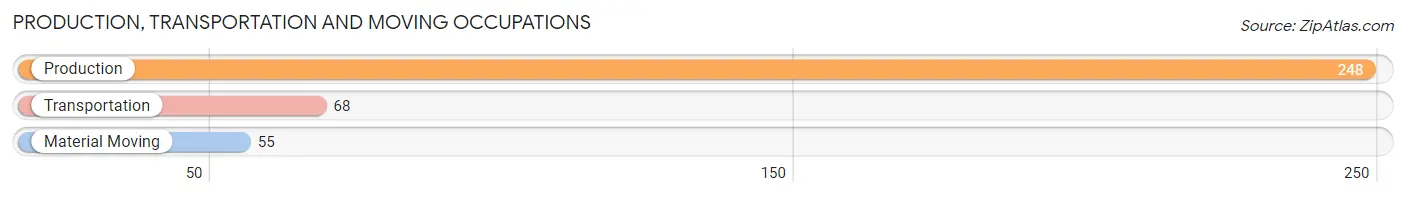
Production, Transportation and Moving Occupations by Sex
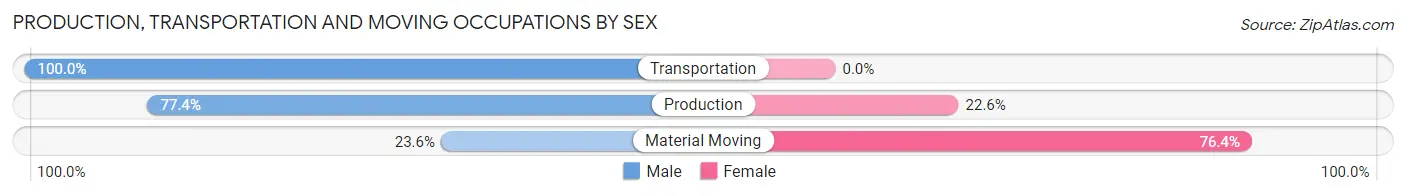
| Occupation | Male | Female |
| Production | 192 (77.4%) | 56 (22.6%) |
| Transportation | 68 (100.0%) | 0 (0.0%) |
| Material Moving | 13 (23.6%) | 42 (76.4%) |
| Total (Category) | 273 (73.6%) | 98 (26.4%) |
| Total (Overall) | 1,153 (57.6%) | 850 (42.4%) |
Employment Industries by Sex in Ste Genevieve
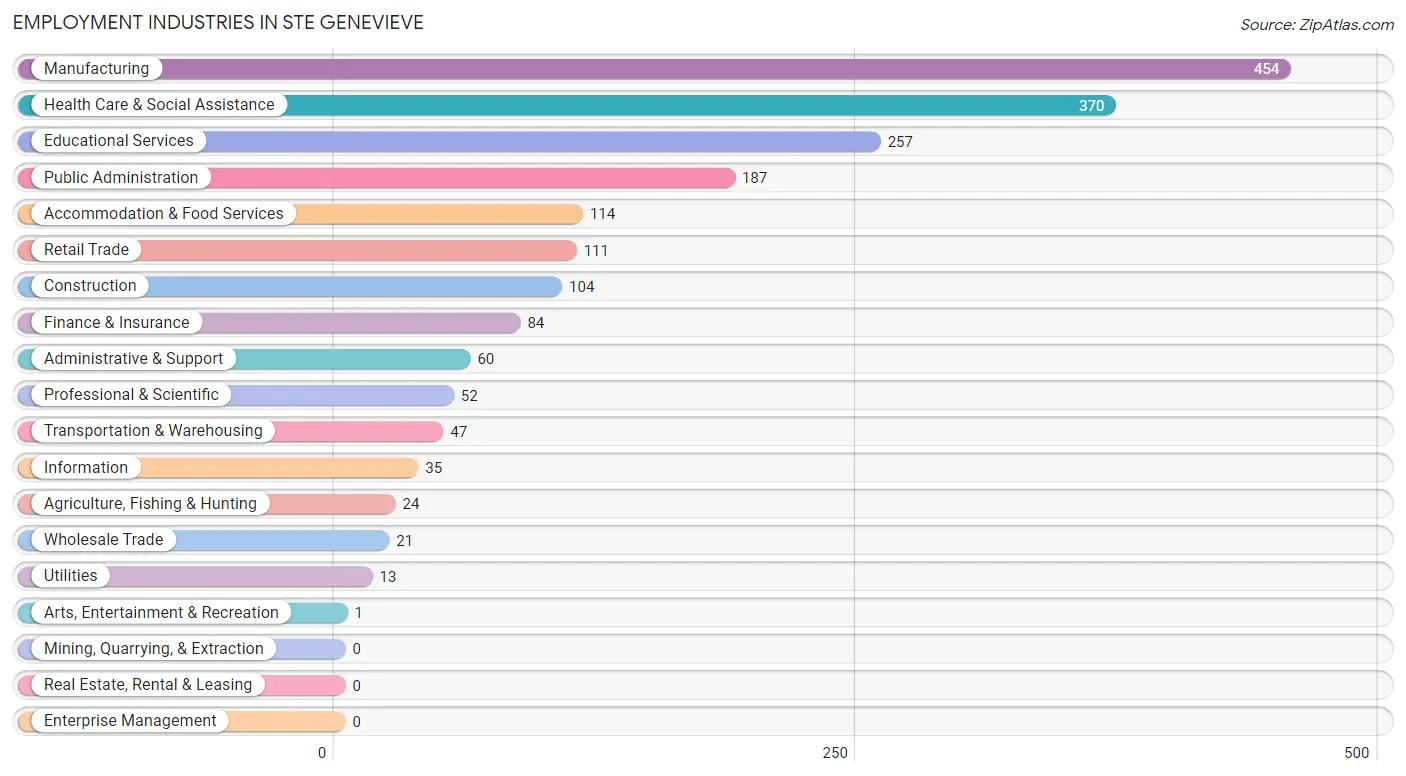
Employment Industries in Ste Genevieve
The major employment industries in Ste Genevieve include Manufacturing (454 | 22.7%), Health Care & Social Assistance (370 | 18.5%), Educational Services (257 | 12.8%), Public Administration (187 | 9.3%), and Accommodation & Food Services (114 | 5.7%).
Employment Industries by Sex in Ste Genevieve
The Ste Genevieve industries that see more men than women are Transportation & Warehousing (100.0%), Utilities (100.0%), and Information (100.0%), whereas the industries that tend to have a higher number of women are Agriculture, Fishing & Hunting (100.0%), Wholesale Trade (100.0%), and Administrative & Support (100.0%).
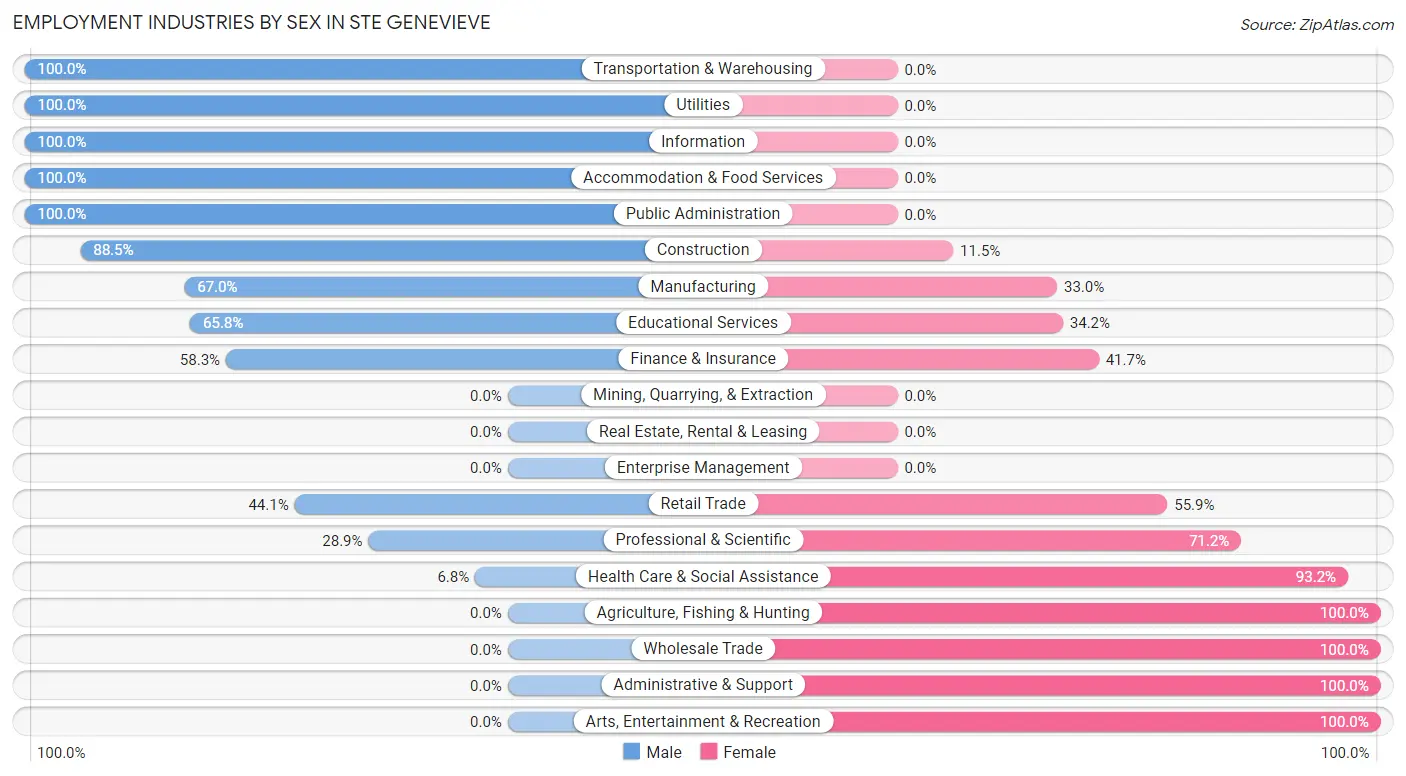
| Industry | Male | Female |
| Agriculture, Fishing & Hunting | 0 (0.0%) | 24 (100.0%) |
| Mining, Quarrying, & Extraction | 0 (0.0%) | 0 (0.0%) |
| Construction | 92 (88.5%) | 12 (11.5%) |
| Manufacturing | 304 (67.0%) | 150 (33.0%) |
| Wholesale Trade | 0 (0.0%) | 21 (100.0%) |
| Retail Trade | 49 (44.1%) | 62 (55.9%) |
| Transportation & Warehousing | 47 (100.0%) | 0 (0.0%) |
| Utilities | 13 (100.0%) | 0 (0.0%) |
| Information | 35 (100.0%) | 0 (0.0%) |
| Finance & Insurance | 49 (58.3%) | 35 (41.7%) |
| Real Estate, Rental & Leasing | 0 (0.0%) | 0 (0.0%) |
| Professional & Scientific | 15 (28.8%) | 37 (71.2%) |
| Enterprise Management | 0 (0.0%) | 0 (0.0%) |
| Administrative & Support | 0 (0.0%) | 60 (100.0%) |
| Educational Services | 169 (65.8%) | 88 (34.2%) |
| Health Care & Social Assistance | 25 (6.8%) | 345 (93.2%) |
| Arts, Entertainment & Recreation | 0 (0.0%) | 1 (100.0%) |
| Accommodation & Food Services | 114 (100.0%) | 0 (0.0%) |
| Public Administration | 187 (100.0%) | 0 (0.0%) |
| Total | 1,153 (57.6%) | 850 (42.4%) |
Education in Ste Genevieve
School Enrollment in Ste Genevieve
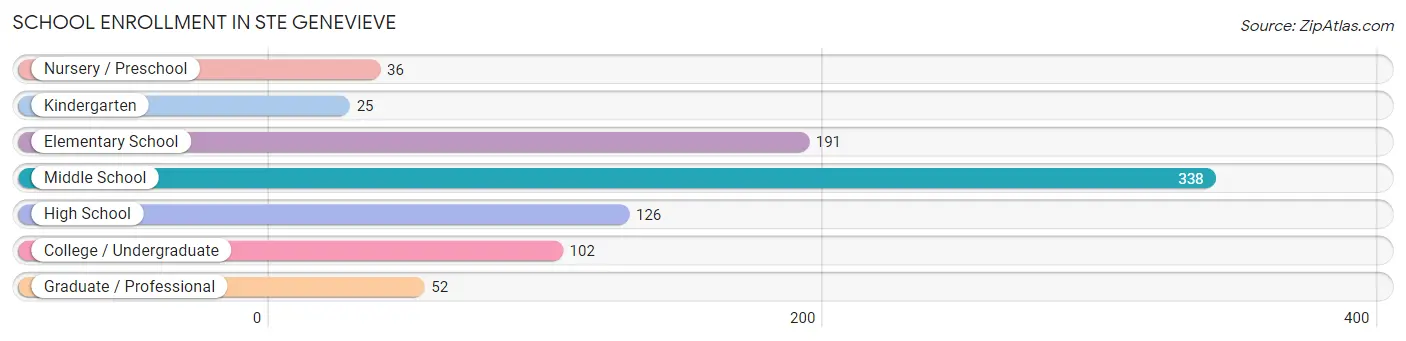
The most common levels of schooling among the 870 students in Ste Genevieve are middle school (338 | 38.9%), elementary school (191 | 22.0%), and high school (126 | 14.5%).
| School Level | # Students | % Students |
| Nursery / Preschool | 36 | 4.1% |
| Kindergarten | 25 | 2.9% |
| Elementary School | 191 | 22.0% |
| Middle School | 338 | 38.9% |
| High School | 126 | 14.5% |
| College / Undergraduate | 102 | 11.7% |
| Graduate / Professional | 52 | 6.0% |
| Total | 870 | 100.0% |
School Enrollment by Age by Funding Source in Ste Genevieve
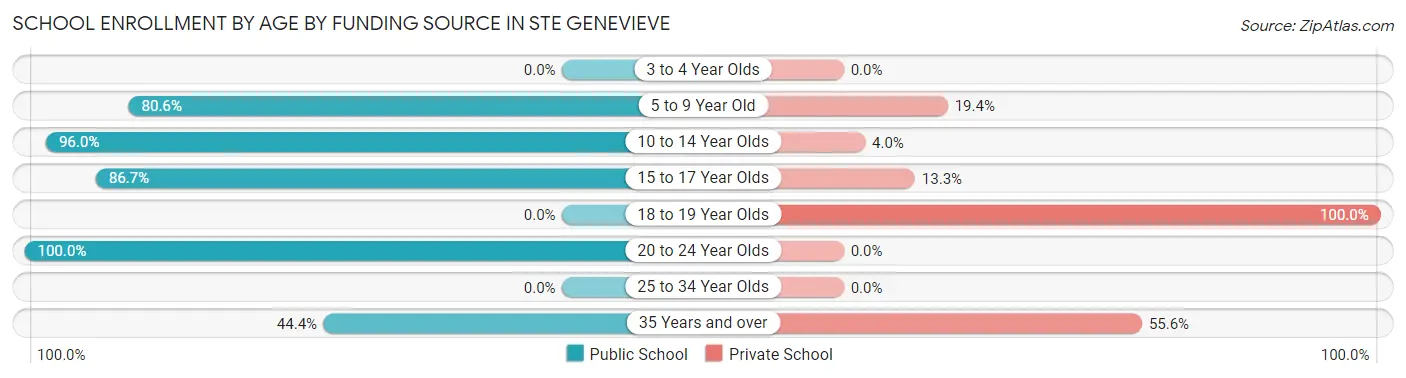
Out of a total of 870 students who are enrolled in schools in Ste Genevieve, 123 (14.1%) attend a private institution, while the remaining 747 (85.9%) are enrolled in public schools. The age group of 18 to 19 year olds has the highest likelihood of being enrolled in private schools, with 34 (100.0% in the age bracket) enrolled. Conversely, the age group of 20 to 24 year olds has the lowest likelihood of being enrolled in a private school, with 93 (100.0% in the age bracket) attending a public institution.
| Age Bracket | Public School | Private School |
| 3 to 4 Year Olds | 0 (0.0%) | 0 (0.0%) |
| 5 to 9 Year Old | 183 (80.6%) | 44 (19.4%) |
| 10 to 14 Year Olds | 361 (96.0%) | 15 (4.0%) |
| 15 to 17 Year Olds | 98 (86.7%) | 15 (13.3%) |
| 18 to 19 Year Olds | 0 (0.0%) | 34 (100.0%) |
| 20 to 24 Year Olds | 93 (100.0%) | 0 (0.0%) |
| 25 to 34 Year Olds | 0 (0.0%) | 0 (0.0%) |
| 35 Years and over | 12 (44.4%) | 15 (55.6%) |
| Total | 747 (85.9%) | 123 (14.1%) |
Educational Attainment by Field of Study in Ste Genevieve
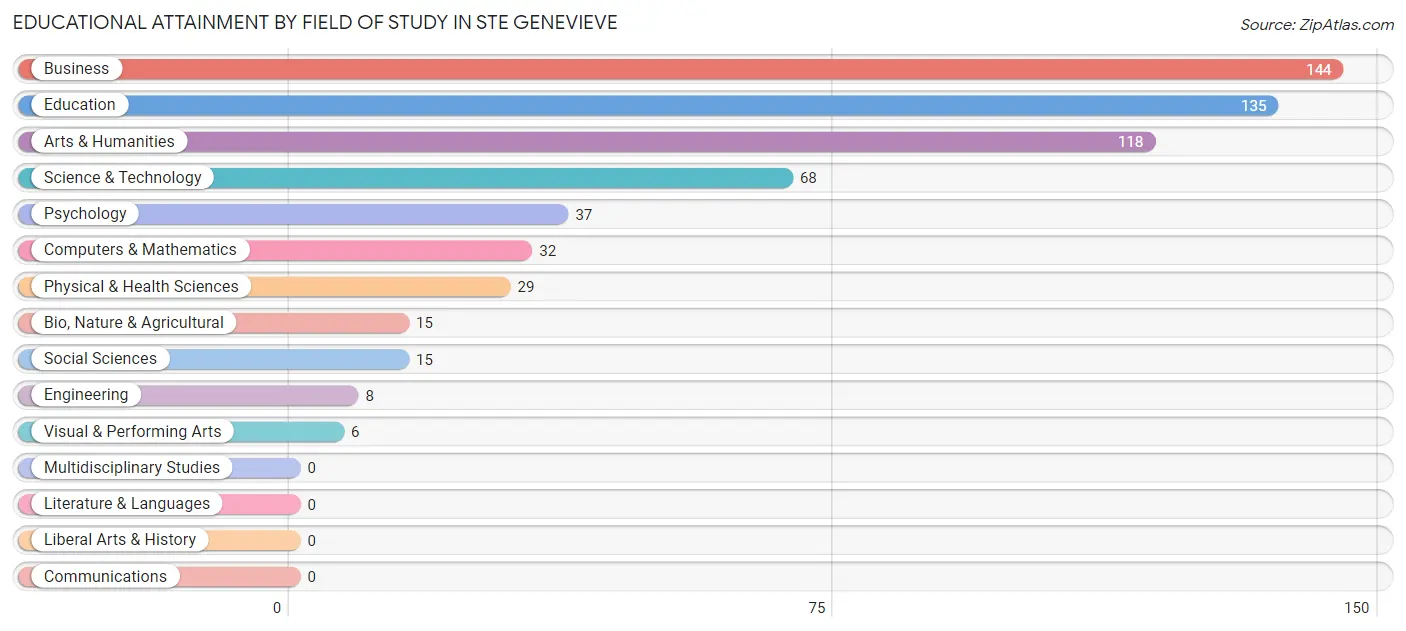
Business (144 | 23.7%), education (135 | 22.2%), arts & humanities (118 | 19.4%), science & technology (68 | 11.2%), and psychology (37 | 6.1%) are the most common fields of study among 607 individuals in Ste Genevieve who have obtained a bachelor's degree or higher.
| Field of Study | # Graduates | % Graduates |
| Computers & Mathematics | 32 | 5.3% |
| Bio, Nature & Agricultural | 15 | 2.5% |
| Physical & Health Sciences | 29 | 4.8% |
| Psychology | 37 | 6.1% |
| Social Sciences | 15 | 2.5% |
| Engineering | 8 | 1.3% |
| Multidisciplinary Studies | 0 | 0.0% |
| Science & Technology | 68 | 11.2% |
| Business | 144 | 23.7% |
| Education | 135 | 22.2% |
| Literature & Languages | 0 | 0.0% |
| Liberal Arts & History | 0 | 0.0% |
| Visual & Performing Arts | 6 | 1.0% |
| Communications | 0 | 0.0% |
| Arts & Humanities | 118 | 19.4% |
| Total | 607 | 100.0% |
Transportation & Commute in Ste Genevieve
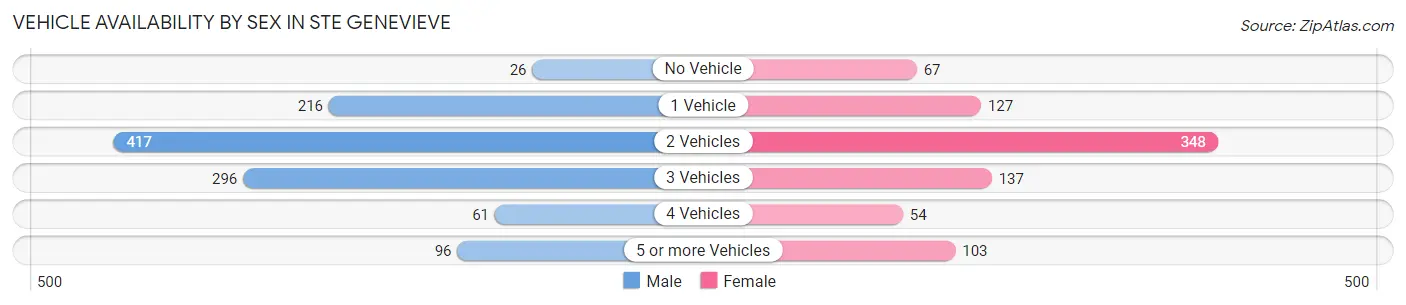
Vehicle Availability by Sex in Ste Genevieve
The most prevalent vehicle ownership categories in Ste Genevieve are males with 2 vehicles (417, accounting for 37.5%) and females with 2 vehicles (348, making up 49.9%).
| Vehicles Available | Male | Female |
| No Vehicle | 26 (2.3%) | 67 (8.0%) |
| 1 Vehicle | 216 (19.4%) | 127 (15.2%) |
| 2 Vehicles | 417 (37.5%) | 348 (41.6%) |
| 3 Vehicles | 296 (26.6%) | 137 (16.4%) |
| 4 Vehicles | 61 (5.5%) | 54 (6.5%) |
| 5 or more Vehicles | 96 (8.6%) | 103 (12.3%) |
| Total | 1,112 (100.0%) | 836 (100.0%) |
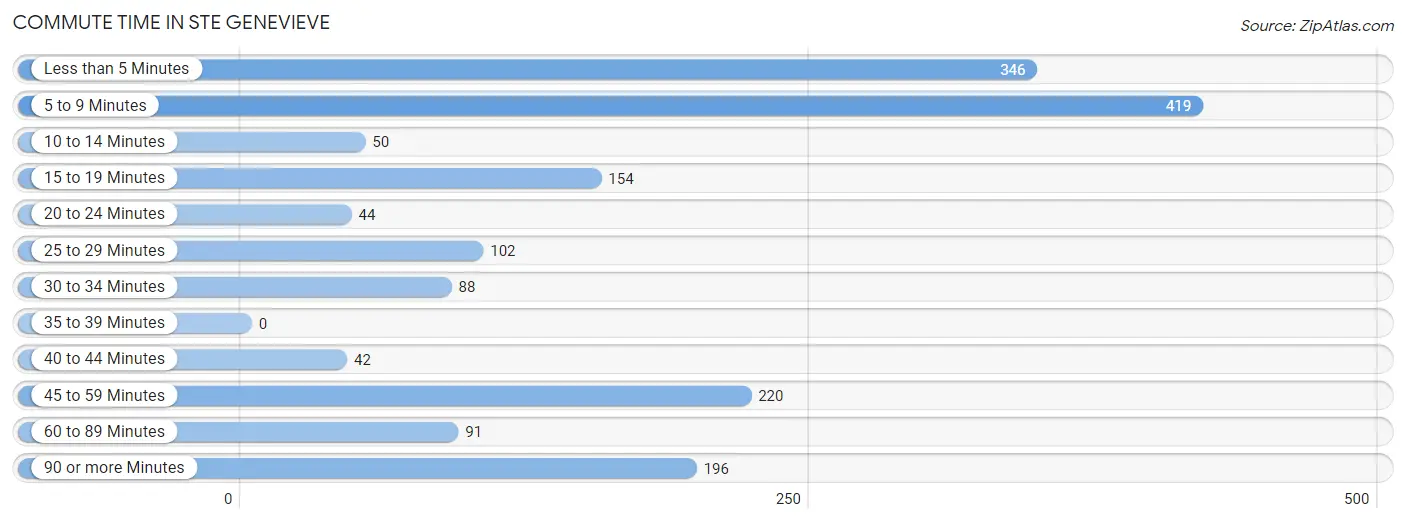
Commute Time in Ste Genevieve
The most frequently occuring commute durations in Ste Genevieve are 5 to 9 minutes (419 commuters, 23.9%), less than 5 minutes (346 commuters, 19.8%), and 45 to 59 minutes (220 commuters, 12.6%).
| Commute Time | # Commuters | % Commuters |
| Less than 5 Minutes | 346 | 19.8% |
| 5 to 9 Minutes | 419 | 23.9% |
| 10 to 14 Minutes | 50 | 2.9% |
| 15 to 19 Minutes | 154 | 8.8% |
| 20 to 24 Minutes | 44 | 2.5% |
| 25 to 29 Minutes | 102 | 5.8% |
| 30 to 34 Minutes | 88 | 5.0% |
| 35 to 39 Minutes | 0 | 0.0% |
| 40 to 44 Minutes | 42 | 2.4% |
| 45 to 59 Minutes | 220 | 12.6% |
| 60 to 89 Minutes | 91 | 5.2% |
| 90 or more Minutes | 196 | 11.2% |
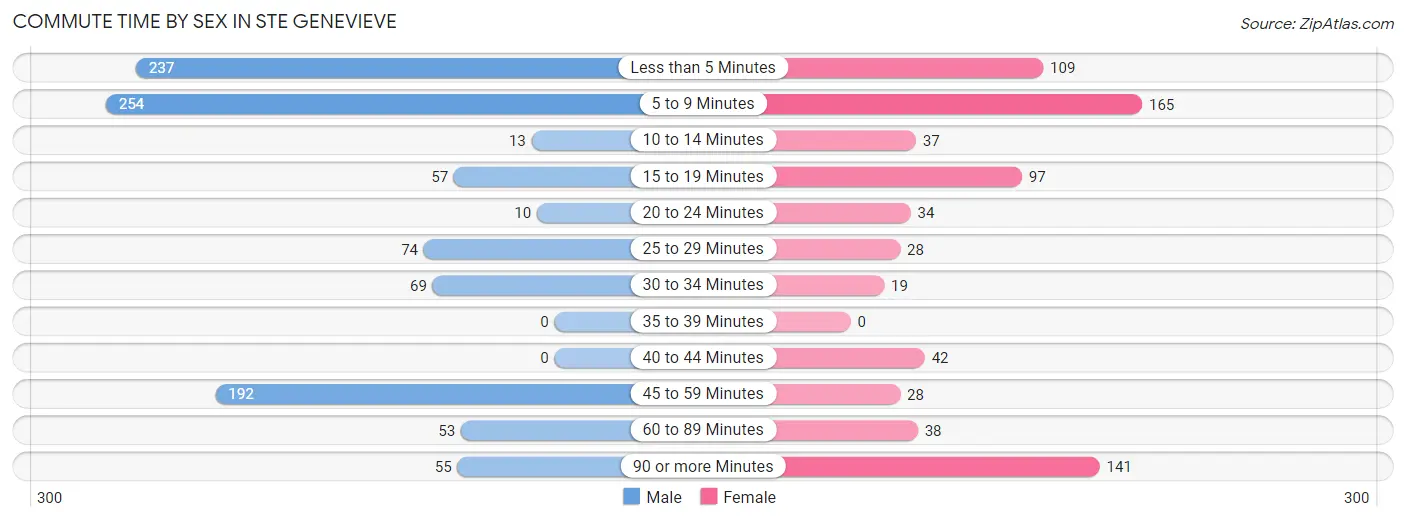
Commute Time by Sex in Ste Genevieve
The most common commute times in Ste Genevieve are 5 to 9 minutes (254 commuters, 25.1%) for males and 5 to 9 minutes (165 commuters, 22.4%) for females.
| Commute Time | Male | Female |
| Less than 5 Minutes | 237 (23.4%) | 109 (14.8%) |
| 5 to 9 Minutes | 254 (25.1%) | 165 (22.4%) |
| 10 to 14 Minutes | 13 (1.3%) | 37 (5.0%) |
| 15 to 19 Minutes | 57 (5.6%) | 97 (13.1%) |
| 20 to 24 Minutes | 10 (1.0%) | 34 (4.6%) |
| 25 to 29 Minutes | 74 (7.3%) | 28 (3.8%) |
| 30 to 34 Minutes | 69 (6.8%) | 19 (2.6%) |
| 35 to 39 Minutes | 0 (0.0%) | 0 (0.0%) |
| 40 to 44 Minutes | 0 (0.0%) | 42 (5.7%) |
| 45 to 59 Minutes | 192 (18.9%) | 28 (3.8%) |
| 60 to 89 Minutes | 53 (5.2%) | 38 (5.1%) |
| 90 or more Minutes | 55 (5.4%) | 141 (19.1%) |
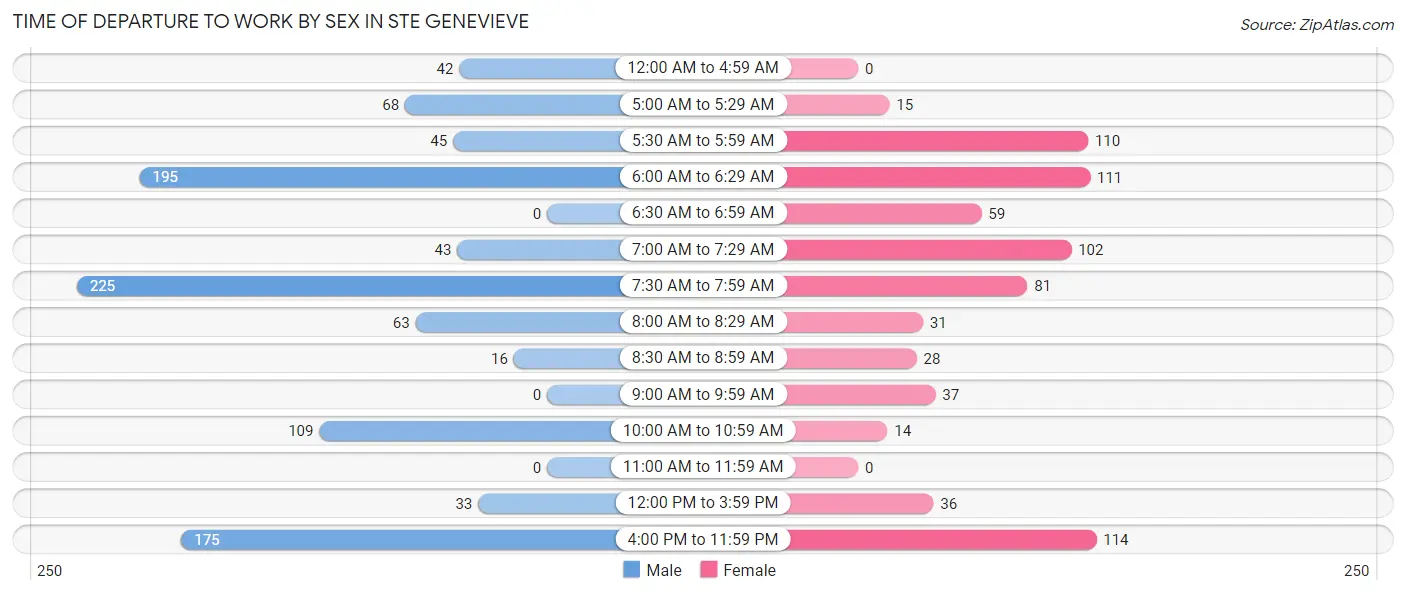
Time of Departure to Work by Sex in Ste Genevieve
The most frequent times of departure to work in Ste Genevieve are 7:30 AM to 7:59 AM (225, 22.2%) for males and 4:00 PM to 11:59 PM (114, 15.4%) for females.
| Time of Departure | Male | Female |
| 12:00 AM to 4:59 AM | 42 (4.1%) | 0 (0.0%) |
| 5:00 AM to 5:29 AM | 68 (6.7%) | 15 (2.0%) |
| 5:30 AM to 5:59 AM | 45 (4.4%) | 110 (14.9%) |
| 6:00 AM to 6:29 AM | 195 (19.2%) | 111 (15.0%) |
| 6:30 AM to 6:59 AM | 0 (0.0%) | 59 (8.0%) |
| 7:00 AM to 7:29 AM | 43 (4.2%) | 102 (13.8%) |
| 7:30 AM to 7:59 AM | 225 (22.2%) | 81 (11.0%) |
| 8:00 AM to 8:29 AM | 63 (6.2%) | 31 (4.2%) |
| 8:30 AM to 8:59 AM | 16 (1.6%) | 28 (3.8%) |
| 9:00 AM to 9:59 AM | 0 (0.0%) | 37 (5.0%) |
| 10:00 AM to 10:59 AM | 109 (10.7%) | 14 (1.9%) |
| 11:00 AM to 11:59 AM | 0 (0.0%) | 0 (0.0%) |
| 12:00 PM to 3:59 PM | 33 (3.3%) | 36 (4.9%) |
| 4:00 PM to 11:59 PM | 175 (17.3%) | 114 (15.4%) |
| Total | 1,014 (100.0%) | 738 (100.0%) |
Housing Occupancy in Ste Genevieve
Occupancy by Ownership in Ste Genevieve
Of the total 1,955 dwellings in Ste Genevieve, owner-occupied units account for 1,240 (63.4%), while renter-occupied units make up 715 (36.6%).
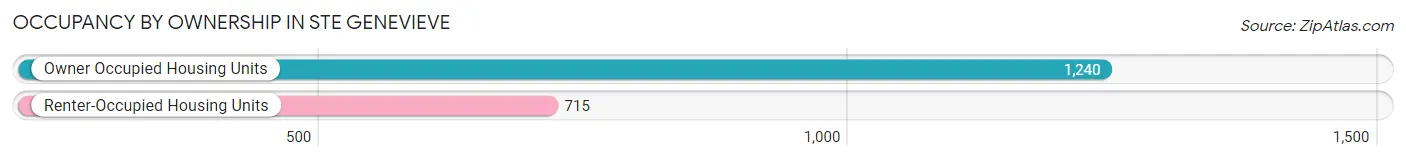
| Occupancy | # Housing Units | % Housing Units |
| Owner Occupied Housing Units | 1,240 | 63.4% |
| Renter-Occupied Housing Units | 715 | 36.6% |
| Total Occupied Housing Units | 1,955 | 100.0% |
Occupancy by Household Size in Ste Genevieve
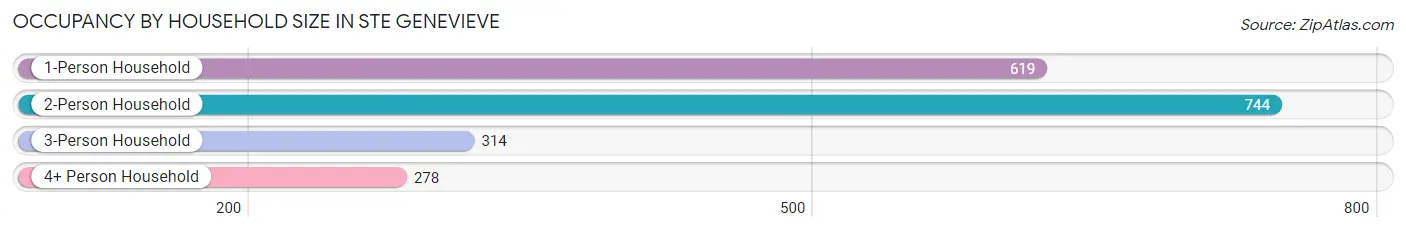
| Household Size | # Housing Units | % Housing Units |
| 1-Person Household | 619 | 31.7% |
| 2-Person Household | 744 | 38.1% |
| 3-Person Household | 314 | 16.1% |
| 4+ Person Household | 278 | 14.2% |
| Total Housing Units | 1,955 | 100.0% |
Occupancy by Ownership by Household Size in Ste Genevieve
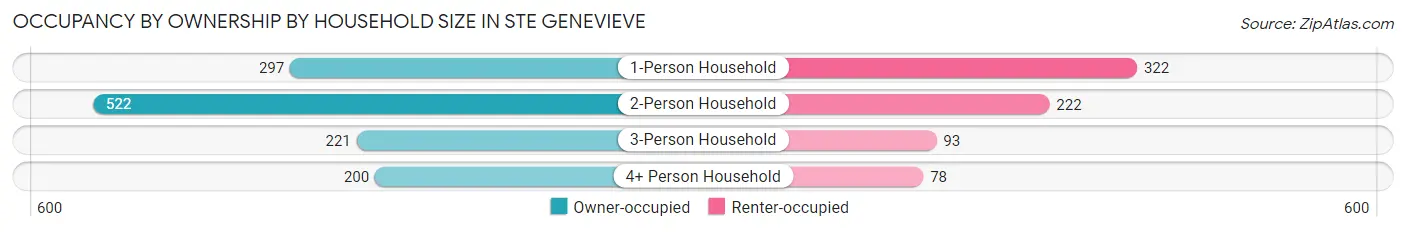
| Household Size | Owner-occupied | Renter-occupied |
| 1-Person Household | 297 (48.0%) | 322 (52.0%) |
| 2-Person Household | 522 (70.2%) | 222 (29.8%) |
| 3-Person Household | 221 (70.4%) | 93 (29.6%) |
| 4+ Person Household | 200 (71.9%) | 78 (28.1%) |
| Total Housing Units | 1,240 (63.4%) | 715 (36.6%) |
Occupancy by Educational Attainment in Ste Genevieve
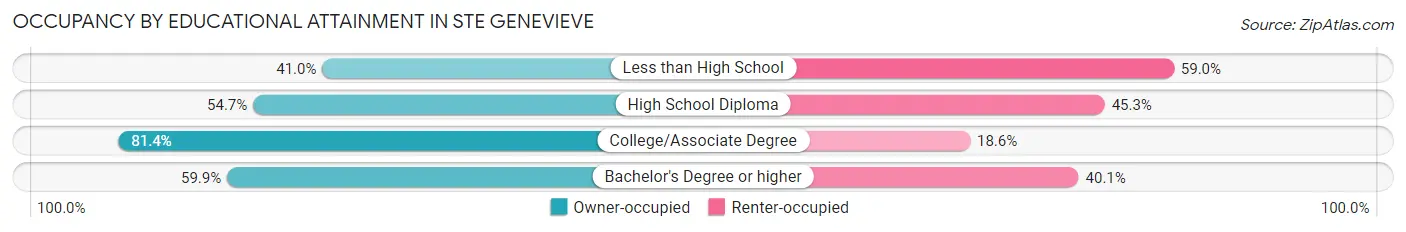
| Household Size | Owner-occupied | Renter-occupied |
| Less than High School | 50 (41.0%) | 72 (59.0%) |
| High School Diploma | 426 (54.7%) | 353 (45.3%) |
| College/Associate Degree | 503 (81.4%) | 115 (18.6%) |
| Bachelor's Degree or higher | 261 (59.9%) | 175 (40.1%) |
Occupancy by Age of Householder in Ste Genevieve
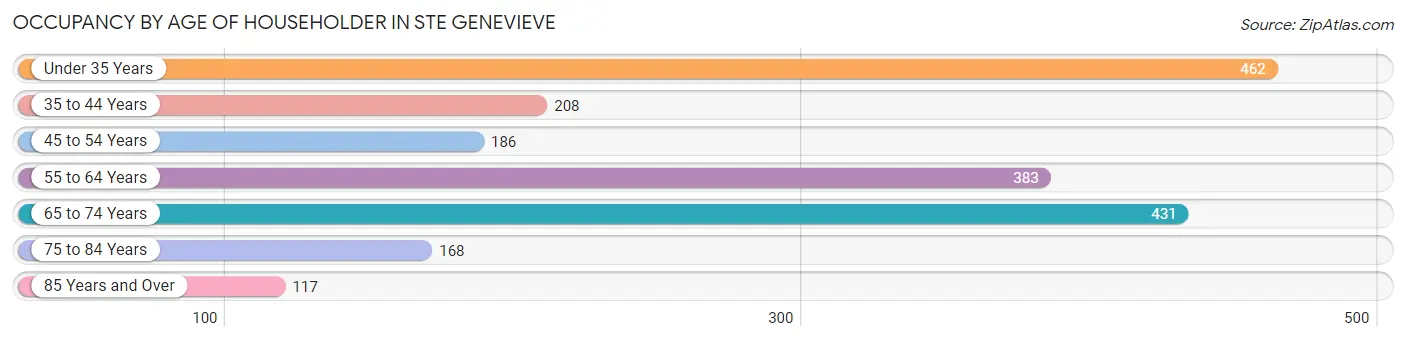
| Age Bracket | # Households | % Households |
| Under 35 Years | 462 | 23.6% |
| 35 to 44 Years | 208 | 10.6% |
| 45 to 54 Years | 186 | 9.5% |
| 55 to 64 Years | 383 | 19.6% |
| 65 to 74 Years | 431 | 22.1% |
| 75 to 84 Years | 168 | 8.6% |
| 85 Years and Over | 117 | 6.0% |
| Total | 1,955 | 100.0% |
Housing Finances in Ste Genevieve
Median Income by Occupancy in Ste Genevieve
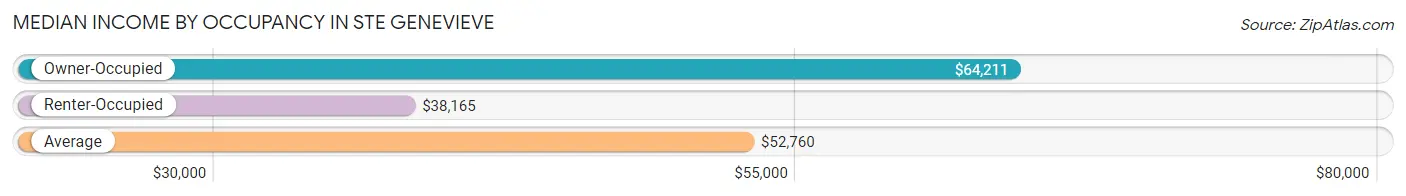
| Occupancy Type | # Households | Median Income |
| Owner-Occupied | 1,240 (63.4%) | $64,211 |
| Renter-Occupied | 715 (36.6%) | $38,165 |
| Average | 1,955 (100.0%) | $52,760 |
Occupancy by Householder Income Bracket in Ste Genevieve
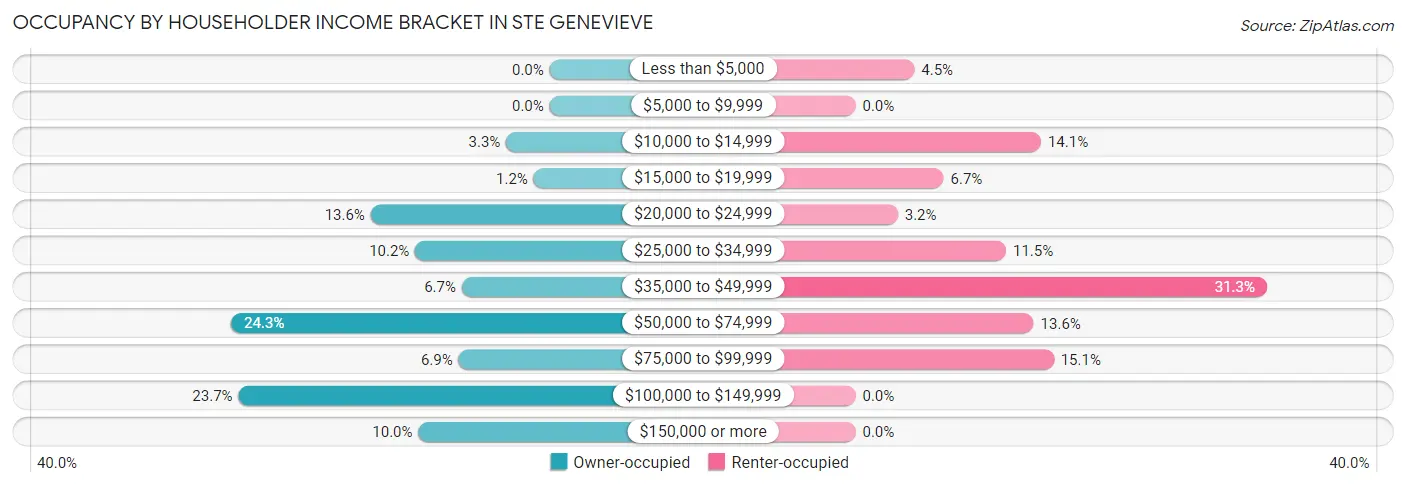
| Income Bracket | Owner-occupied | Renter-occupied |
| Less than $5,000 | 0 (0.0%) | 32 (4.5%) |
| $5,000 to $9,999 | 0 (0.0%) | 0 (0.0%) |
| $10,000 to $14,999 | 41 (3.3%) | 101 (14.1%) |
| $15,000 to $19,999 | 15 (1.2%) | 48 (6.7%) |
| $20,000 to $24,999 | 169 (13.6%) | 23 (3.2%) |
| $25,000 to $34,999 | 127 (10.2%) | 82 (11.5%) |
| $35,000 to $49,999 | 83 (6.7%) | 224 (31.3%) |
| $50,000 to $74,999 | 301 (24.3%) | 97 (13.6%) |
| $75,000 to $99,999 | 86 (6.9%) | 108 (15.1%) |
| $100,000 to $149,999 | 294 (23.7%) | 0 (0.0%) |
| $150,000 or more | 124 (10.0%) | 0 (0.0%) |
| Total | 1,240 (100.0%) | 715 (100.0%) |
Monthly Housing Cost Tiers in Ste Genevieve
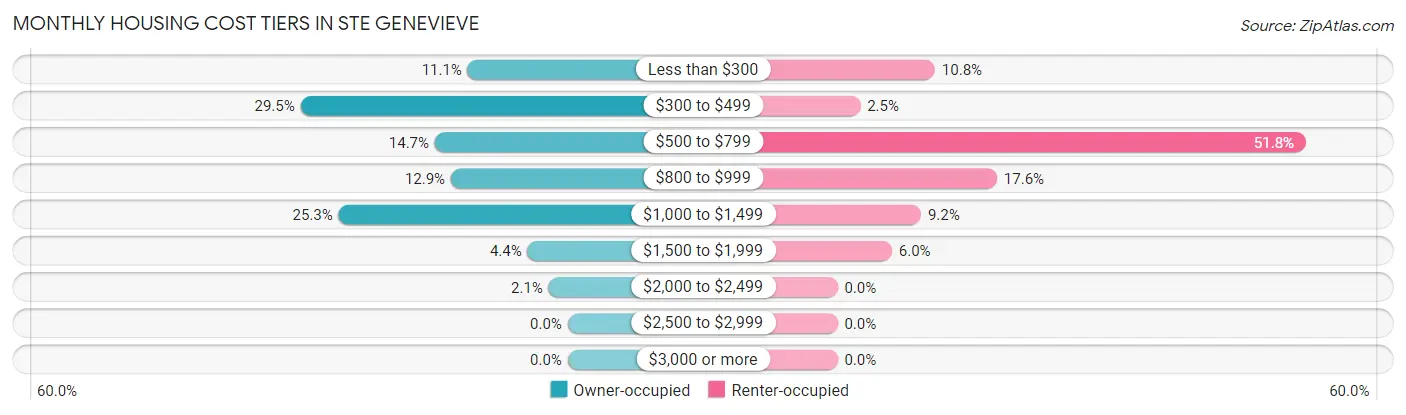
| Monthly Cost | Owner-occupied | Renter-occupied |
| Less than $300 | 137 (11.1%) | 77 (10.8%) |
| $300 to $499 | 366 (29.5%) | 18 (2.5%) |
| $500 to $799 | 182 (14.7%) | 370 (51.7%) |
| $800 to $999 | 160 (12.9%) | 126 (17.6%) |
| $1,000 to $1,499 | 314 (25.3%) | 66 (9.2%) |
| $1,500 to $1,999 | 55 (4.4%) | 43 (6.0%) |
| $2,000 to $2,499 | 26 (2.1%) | 0 (0.0%) |
| $2,500 to $2,999 | 0 (0.0%) | 0 (0.0%) |
| $3,000 or more | 0 (0.0%) | 0 (0.0%) |
| Total | 1,240 (100.0%) | 715 (100.0%) |
Physical Housing Characteristics in Ste Genevieve
Housing Structures in Ste Genevieve
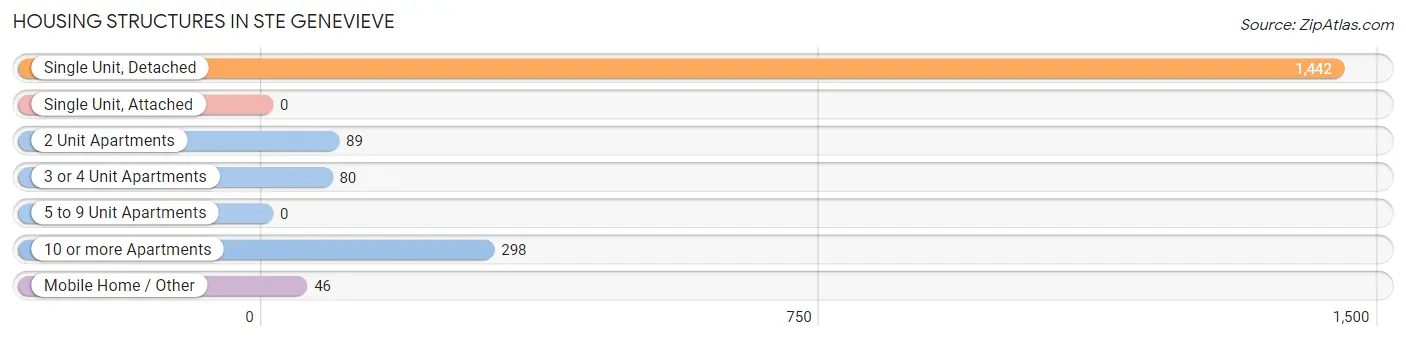
| Structure Type | # Housing Units | % Housing Units |
| Single Unit, Detached | 1,442 | 73.8% |
| Single Unit, Attached | 0 | 0.0% |
| 2 Unit Apartments | 89 | 4.5% |
| 3 or 4 Unit Apartments | 80 | 4.1% |
| 5 to 9 Unit Apartments | 0 | 0.0% |
| 10 or more Apartments | 298 | 15.2% |
| Mobile Home / Other | 46 | 2.4% |
| Total | 1,955 | 100.0% |
Housing Structures by Occupancy in Ste Genevieve
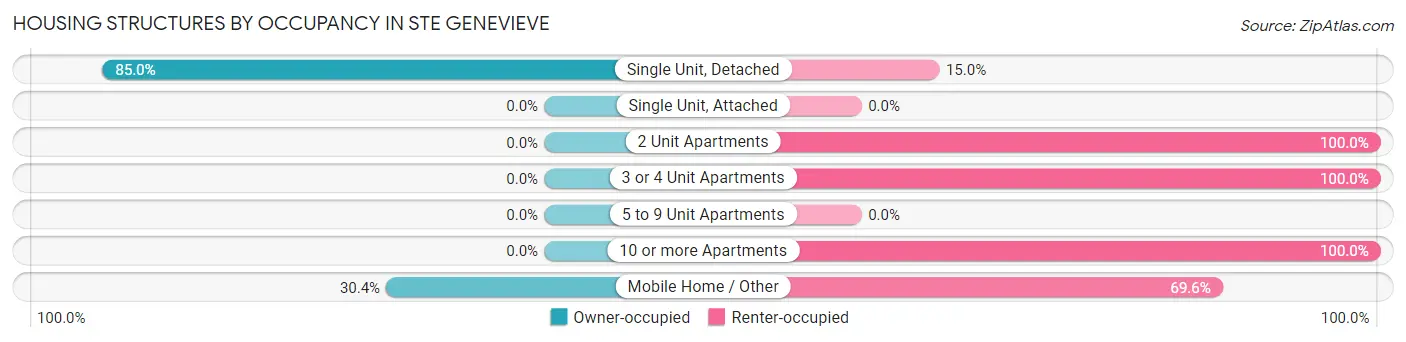
| Structure Type | Owner-occupied | Renter-occupied |
| Single Unit, Detached | 1,226 (85.0%) | 216 (15.0%) |
| Single Unit, Attached | 0 (0.0%) | 0 (0.0%) |
| 2 Unit Apartments | 0 (0.0%) | 89 (100.0%) |
| 3 or 4 Unit Apartments | 0 (0.0%) | 80 (100.0%) |
| 5 to 9 Unit Apartments | 0 (0.0%) | 0 (0.0%) |
| 10 or more Apartments | 0 (0.0%) | 298 (100.0%) |
| Mobile Home / Other | 14 (30.4%) | 32 (69.6%) |
| Total | 1,240 (63.4%) | 715 (36.6%) |
Housing Structures by Number of Rooms in Ste Genevieve
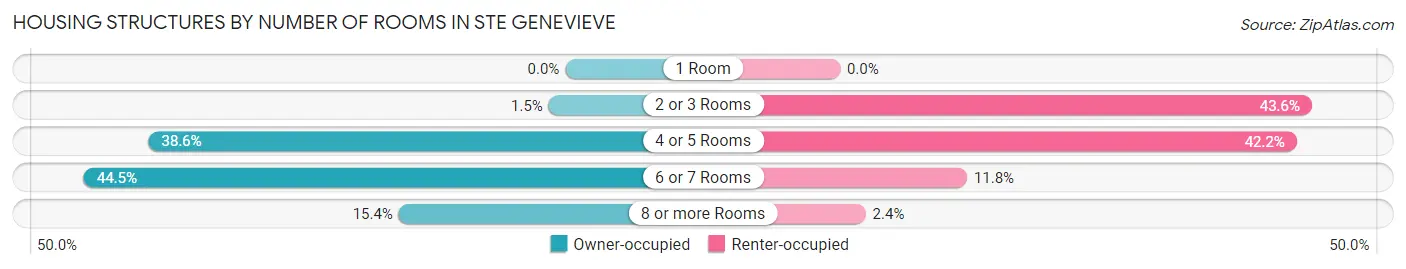
| Number of Rooms | Owner-occupied | Renter-occupied |
| 1 Room | 0 (0.0%) | 0 (0.0%) |
| 2 or 3 Rooms | 19 (1.5%) | 312 (43.6%) |
| 4 or 5 Rooms | 478 (38.6%) | 302 (42.2%) |
| 6 or 7 Rooms | 552 (44.5%) | 84 (11.7%) |
| 8 or more Rooms | 191 (15.4%) | 17 (2.4%) |
| Total | 1,240 (100.0%) | 715 (100.0%) |
Housing Structure by Heating Type in Ste Genevieve
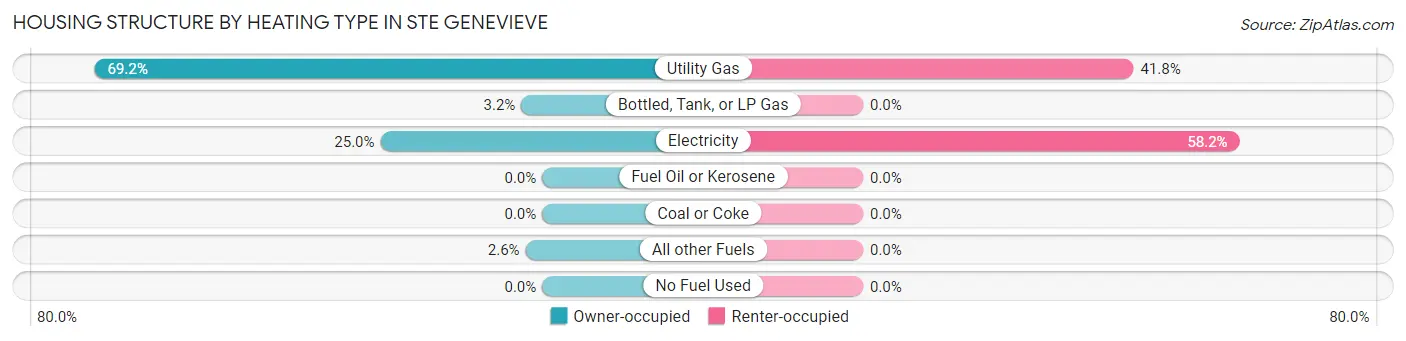
| Heating Type | Owner-occupied | Renter-occupied |
| Utility Gas | 858 (69.2%) | 299 (41.8%) |
| Bottled, Tank, or LP Gas | 40 (3.2%) | 0 (0.0%) |
| Electricity | 310 (25.0%) | 416 (58.2%) |
| Fuel Oil or Kerosene | 0 (0.0%) | 0 (0.0%) |
| Coal or Coke | 0 (0.0%) | 0 (0.0%) |
| All other Fuels | 32 (2.6%) | 0 (0.0%) |
| No Fuel Used | 0 (0.0%) | 0 (0.0%) |
| Total | 1,240 (100.0%) | 715 (100.0%) |
Household Vehicle Usage in Ste Genevieve
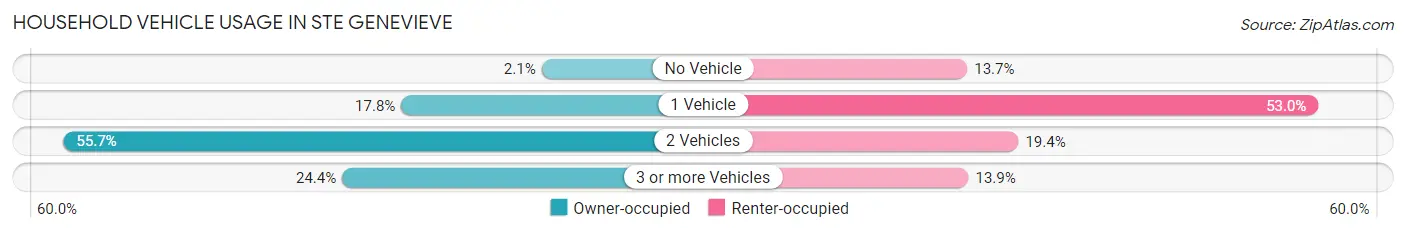
| Vehicles per Household | Owner-occupied | Renter-occupied |
| No Vehicle | 26 (2.1%) | 98 (13.7%) |
| 1 Vehicle | 221 (17.8%) | 379 (53.0%) |
| 2 Vehicles | 690 (55.6%) | 139 (19.4%) |
| 3 or more Vehicles | 303 (24.4%) | 99 (13.9%) |
| Total | 1,240 (100.0%) | 715 (100.0%) |
Real Estate & Mortgages in Ste Genevieve
Real Estate and Mortgage Overview in Ste Genevieve
| Characteristic | Without Mortgage | With Mortgage |
| Housing Units | 698 | 542 |
| Median Property Value | $186,800 | $148,100 |
| Median Household Income | $34,605 | $54 |
| Monthly Housing Costs | $400 | $0 |
| Real Estate Taxes | $1,327 | $0 |
Property Value by Mortgage Status in Ste Genevieve
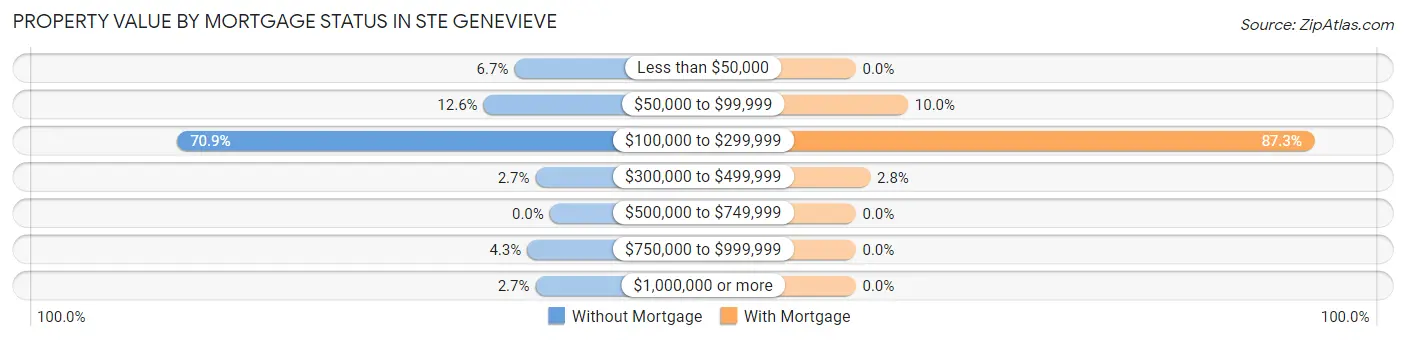
| Property Value | Without Mortgage | With Mortgage |
| Less than $50,000 | 47 (6.7%) | 0 (0.0%) |
| $50,000 to $99,999 | 88 (12.6%) | 54 (10.0%) |
| $100,000 to $299,999 | 495 (70.9%) | 473 (87.3%) |
| $300,000 to $499,999 | 19 (2.7%) | 15 (2.8%) |
| $500,000 to $749,999 | 0 (0.0%) | 0 (0.0%) |
| $750,000 to $999,999 | 30 (4.3%) | 0 (0.0%) |
| $1,000,000 or more | 19 (2.7%) | 0 (0.0%) |
| Total | 698 (100.0%) | 542 (100.0%) |
Household Income by Mortgage Status in Ste Genevieve
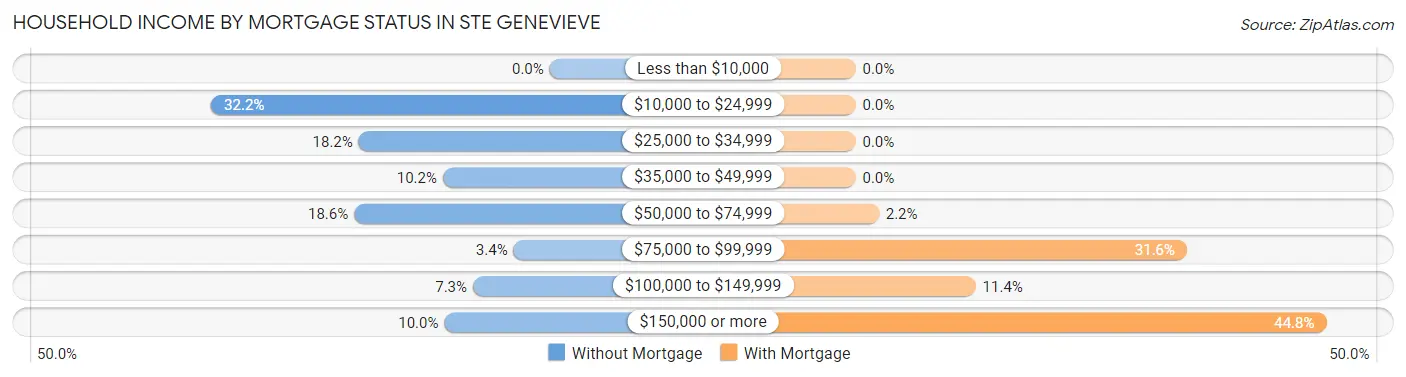
| Household Income | Without Mortgage | With Mortgage |
| Less than $10,000 | 0 (0.0%) | 0 (0.0%) |
| $10,000 to $24,999 | 225 (32.2%) | 0 (0.0%) |
| $25,000 to $34,999 | 127 (18.2%) | 0 (0.0%) |
| $35,000 to $49,999 | 71 (10.2%) | 0 (0.0%) |
| $50,000 to $74,999 | 130 (18.6%) | 12 (2.2%) |
| $75,000 to $99,999 | 24 (3.4%) | 171 (31.6%) |
| $100,000 to $149,999 | 51 (7.3%) | 62 (11.4%) |
| $150,000 or more | 70 (10.0%) | 243 (44.8%) |
| Total | 698 (100.0%) | 542 (100.0%) |
Property Value to Household Income Ratio in Ste Genevieve
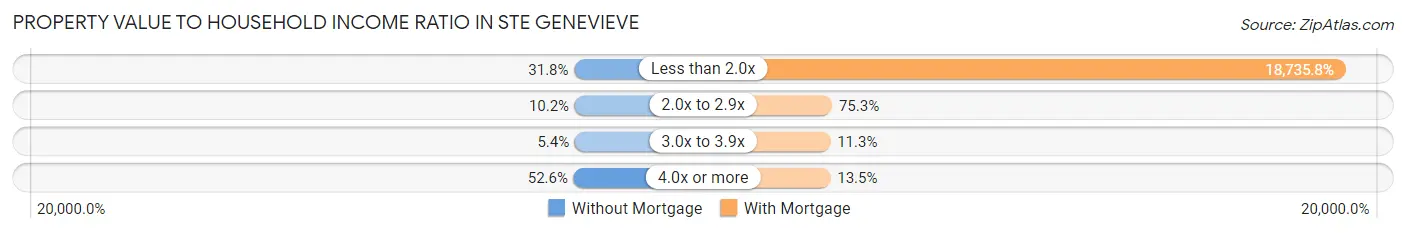
| Value-to-Income Ratio | Without Mortgage | With Mortgage |
| Less than 2.0x | 222 (31.8%) | 101,548 (18,735.8%) |
| 2.0x to 2.9x | 71 (10.2%) | 408 (75.3%) |
| 3.0x to 3.9x | 38 (5.4%) | 61 (11.3%) |
| 4.0x or more | 367 (52.6%) | 73 (13.5%) |
| Total | 698 (100.0%) | 542 (100.0%) |
Real Estate Taxes by Mortgage Status in Ste Genevieve
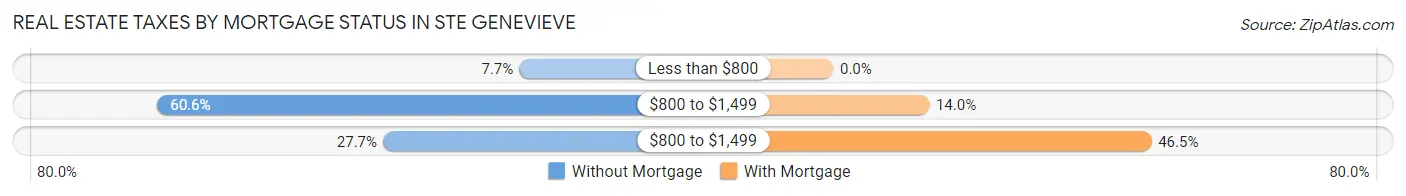
| Property Taxes | Without Mortgage | With Mortgage |
| Less than $800 | 54 (7.7%) | 0 (0.0%) |
| $800 to $1,499 | 423 (60.6%) | 76 (14.0%) |
| $800 to $1,499 | 193 (27.7%) | 252 (46.5%) |
| Total | 698 (100.0%) | 542 (100.0%) |
Health & Disability in Ste Genevieve
Health Insurance Coverage by Age in Ste Genevieve
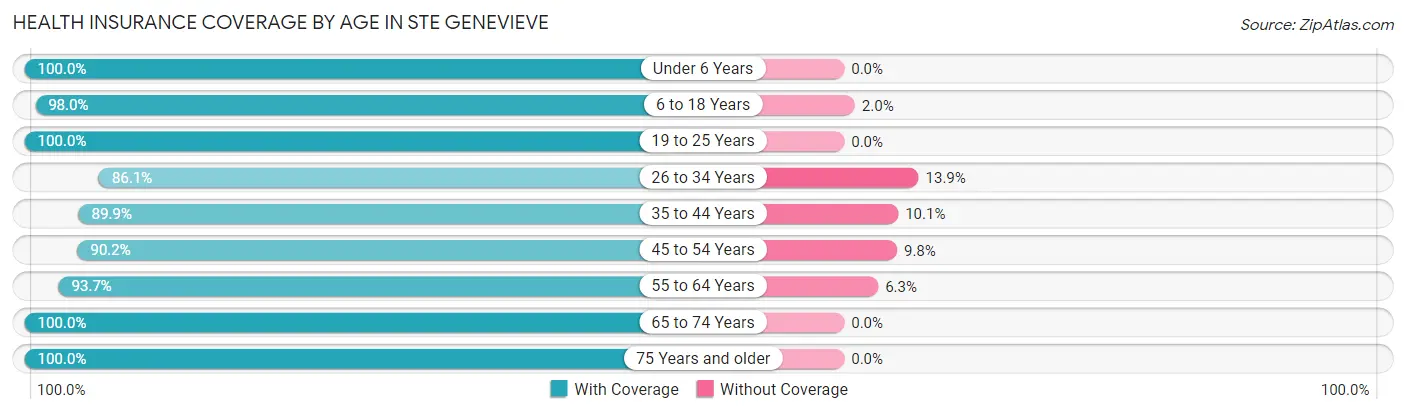
| Age Bracket | With Coverage | Without Coverage |
| Under 6 Years | 271 (100.0%) | 0 (0.0%) |
| 6 to 18 Years | 642 (98.0%) | 13 (2.0%) |
| 19 to 25 Years | 455 (100.0%) | 0 (0.0%) |
| 26 to 34 Years | 584 (86.1%) | 94 (13.9%) |
| 35 to 44 Years | 304 (89.9%) | 34 (10.1%) |
| 45 to 54 Years | 403 (90.2%) | 44 (9.8%) |
| 55 to 64 Years | 697 (93.7%) | 47 (6.3%) |
| 65 to 74 Years | 538 (100.0%) | 0 (0.0%) |
| 75 Years and older | 510 (100.0%) | 0 (0.0%) |
| Total | 4,404 (95.0%) | 232 (5.0%) |
Health Insurance Coverage by Citizenship Status in Ste Genevieve

| Citizenship Status | With Coverage | Without Coverage |
| Native Born | 271 (100.0%) | 0 (0.0%) |
| Foreign Born, Citizen | 642 (98.0%) | 13 (2.0%) |
| Foreign Born, not a Citizen | 455 (100.0%) | 0 (0.0%) |
Health Insurance Coverage by Household Income in Ste Genevieve
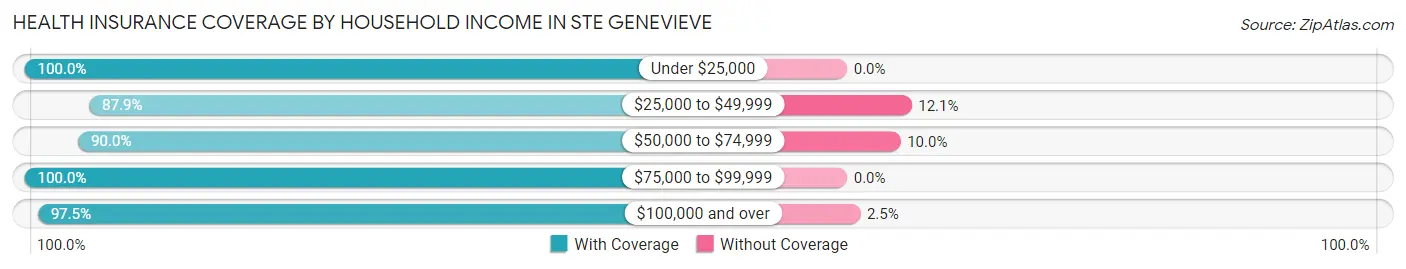
| Household Income | With Coverage | Without Coverage |
| Under $25,000 | 628 (100.0%) | 0 (0.0%) |
| $25,000 to $49,999 | 829 (87.9%) | 114 (12.1%) |
| $50,000 to $74,999 | 755 (90.0%) | 84 (10.0%) |
| $75,000 to $99,999 | 802 (100.0%) | 0 (0.0%) |
| $100,000 and over | 1,343 (97.5%) | 34 (2.5%) |
Public vs Private Health Insurance Coverage by Age in Ste Genevieve
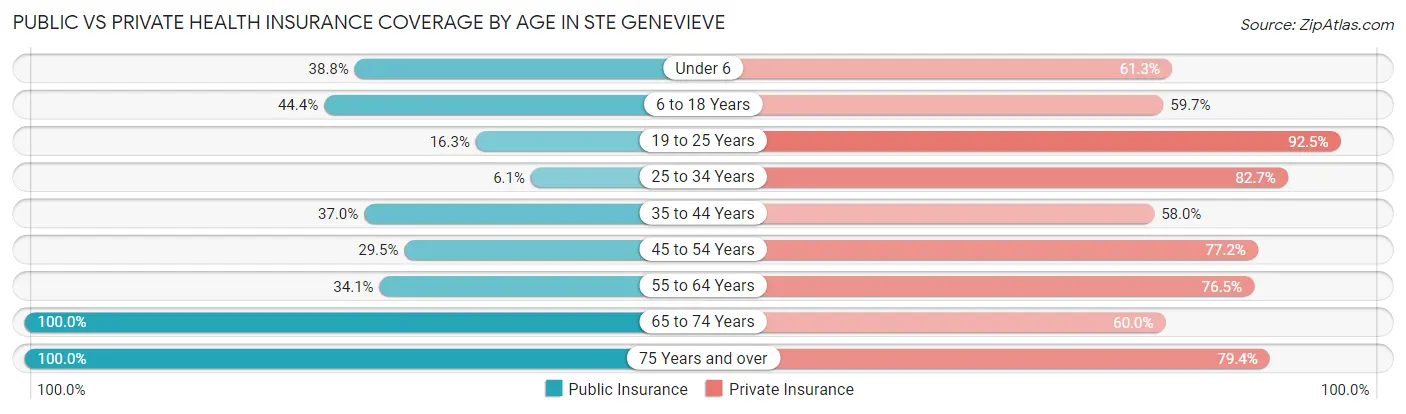
| Age Bracket | Public Insurance | Private Insurance |
| Under 6 | 105 (38.8%) | 166 (61.3%) |
| 6 to 18 Years | 291 (44.4%) | 391 (59.7%) |
| 19 to 25 Years | 74 (16.3%) | 421 (92.5%) |
| 25 to 34 Years | 41 (6.0%) | 561 (82.7%) |
| 35 to 44 Years | 125 (37.0%) | 196 (58.0%) |
| 45 to 54 Years | 132 (29.5%) | 345 (77.2%) |
| 55 to 64 Years | 254 (34.1%) | 569 (76.5%) |
| 65 to 74 Years | 538 (100.0%) | 323 (60.0%) |
| 75 Years and over | 510 (100.0%) | 405 (79.4%) |
| Total | 2,070 (44.7%) | 3,377 (72.8%) |
Disability Status by Sex by Age in Ste Genevieve
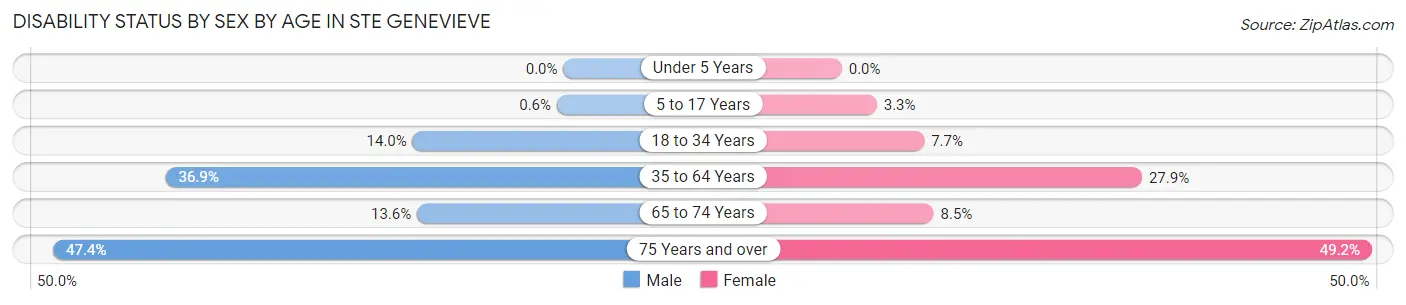
| Age Bracket | Male | Female |
| Under 5 Years | 0 (0.0%) | 0 (0.0%) |
| 5 to 17 Years | 3 (0.6%) | 8 (3.3%) |
| 18 to 34 Years | 89 (14.0%) | 38 (7.6%) |
| 35 to 64 Years | 261 (36.9%) | 229 (27.9%) |
| 65 to 74 Years | 30 (13.6%) | 27 (8.5%) |
| 75 Years and over | 125 (47.3%) | 121 (49.2%) |
Disability Class by Sex by Age in Ste Genevieve
Disability Class: Hearing Difficulty
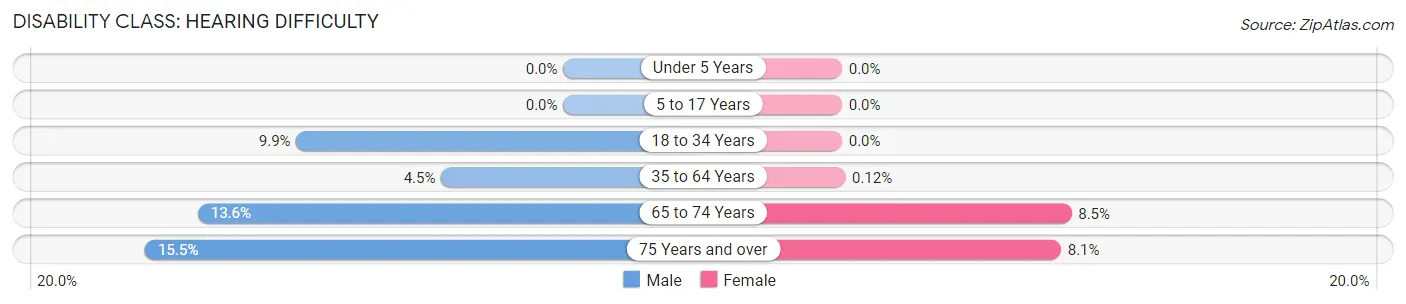
| Age Bracket | Male | Female |
| Under 5 Years | 0 (0.0%) | 0 (0.0%) |
| 5 to 17 Years | 0 (0.0%) | 0 (0.0%) |
| 18 to 34 Years | 63 (9.9%) | 0 (0.0%) |
| 35 to 64 Years | 32 (4.5%) | 1 (0.1%) |
| 65 to 74 Years | 30 (13.6%) | 27 (8.5%) |
| 75 Years and over | 41 (15.5%) | 20 (8.1%) |
Disability Class: Vision Difficulty
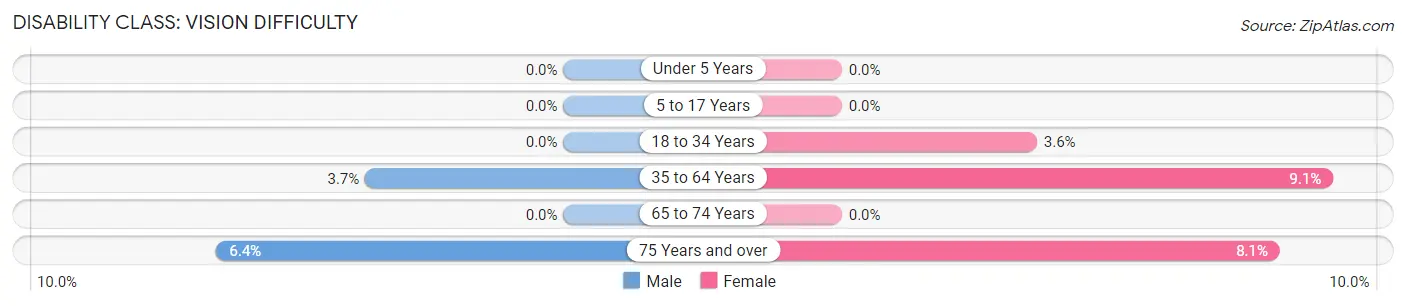
| Age Bracket | Male | Female |
| Under 5 Years | 0 (0.0%) | 0 (0.0%) |
| 5 to 17 Years | 0 (0.0%) | 0 (0.0%) |
| 18 to 34 Years | 0 (0.0%) | 18 (3.6%) |
| 35 to 64 Years | 26 (3.7%) | 75 (9.1%) |
| 65 to 74 Years | 0 (0.0%) | 0 (0.0%) |
| 75 Years and over | 17 (6.4%) | 20 (8.1%) |
Disability Class: Cognitive Difficulty
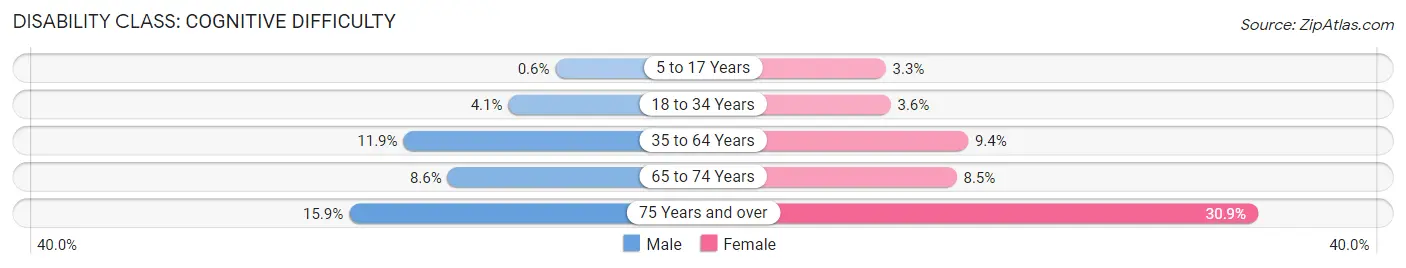
| Age Bracket | Male | Female |
| 5 to 17 Years | 3 (0.6%) | 8 (3.3%) |
| 18 to 34 Years | 26 (4.1%) | 18 (3.6%) |
| 35 to 64 Years | 84 (11.9%) | 77 (9.4%) |
| 65 to 74 Years | 19 (8.6%) | 27 (8.5%) |
| 75 Years and over | 42 (15.9%) | 76 (30.9%) |
Disability Class: Ambulatory Difficulty
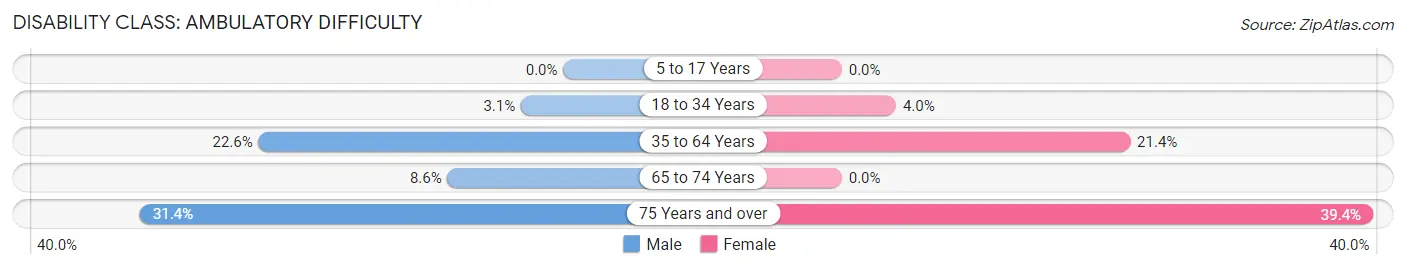
| Age Bracket | Male | Female |
| 5 to 17 Years | 0 (0.0%) | 0 (0.0%) |
| 18 to 34 Years | 20 (3.1%) | 20 (4.0%) |
| 35 to 64 Years | 160 (22.6%) | 176 (21.4%) |
| 65 to 74 Years | 19 (8.6%) | 0 (0.0%) |
| 75 Years and over | 83 (31.4%) | 97 (39.4%) |
Disability Class: Self-Care Difficulty
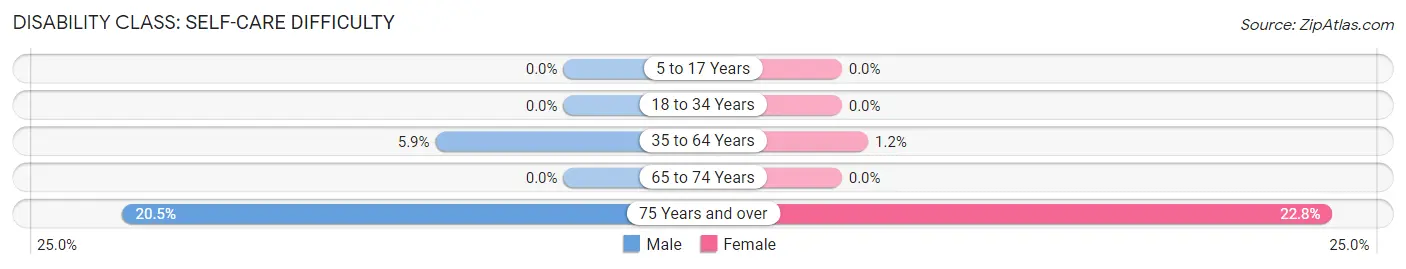
| Age Bracket | Male | Female |
| 5 to 17 Years | 0 (0.0%) | 0 (0.0%) |
| 18 to 34 Years | 0 (0.0%) | 0 (0.0%) |
| 35 to 64 Years | 42 (5.9%) | 10 (1.2%) |
| 65 to 74 Years | 0 (0.0%) | 0 (0.0%) |
| 75 Years and over | 54 (20.4%) | 56 (22.8%) |
Technology Access in Ste Genevieve
Computing Device Access in Ste Genevieve
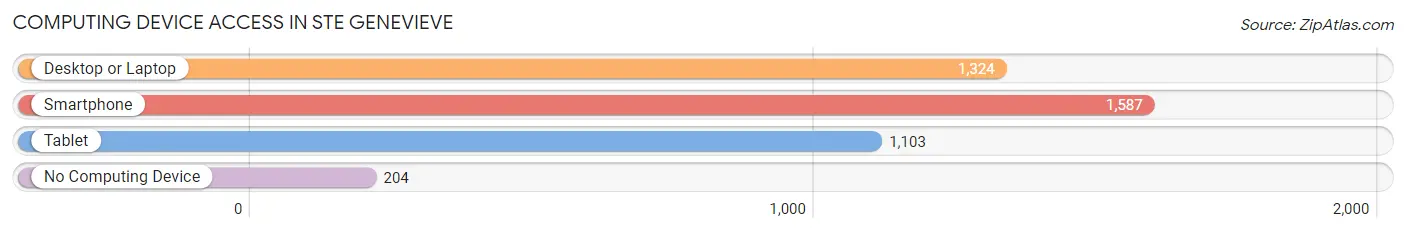
| Device Type | # Households | % Households |
| Desktop or Laptop | 1,324 | 67.7% |
| Smartphone | 1,587 | 81.2% |
| Tablet | 1,103 | 56.4% |
| No Computing Device | 204 | 10.4% |
| Total | 1,955 | 100.0% |
Internet Access in Ste Genevieve
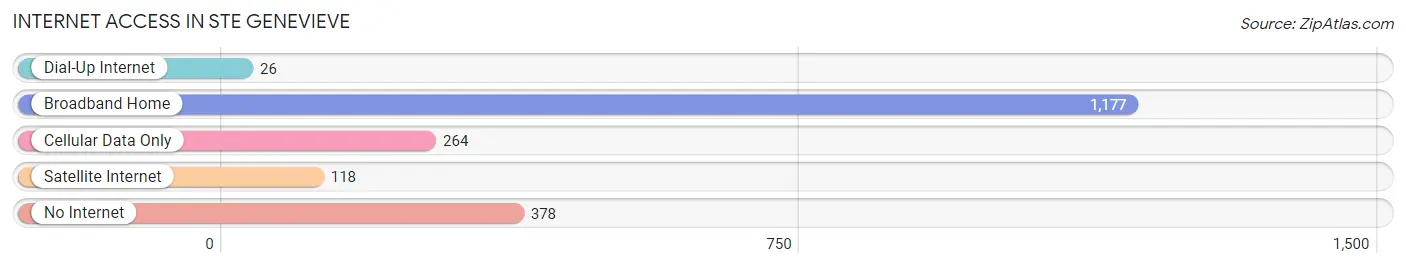
| Internet Type | # Households | % Households |
| Dial-Up Internet | 26 | 1.3% |
| Broadband Home | 1,177 | 60.2% |
| Cellular Data Only | 264 | 13.5% |
| Satellite Internet | 118 | 6.0% |
| No Internet | 378 | 19.3% |
| Total | 1,955 | 100.0% |
Ste Genevieve Summary
History
The history of Ste. Genevieve, Missouri dates back to the early 1700s when French settlers began to establish a settlement in the area. The town was founded in 1735 by Louis Juchereau de St. Denis, a French explorer and trader. He named the settlement after Saint Genevieve, the patron saint of Paris. The town quickly grew and became an important trading post for the French and Native Americans.
In 1763, the area was ceded to the British as part of the Treaty of Paris. The British continued to use the town as a trading post and it became an important stop on the river trade route. In 1793, the area was ceded to the United States as part of the Louisiana Purchase.
The town continued to grow and by the early 1800s, it was a thriving river port. In 1812, the town was incorporated as Ste. Genevieve. During the Civil War, the town was occupied by Union forces and the economy suffered. After the war, the town slowly recovered and by the late 1800s, it was a prosperous agricultural center.
Geography
Ste. Genevieve is located in southeastern Missouri, in the Ozark foothills. It is situated on the west bank of the Mississippi River, about 50 miles south of St. Louis. The town is surrounded by rolling hills and wooded areas. The climate is humid subtropical, with hot, humid summers and mild winters.
The town covers an area of 4.2 square miles and has a population of 4,400. The town is served by US Highway 61 and Missouri State Highway 32.
Economy
The economy of Ste. Genevieve is largely based on agriculture and tourism. The town is home to several wineries and vineyards, as well as a number of historic sites. The town is also home to a number of small businesses, including restaurants, shops, and galleries.
The town is also home to a number of manufacturing companies, including a furniture factory and a plastics plant. The town is also home to a number of educational institutions, including a community college and a technical school.
Demographics
As of the 2010 census, the population of Ste. Genevieve was 4,400. The racial makeup of the town was 95.3% White, 0.7% African American, 0.3% Native American, 0.3% Asian, 0.1% Pacific Islander, and 2.3% from other races. Hispanic or Latino of any race were 2.3% of the population.
The median household income in Ste. Genevieve was $37,917, and the median family income was $45,938. The per capita income was $19,945. About 11.3% of families and 14.2% of the population were below the poverty line, including 19.2% of those under age 18 and 8.2% of those age 65 or over.
Common Questions
What is the Total Population of Ste Genevieve?
Total Population of Ste Genevieve is 4,965.
What is the Total Male Population of Ste Genevieve?
Total Male Population of Ste Genevieve is 2,603.
What is the Total Female Population of Ste Genevieve?
Total Female Population of Ste Genevieve is 2,362.
What is the Ratio of Males per 100 Females in Ste Genevieve?
There are 110.20 Males per 100 Females in Ste Genevieve.
What is the Ratio of Females per 100 Males in Ste Genevieve?
There are 90.74 Females per 100 Males in Ste Genevieve.
What is the Median Population Age in Ste Genevieve?
Median Population Age in Ste Genevieve is 43.6 Years.
What is the Average Family Size in Ste Genevieve
Average Family Size in Ste Genevieve is 2.9 People.
What is the Average Household Size in Ste Genevieve
Average Household Size in Ste Genevieve is 2.4 People.
What is Per Capita Income in Ste Genevieve?
Per Capita income in Ste Genevieve is $27,084.
What is the Median Family Income in Ste Genevieve?
Median Family Income in Ste Genevieve is $68,169.
What is the Median Household income in Ste Genevieve?
Median Household Income in Ste Genevieve is $52,760.
What is Income or Wage Gap in Ste Genevieve?
Income or Wage Gap in Ste Genevieve is 30.5%.
Women in Ste Genevieve earn 69.5 cents for every dollar earned by a man.
What is Inequality or Gini Index in Ste Genevieve?
Inequality or Gini Index in Ste Genevieve is 0.41.
How Large is the Labor Force in Ste Genevieve?
There are 2,134 People in the Labor Forcein in Ste Genevieve.
What is the Percentage of People in the Labor Force in Ste Genevieve?
52.1% of People are in the Labor Force in Ste Genevieve.
What is the Unemployment Rate in Ste Genevieve?
Unemployment Rate in Ste Genevieve is 6.1%.