Zip Codes with the Highest Percentage of Families with Income Below $10,000 in Louisville, KY
RELATED REPORTS & OPTIONS
Family Income | $0-10k
Louisville
Compare Zip Codes
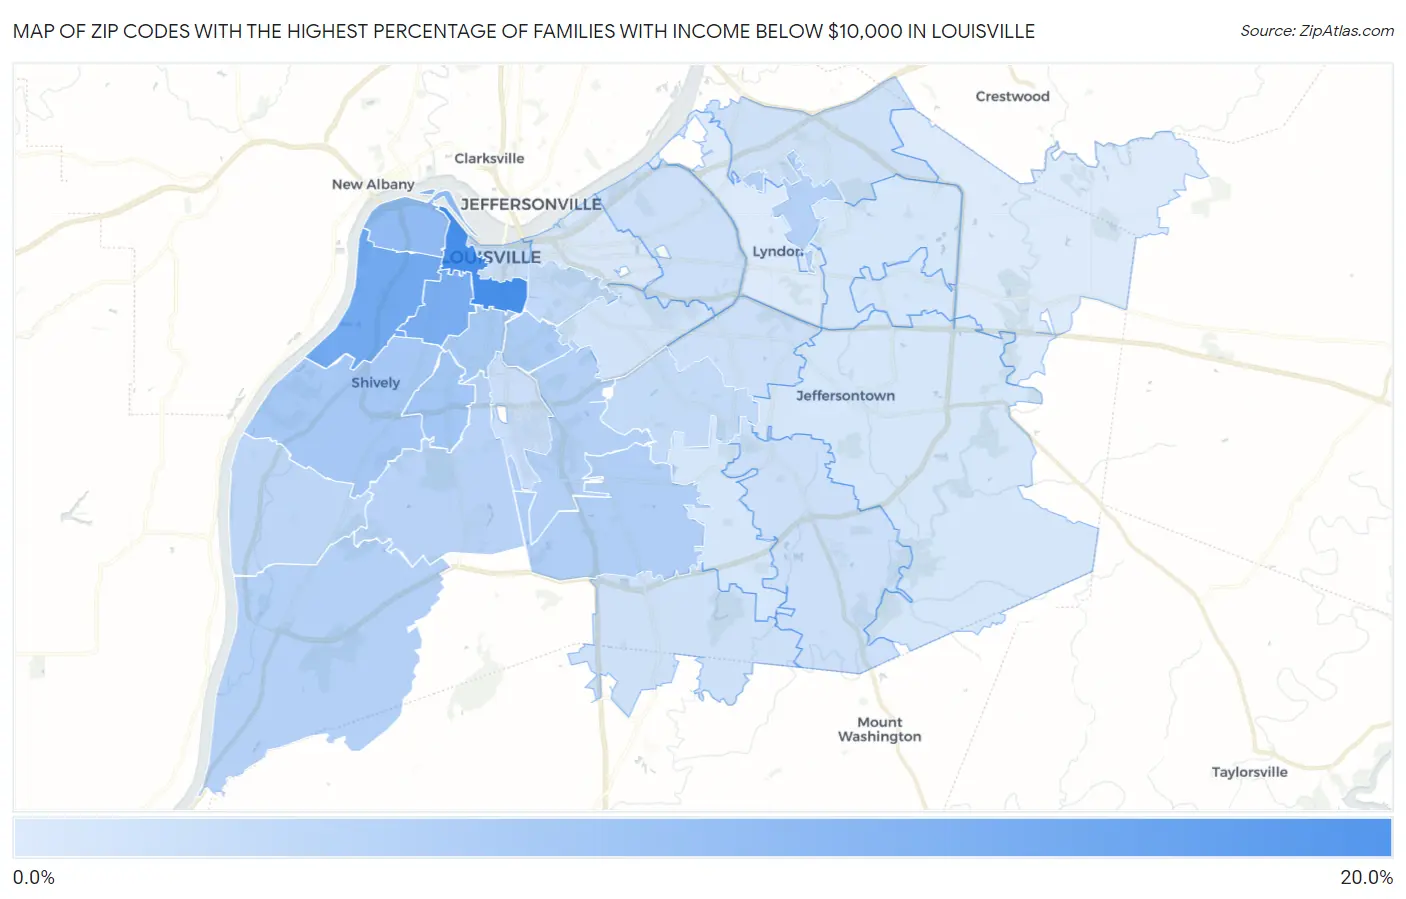
Map of Zip Codes with the Highest Percentage of Families with Income Below $10,000 in Louisville
0.0%
20.0%
Zip Codes with the Highest Percentage of Families with Income Below $10,000 in Louisville, KY
| Zip Code | Families with Income < $10k | vs State | vs National | |
| 1. | 40203 | 16.9% | 4.2%(+12.7)#48 | 3.1%(+13.8)#675 |
| 2. | 40211 | 12.0% | 4.2%(+7.80)#77 | 3.1%(+8.90)#1,317 |
| 3. | 40210 | 11.2% | 4.2%(+7.00)#89 | 3.1%(+8.10)#1,532 |
| 4. | 40212 | 8.5% | 4.2%(+4.30)#132 | 3.1%(+5.40)#2,635 |
| 5. | 40215 | 6.7% | 4.2%(+2.50)#173 | 3.1%(+3.60)#3,901 |
| 6. | 40216 | 6.5% | 4.2%(+2.30)#181 | 3.1%(+3.40)#4,095 |
| 7. | 40208 | 6.2% | 4.2%(+2.00)#195 | 3.1%(+3.10)#4,449 |
| 8. | 40217 | 5.6% | 4.2%(+1.40)#226 | 3.1%(+2.50)#5,190 |
| 9. | 40219 | 5.1% | 4.2%(+0.900)#248 | 3.1%(+2.00)#5,925 |
| 10. | 40272 | 5.0% | 4.2%(+0.800)#253 | 3.1%(+1.90)#6,089 |
| 11. | 40242 | 5.0% | 4.2%(+0.800)#254 | 3.1%(+1.90)#6,132 |
| 12. | 40213 | 4.9% | 4.2%(+0.700)#259 | 3.1%(+1.80)#6,298 |
| 13. | 40214 | 4.4% | 4.2%(+0.200)#277 | 3.1%(+1.30)#7,205 |
| 14. | 40258 | 4.1% | 4.2%(-0.100)#295 | 3.1%(+1.000)#7,908 |
| 15. | 40204 | 3.5% | 4.2%(-0.700)#320 | 3.1%(+0.400)#9,572 |
| 16. | 40218 | 3.2% | 4.2%(-1.00)#339 | 3.1%(+0.100)#10,444 |
| 17. | 40202 | 2.9% | 4.2%(-1.30)#351 | 3.1%(-0.200)#11,594 |
| 18. | 40209 | 2.6% | 4.2%(-1.60)#371 | 3.1%(-0.500)#12,983 |
| 19. | 40207 | 2.4% | 4.2%(-1.80)#381 | 3.1%(-0.700)#13,500 |
| 20. | 40291 | 2.3% | 4.2%(-1.90)#389 | 3.1%(-0.800)#13,909 |
| 21. | 40220 | 2.3% | 4.2%(-1.90)#391 | 3.1%(-0.800)#13,927 |
| 22. | 40229 | 2.2% | 4.2%(-2.00)#395 | 3.1%(-0.900)#14,349 |
| 23. | 40241 | 2.1% | 4.2%(-2.10)#403 | 3.1%(-1.000)#14,844 |
| 24. | 40205 | 1.8% | 4.2%(-2.40)#418 | 3.1%(-1.30)#16,314 |
| 25. | 40228 | 1.5% | 4.2%(-2.70)#442 | 3.1%(-1.60)#17,821 |
| 26. | 40243 | 1.5% | 4.2%(-2.70)#444 | 3.1%(-1.60)#17,867 |
| 27. | 40223 | 1.4% | 4.2%(-2.80)#447 | 3.1%(-1.70)#18,280 |
| 28. | 40299 | 1.3% | 4.2%(-2.90)#450 | 3.1%(-1.80)#18,700 |
| 29. | 40206 | 1.2% | 4.2%(-3.00)#459 | 3.1%(-1.90)#19,334 |
| 30. | 40245 | 0.80% | 4.2%(-3.40)#478 | 3.1%(-2.30)#21,204 |
| 31. | 40222 | 0.70% | 4.2%(-3.50)#482 | 3.1%(-2.40)#21,730 |
1
Common Questions
What are the Top 10 Zip Codes with the Highest Percentage of Families with Income Below $10,000 in Louisville, KY?
Top 10 Zip Codes with the Highest Percentage of Families with Income Below $10,000 in Louisville, KY are:
What zip code has the Highest Percentage of Families with Income Below $10,000 in Louisville, KY?
40203 has the Highest Percentage of Families with Income Below $10,000 in Louisville, KY with 16.9%.
What is the Percentage of Families with Income Below $10,000 in Louisville, KY?
Percentage of Families with Income Below $10,000 in Louisville is 4.0%.
What is the Percentage of Families with Income Below $10,000 in Kentucky?
Percentage of Families with Income Below $10,000 in Kentucky is 4.2%.
What is the Percentage of Families with Income Below $10,000 in the United States?
Percentage of Families with Income Below $10,000 in the United States is 3.1%.