Subsaharan African vs Argentinean No Vehicles in Household
COMPARE
Subsaharan African
Argentinean
No Vehicles in Household
No Vehicles in Household Comparison
Sub-Saharan Africans
Argentineans
12.2%
NO VEHICLES IN HOUSEHOLD
0.6/ 100
METRIC RATING
261st/ 347
METRIC RANK
11.2%
NO VEHICLES IN HOUSEHOLD
9.6/ 100
METRIC RATING
219th/ 347
METRIC RANK
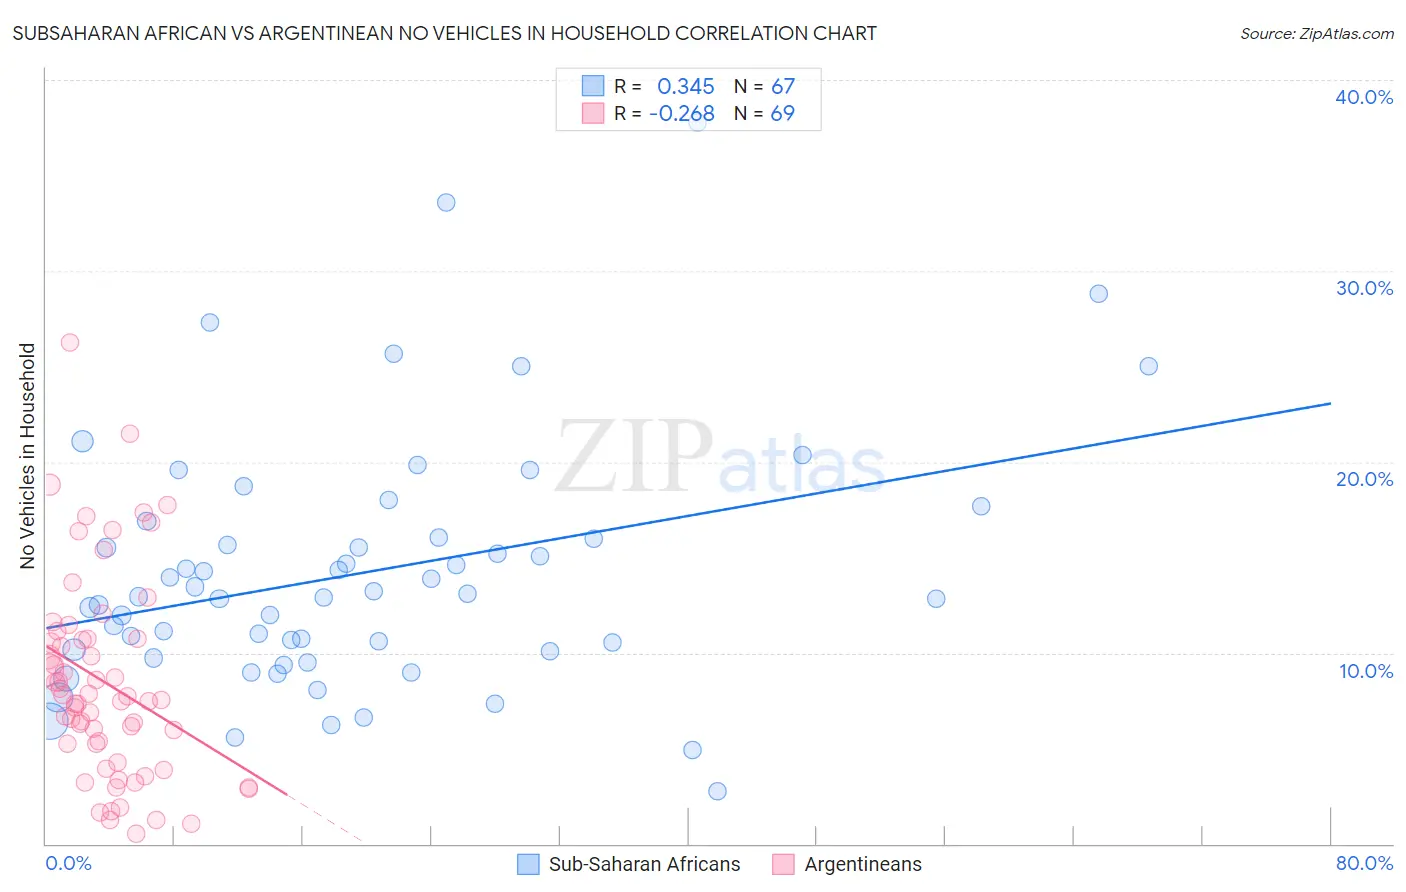
Subsaharan African vs Argentinean No Vehicles in Household Correlation Chart
The statistical analysis conducted on geographies consisting of 506,014,655 people shows a mild positive correlation between the proportion of Sub-Saharan Africans and percentage of households with no vehicle available in the United States with a correlation coefficient (R) of 0.345 and weighted average of 12.2%. Similarly, the statistical analysis conducted on geographies consisting of 296,712,761 people shows a weak negative correlation between the proportion of Argentineans and percentage of households with no vehicle available in the United States with a correlation coefficient (R) of -0.268 and weighted average of 11.2%, a difference of 9.0%.
No Vehicles in Household Correlation Summary
| Measurement | Subsaharan African | Argentinean |
| Minimum | 2.7% | 0.52% |
| Maximum | 37.8% | 26.3% |
| Range | 35.0% | 25.7% |
| Mean | 14.2% | 8.5% |
| Median | 12.9% | 7.5% |
| Interquartile 25% (IQ1) | 10.1% | 4.7% |
| Interquartile 75% (IQ3) | 16.0% | 10.7% |
| Interquartile Range (IQR) | 5.9% | 6.0% |
| Standard Deviation (Sample) | 6.6% | 5.3% |
| Standard Deviation (Population) | 6.5% | 5.2% |
Similar Demographics by No Vehicles in Household
Demographics Similar to Sub-Saharan Africans by No Vehicles in Household
In terms of no vehicles in household, the demographic groups most similar to Sub-Saharan Africans are Immigrants from Liberia (12.2%, a difference of 0.070%), Immigrants from Egypt (12.2%, a difference of 0.22%), Macedonian (12.2%, a difference of 0.39%), Immigrants from Switzerland (12.3%, a difference of 0.69%), and African (12.3%, a difference of 0.93%).
| Demographics | Rating | Rank | No Vehicles in Household |
| Immigrants | Uruguay | 1.3 /100 | #254 | Tragic 11.9% |
| Hondurans | 1.2 /100 | #255 | Tragic 12.0% |
| Liberians | 1.2 /100 | #256 | Tragic 12.0% |
| Nigerians | 0.9 /100 | #257 | Tragic 12.1% |
| South American Indians | 0.9 /100 | #258 | Tragic 12.1% |
| Immigrants | Latvia | 0.8 /100 | #259 | Tragic 12.1% |
| Macedonians | 0.7 /100 | #260 | Tragic 12.2% |
| Sub-Saharan Africans | 0.6 /100 | #261 | Tragic 12.2% |
| Immigrants | Liberia | 0.6 /100 | #262 | Tragic 12.2% |
| Immigrants | Egypt | 0.6 /100 | #263 | Tragic 12.2% |
| Immigrants | Switzerland | 0.5 /100 | #264 | Tragic 12.3% |
| Africans | 0.4 /100 | #265 | Tragic 12.3% |
| Israelis | 0.3 /100 | #266 | Tragic 12.4% |
| Immigrants | Europe | 0.3 /100 | #267 | Tragic 12.5% |
| Immigrants | Africa | 0.2 /100 | #268 | Tragic 12.5% |
Demographics Similar to Argentineans by No Vehicles in Household
In terms of no vehicles in household, the demographic groups most similar to Argentineans are Immigrants from Zaire (11.2%, a difference of 0.010%), Immigrants from Guatemala (11.2%, a difference of 0.12%), Dutch West Indian (11.2%, a difference of 0.23%), Immigrants from Sri Lanka (11.2%, a difference of 0.35%), and Immigrants from Argentina (11.2%, a difference of 0.35%).
| Demographics | Rating | Rank | No Vehicles in Household |
| Immigrants | Western Asia | 13.9 /100 | #212 | Poor 11.0% |
| Immigrants | Hungary | 12.3 /100 | #213 | Poor 11.1% |
| Immigrants | Denmark | 12.1 /100 | #214 | Poor 11.1% |
| Immigrants | Sri Lanka | 10.6 /100 | #215 | Poor 11.2% |
| Immigrants | Argentina | 10.6 /100 | #216 | Poor 11.2% |
| Dutch West Indians | 10.2 /100 | #217 | Poor 11.2% |
| Immigrants | Guatemala | 10.0 /100 | #218 | Tragic 11.2% |
| Argentineans | 9.6 /100 | #219 | Tragic 11.2% |
| Immigrants | Zaire | 9.6 /100 | #220 | Tragic 11.2% |
| Peruvians | 8.4 /100 | #221 | Tragic 11.2% |
| Immigrants | South America | 8.0 /100 | #222 | Tragic 11.3% |
| Uruguayans | 7.7 /100 | #223 | Tragic 11.3% |
| Immigrants | Hong Kong | 7.2 /100 | #224 | Tragic 11.3% |
| Immigrants | Sierra Leone | 6.4 /100 | #225 | Tragic 11.3% |
| Immigrants | Somalia | 5.4 /100 | #226 | Tragic 11.4% |