Zip Codes with the Highest Percentage of Population with a Degree in Liberal Arts and History in Weatherford, TX
RELATED REPORTS & OPTIONS
Liberal Arts and History
Weatherford
Compare Zip Codes
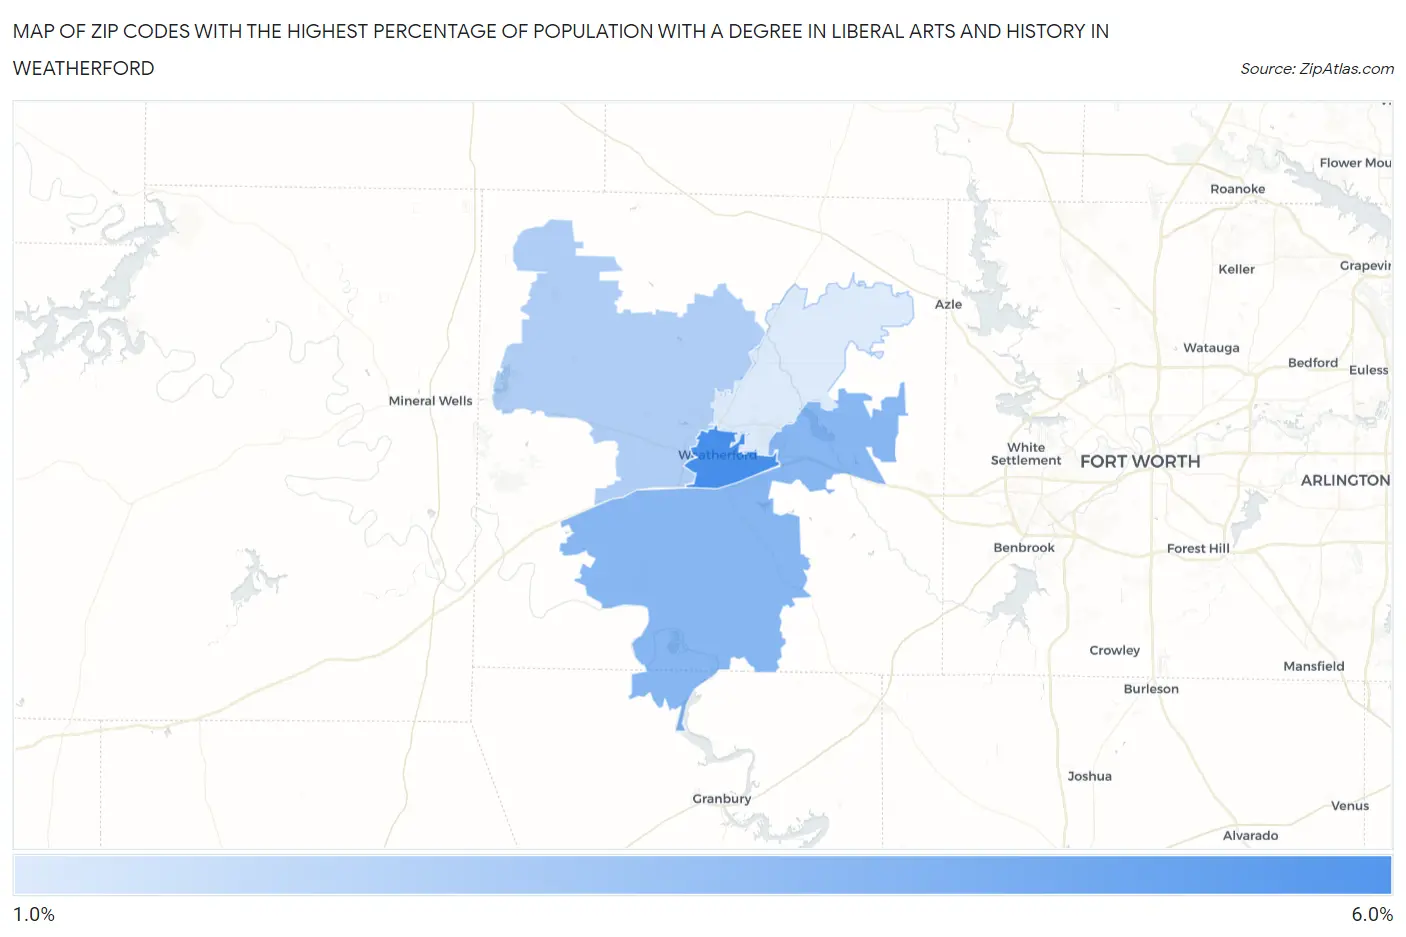
Map of Zip Codes with the Highest Percentage of Population with a Degree in Liberal Arts and History in Weatherford
0.0%
6.0%
Zip Codes with the Highest Percentage of Population with a Degree in Liberal Arts and History in Weatherford, TX
| Zip Code | % Graduates | vs State | vs National | |
| 1. | 76086 | 5.3% | 4.2%(+1.16)#525 | 4.9%(+0.435)#10,417 |
| 2. | 76087 | 3.8% | 4.2%(-0.371)#834 | 4.9%(-1.09)#15,599 |
| 3. | 76088 | 2.8% | 4.2%(-1.31)#1,054 | 4.9%(-2.03)#18,875 |
| 4. | 76085 | 1.7% | 4.2%(-2.41)#1,282 | 4.9%(-3.13)#21,996 |
1
Common Questions
What are the Top 3 Zip Codes with the Highest Percentage of Population with a Degree in Liberal Arts and History in Weatherford, TX?
Top 3 Zip Codes with the Highest Percentage of Population with a Degree in Liberal Arts and History in Weatherford, TX are:
What zip code has the Highest Percentage of Population with a Degree in Liberal Arts and History in Weatherford, TX?
76086 has the Highest Percentage of Population with a Degree in Liberal Arts and History in Weatherford, TX with 5.3%.
What is the Percentage of Population with a Degree in Liberal Arts and History in Weatherford, TX?
Percentage of Population with a Degree in Liberal Arts and History in Weatherford is 3.4%.
What is the Percentage of Population with a Degree in Liberal Arts and History in Texas?
Percentage of Population with a Degree in Liberal Arts and History in Texas is 4.2%.
What is the Percentage of Population with a Degree in Liberal Arts and History in the United States?
Percentage of Population with a Degree in Liberal Arts and History in the United States is 4.9%.